Classification Modeling with Azure ML Studio
Sep 8, 2020 • 13 Minute Read
Introduction
Classification modeling is one of the two most widely used machine learning algorithms, the other one being regression. Classification algorithms are used in cases when the target variable is categorical. There are several use cases where classification algorithms are used, such as credit card fraud prediction, email classification into spam and ham, employee attrition prediction, etc. In this guide, you will work on the use case of loan application approval, where you will build classification models to predict approval of loans. You will build and evaluate the models with Azure Machine Learning Studio.
Data
In this guide, you will work with a fictitious data set of loan applicants that contains 600 observations and nine variables, as described below:
-
Is_graduate Whether the applicant is a graduate ("Yes") or not ("No").
-
Income Annual Income of the applicant (in US dollars).
-
Loan_amount Loan amount (in US dollars) for which the application was submitted.
-
Credit_score Whether the applicant's credit score was satisfactory or not.
-
Age The applicant’s age in years.
-
Sex Whether the applicant is female (F) or male (M).
-
approval_status Whether the loan application was approved ("Yes") or not ("No"). This is the dependent variable.
-
Investment Declared Investment of the applicant (in US dollars).
-
Purpose Purpose of applying for the loan.
You will start by loading the data.
Loading Data
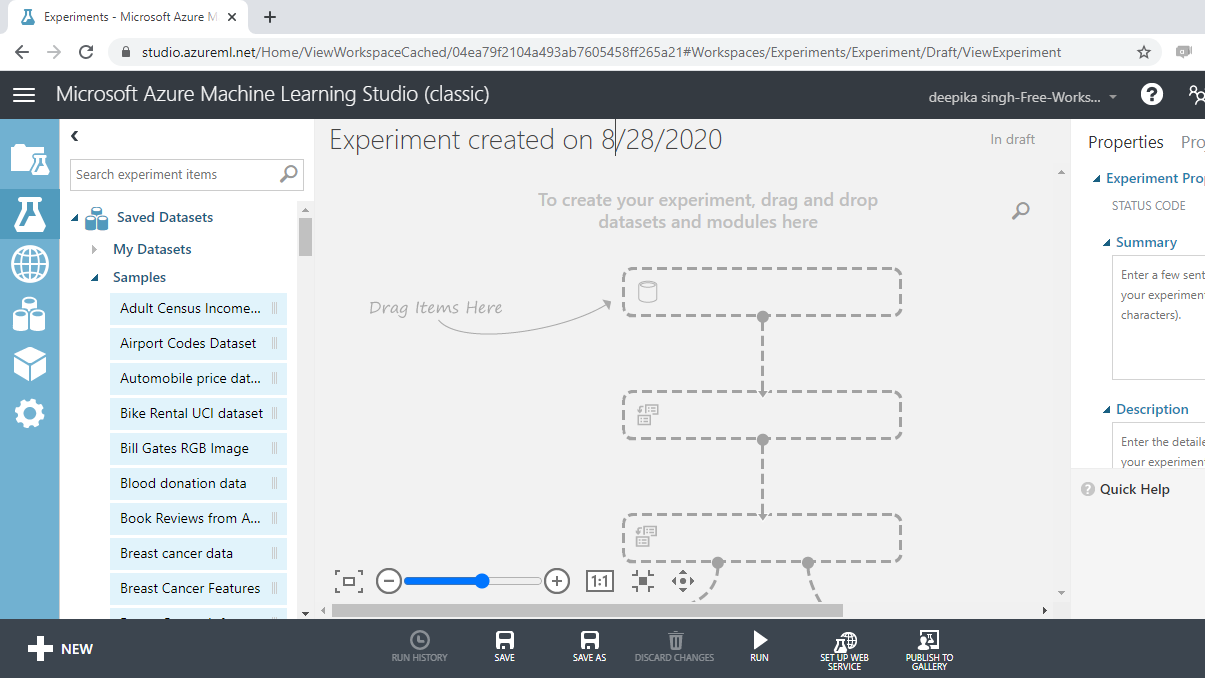
Once you have logged into your Azure Machine Learning Studio account, click on the EXPERIMENTS option, listed on the left sidebar, followed by the NEW button. Next, click on the blank experiment and the following screen will be displayed.
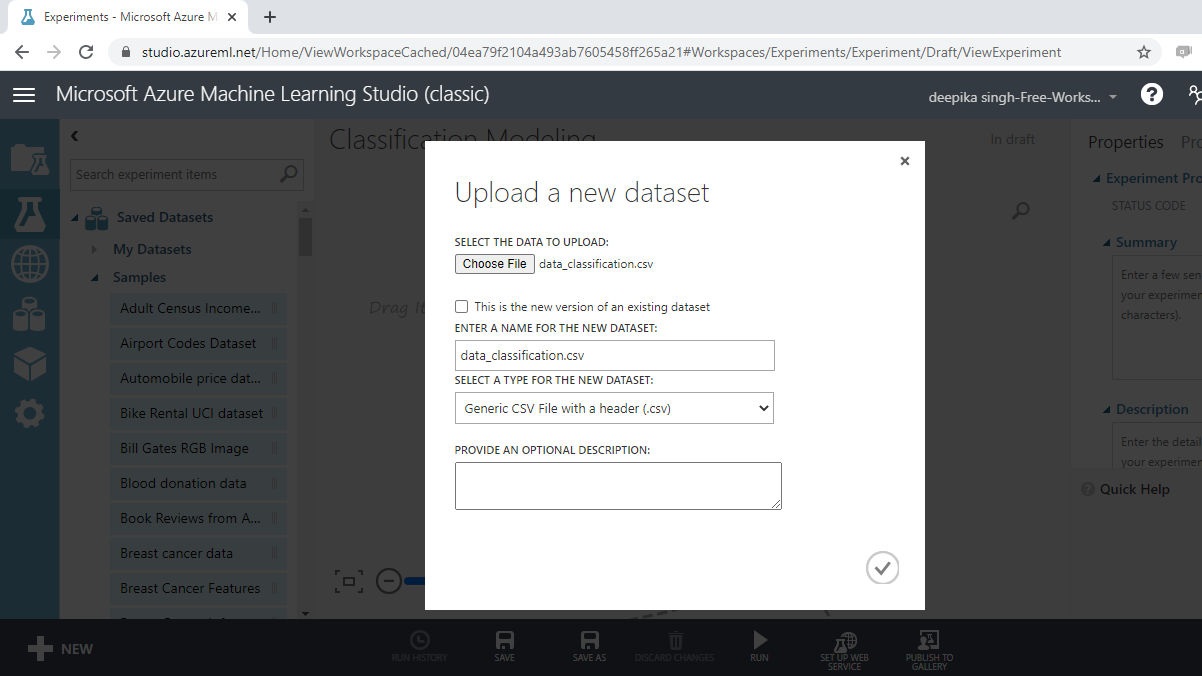
Give the name "Classification Modeling" to the workspace. Next you will load the data into the workspace. Click NEW, and select the DATASET option. This will open the window shown below, which can be used to upload the dataset from the local system. Upload the data named data_classification.csv.
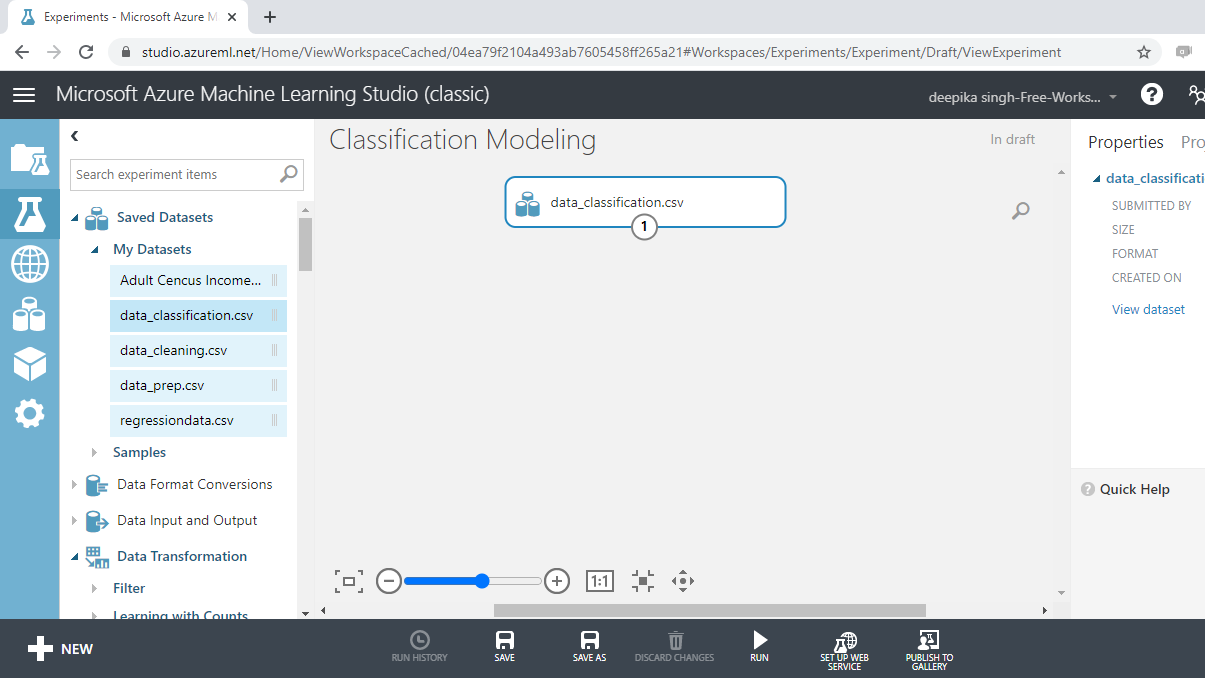
Once the file is loaded, you can see it in the Saved Datasets option. The next step is to drag it from the Saved Datasets list into the workspace.
Exploring the Data
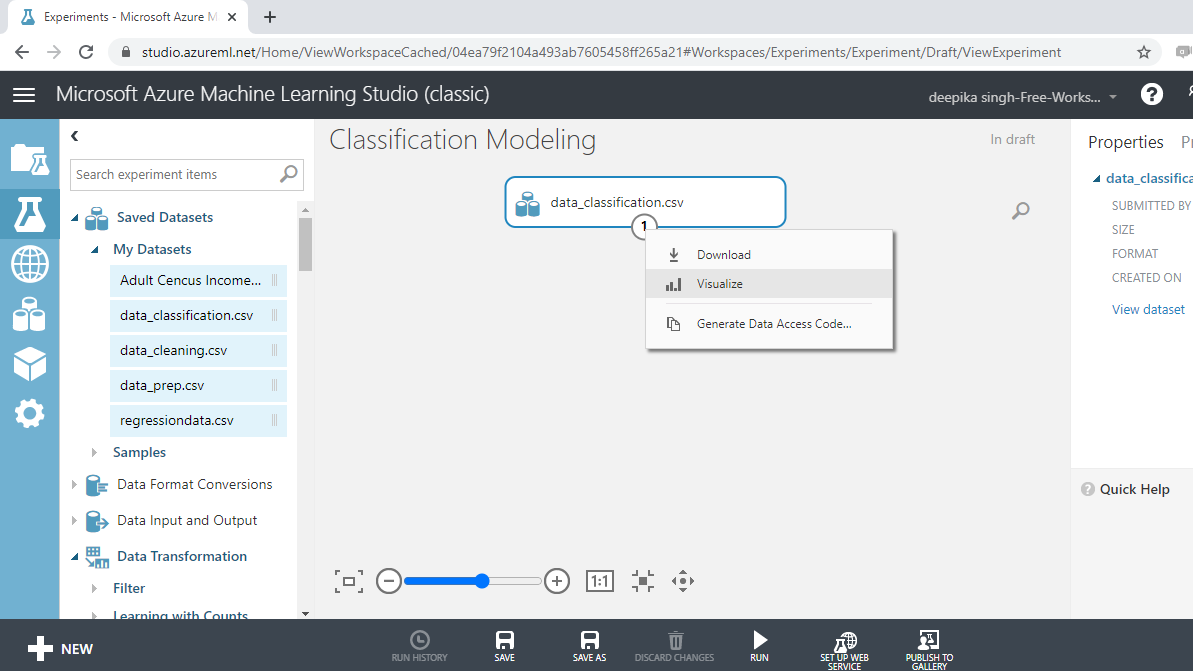
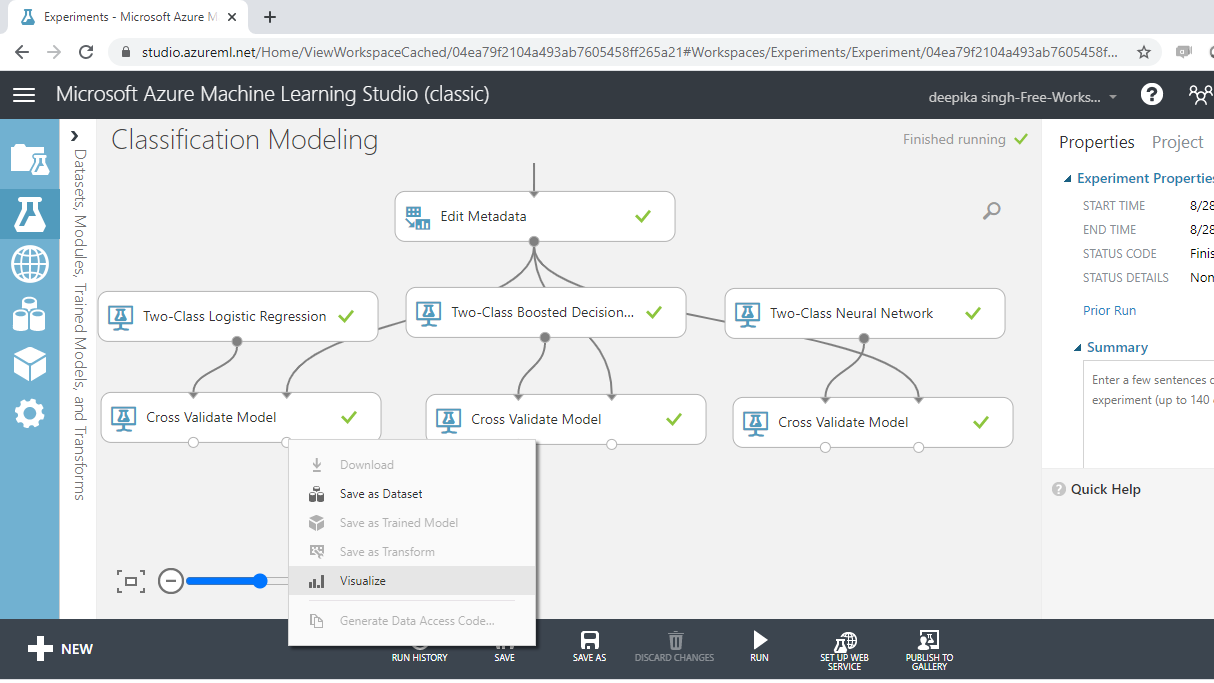
Exploring the data helps in understanding the variables and its structure. This helps in data cleaning, data preprocessing and also in feature engineering. To explore the data, right-click and select the Visualize option as shown below.
Select the different variables to examine the basic statistics. For example, the image below displays the details for the variable Credit_score.
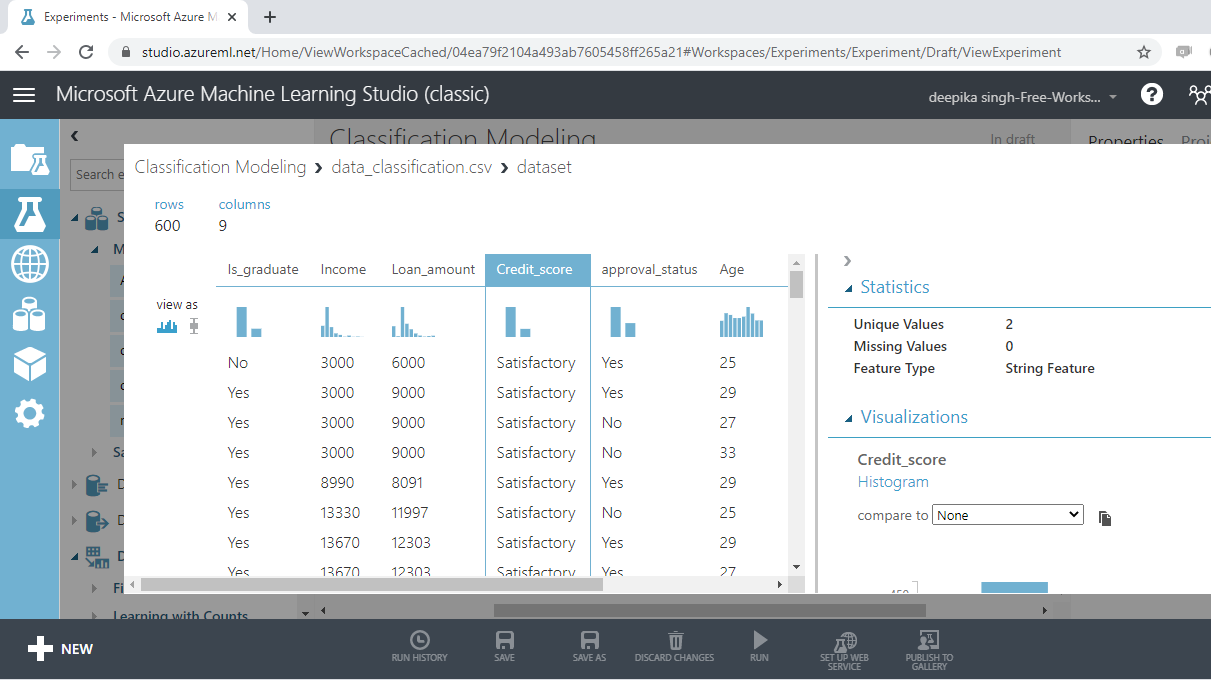
The Statistics section on the right-hand side displays summary statistic values for the variable. It is shown as String Feature with two unique values. Such features need to be converted to categorical variables.
Convert Data Types
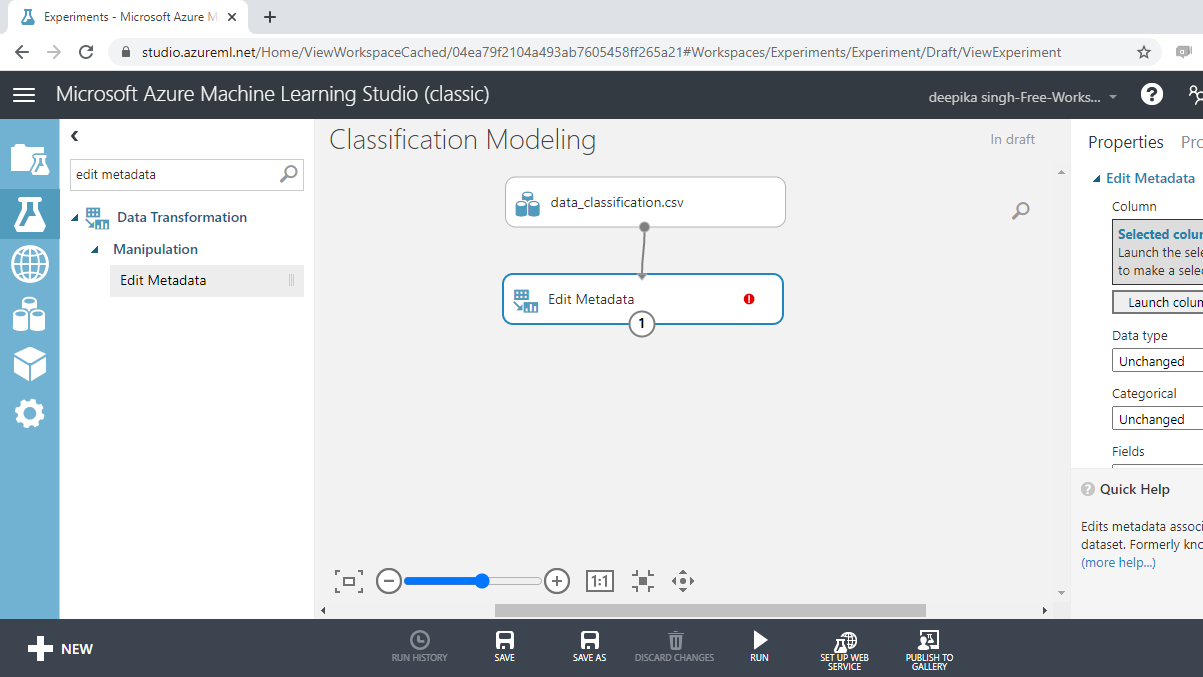
In this section, you will convert data types. Start by typing "edit metadata" in the search bar to find the Edit Metadata module, and then drag it into the workspace.
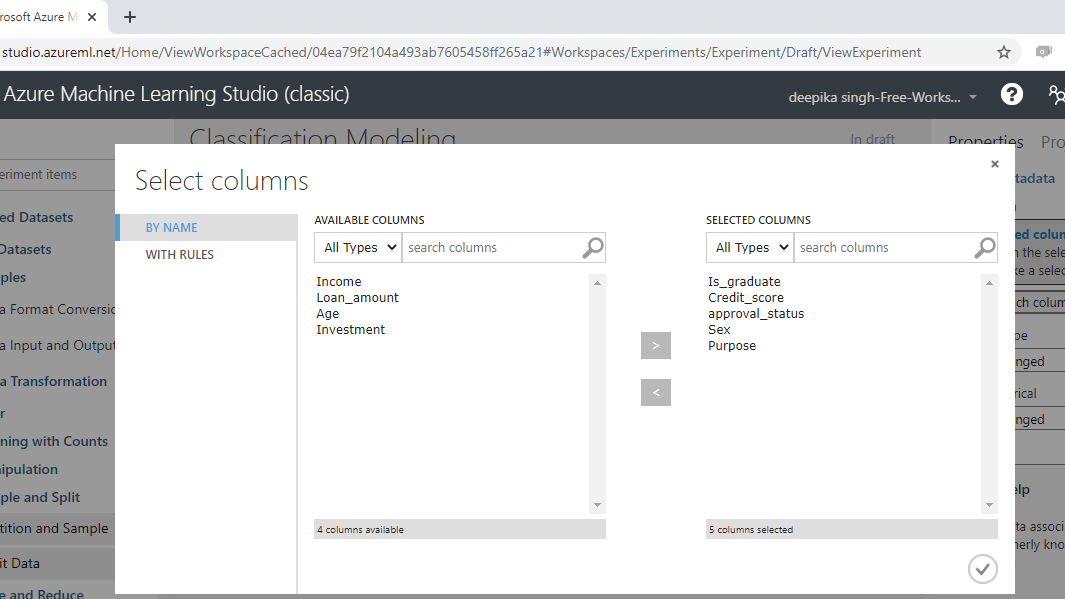
The next step is to click on the Launch column selector option placed in the right hand side of the workspace, and select the string variables from the available columns.
Once you have made selections, the selected columns will be displayed in the workspace. Next, from the dropdown options under Categorical, select the Make categorical option.
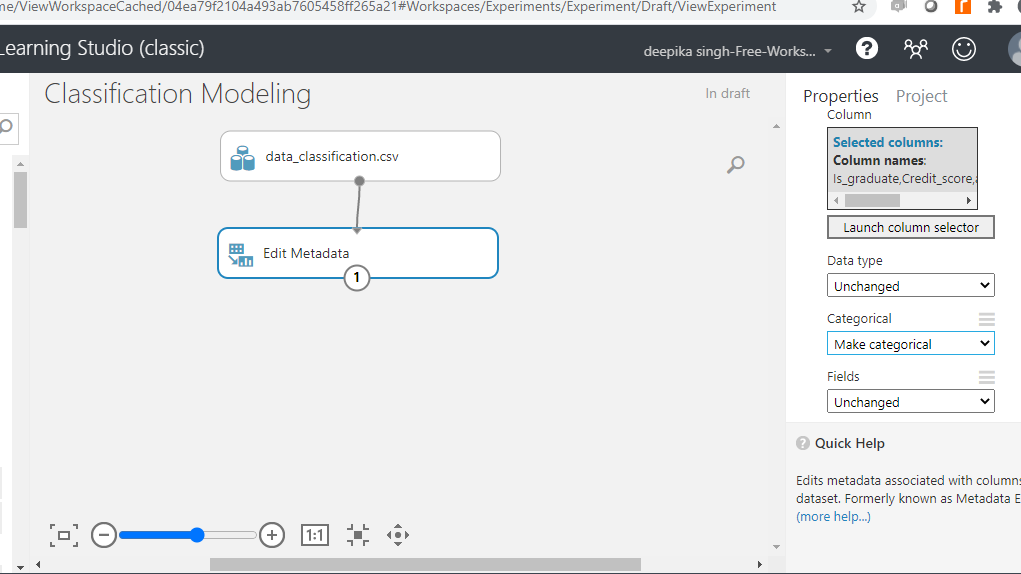
Next, click on the Run button at the bottom of the workspace to execute the operation.
Classification Algorithms
There are several classification algorithms, and you will work with three different types of algorithms.
-
Two-Class Logistic Regression: This module is used for predicting binary outcomes with logistic regression. This algorithm predicts the two target classes by fitting data to a logistic function. The logistic function estimates the probability of occurrence of an event (in this case, loan approval or not), and converts it into the target class of the dependent variable, approval_status.
-
Two-Class Boosted Decision Tree: This module creates a binary classifier using the boosted decision tree algorithm. This algorithm is based on the ensemble learning model, in which every tree builds upon the previous tree by correcting its error. For the data used in this guide, every single tree will make predictions on the target class of the dependent variable, approval_status. The final predictions are based on the entire ensemble of trees taken together.
-
Two-Class Neural Network: This module uses the neural network algorithm for binary classification. A neural network is a set of interconnected layers, and is used to solve many challenging artificial intelligence problems. They often outperform traditional machine learning models because they have the advantages of non-linearity, variable interactions, and customization. For the data used, this algorithm creates a network of input, output, and hidden layers to make predictions of the target class, approval_status.
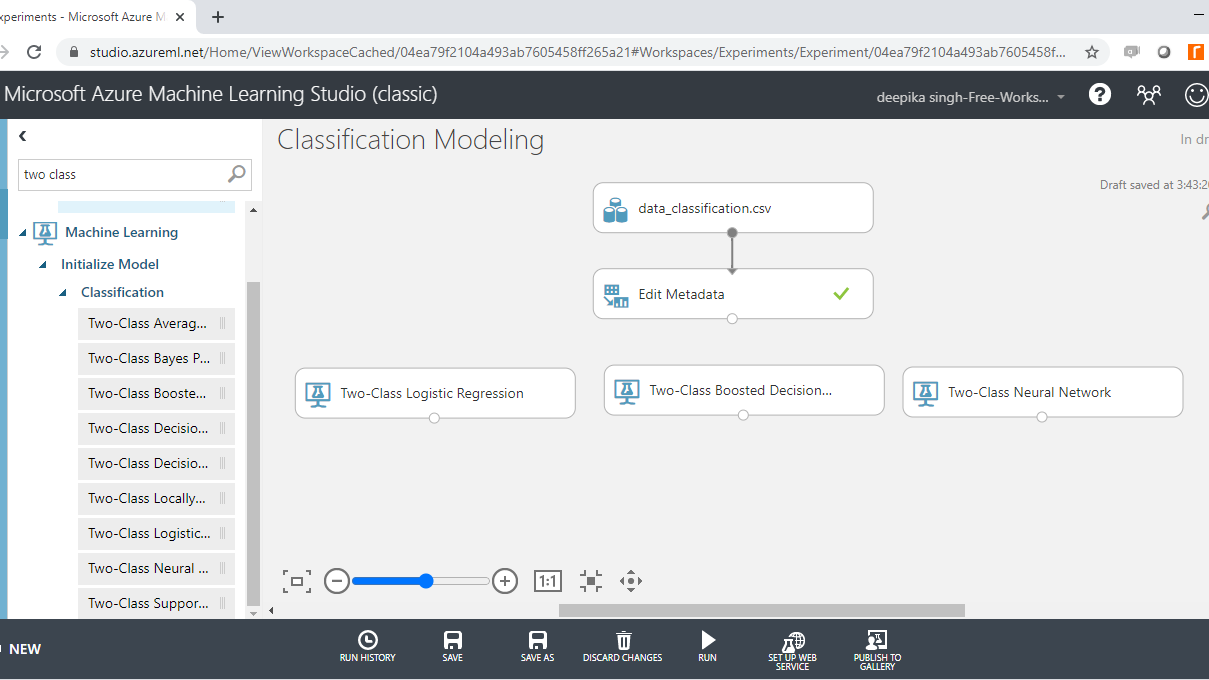
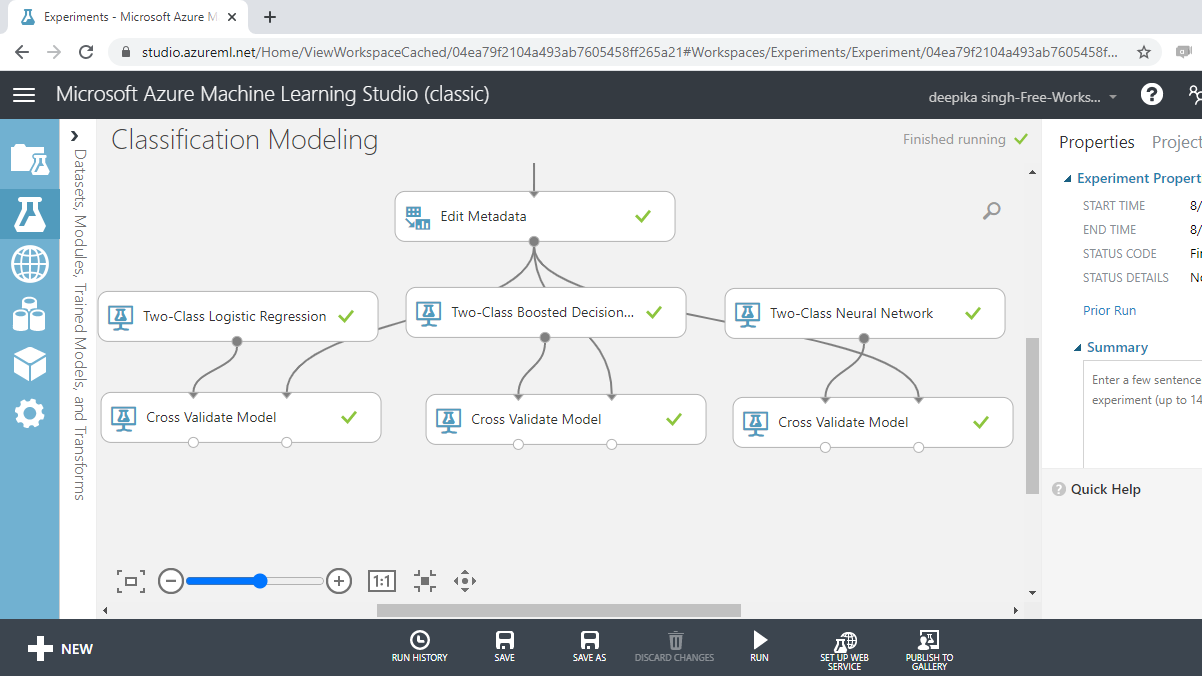
Search and drag these modules into the workspace as shown below.
Cross Validation
Model validation plays an integral part in building powerful and robust machine learning models. Model validation helps ensure that the model performs well on new data, and helps in selecting the best model, the parameters, and the accuracy metrics. One popular cross validation technique is k-fold cross validation.
In k-fold cross-validation, the data is divided into k folds. The model is trained on k-1 folds with one fold held back for testing. For example, if k is set to ten, then the data will be divided into ten equal halves. After that, the model will be built on the first nine halves, while the evaluation will be done on the tenth half or fold. This process gets repeated to ensure each fold of the dataset gets the chance to be the held back set. Once the process is completed, you can summarize the evaluation metric using the mean or/and the standard deviation.
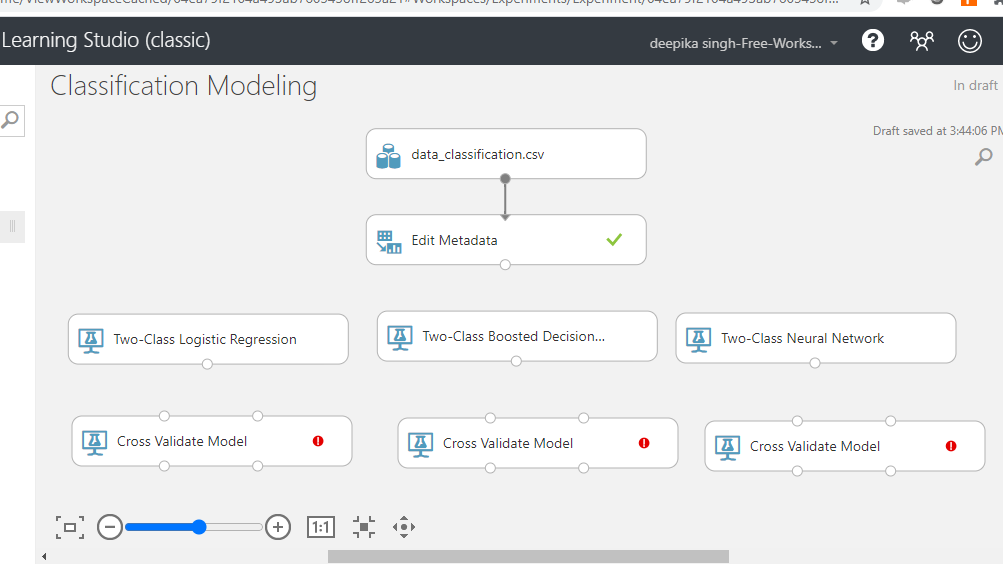
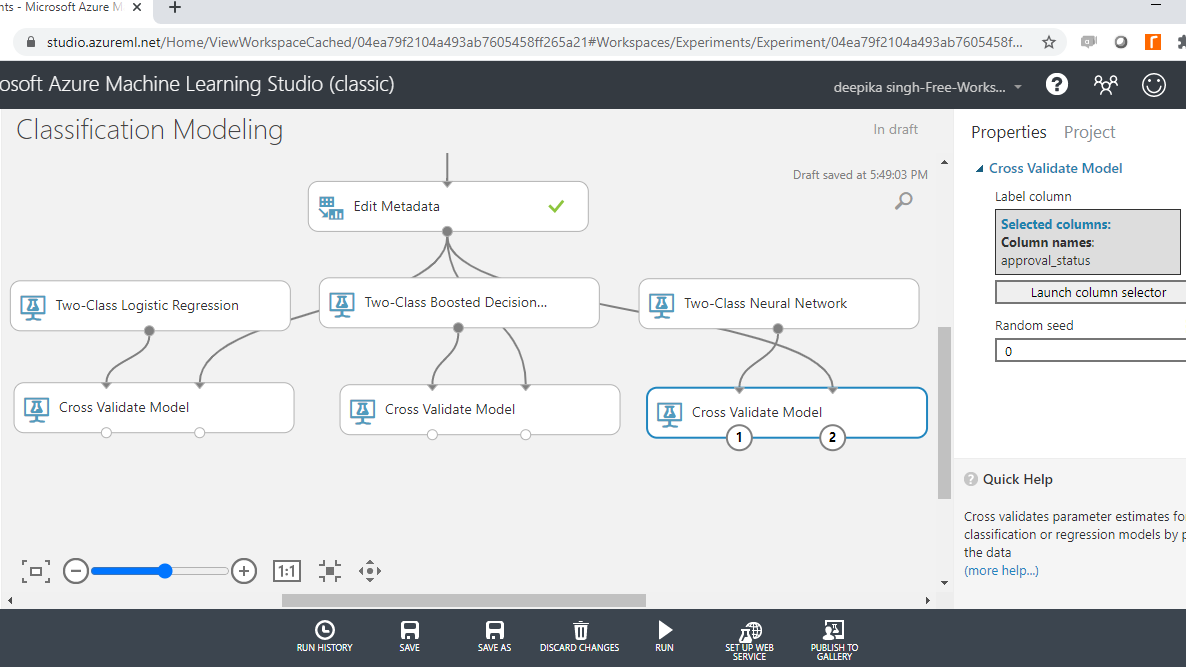
The Cross Validate Model module performs this task in Azure Machine Learning Studio. Search and drag three Cross Validate Model modules into the workspace as shown below.
Configuring Cross Validation Modules
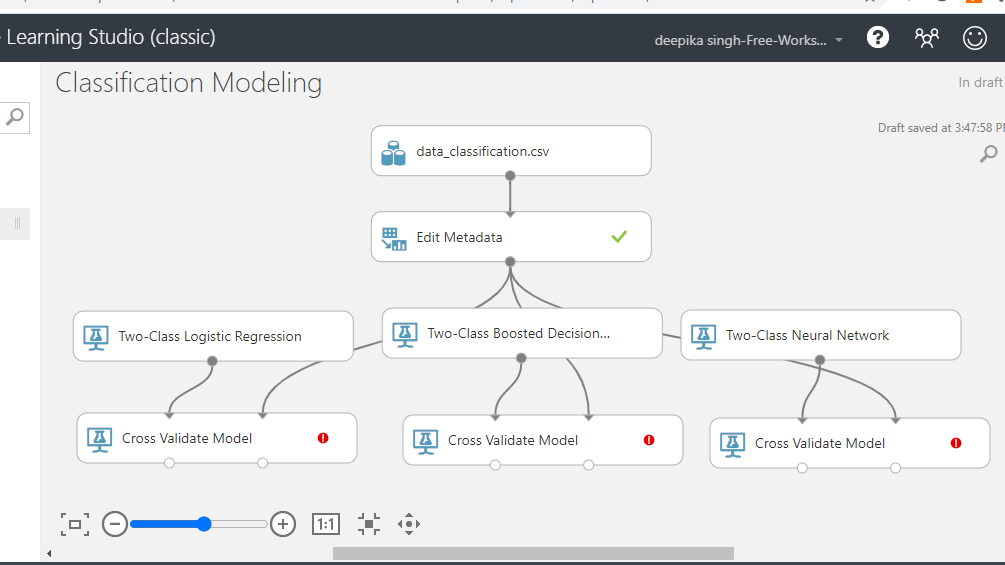
In this step, you will configure the module. The first step is to connect the various modules in the workspace as shown below.
You can see the red flag in the Cross Validate Model, which needs to be corrected. Click on the Launch column selector option, and select the target variable, approval_status, as shown below.
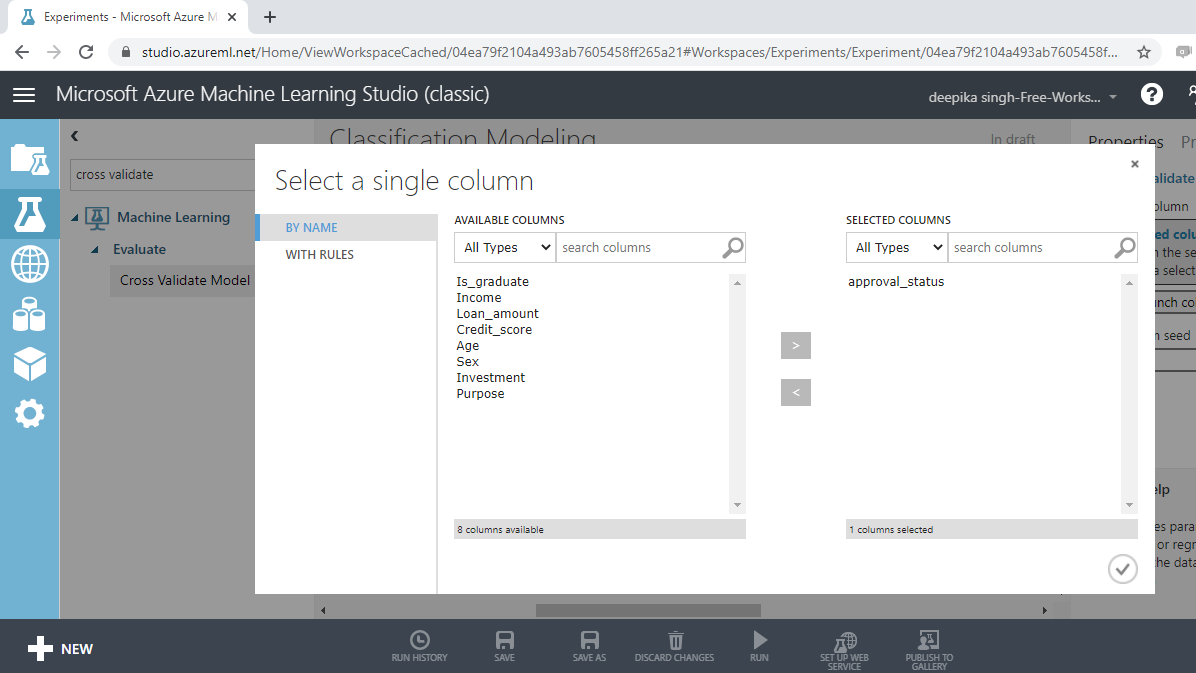
Repeat the process for all the Cross Validate Model modules.
Train the Model
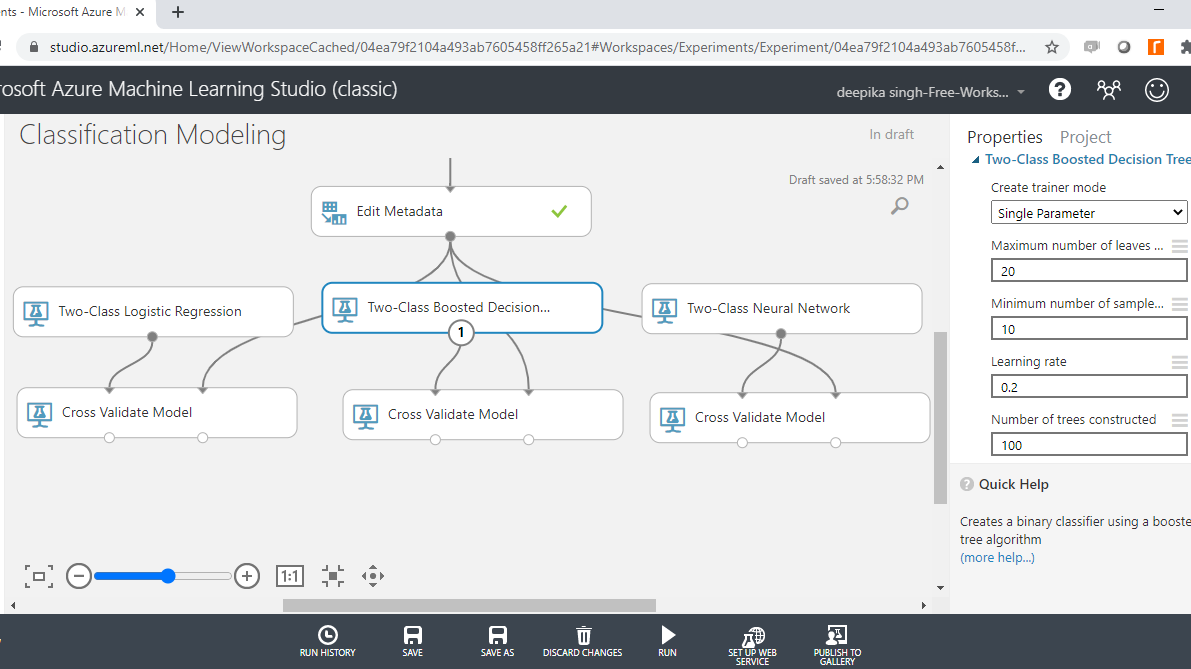
The next step is to specify the parameters of the three algorithms, starting with Two-Class Boosted Decision Tree. To do this, click on the module and you will see several training parameters. For Create trainer mode, select the Single Parameter option that is used when you know how you want to configure the algorithm. The second parameter is Maximum number of leaves per tree, which indicates the maximum number of terminal nodes to be created in any tree. Set this value to 20. Fill the other options as shown below.
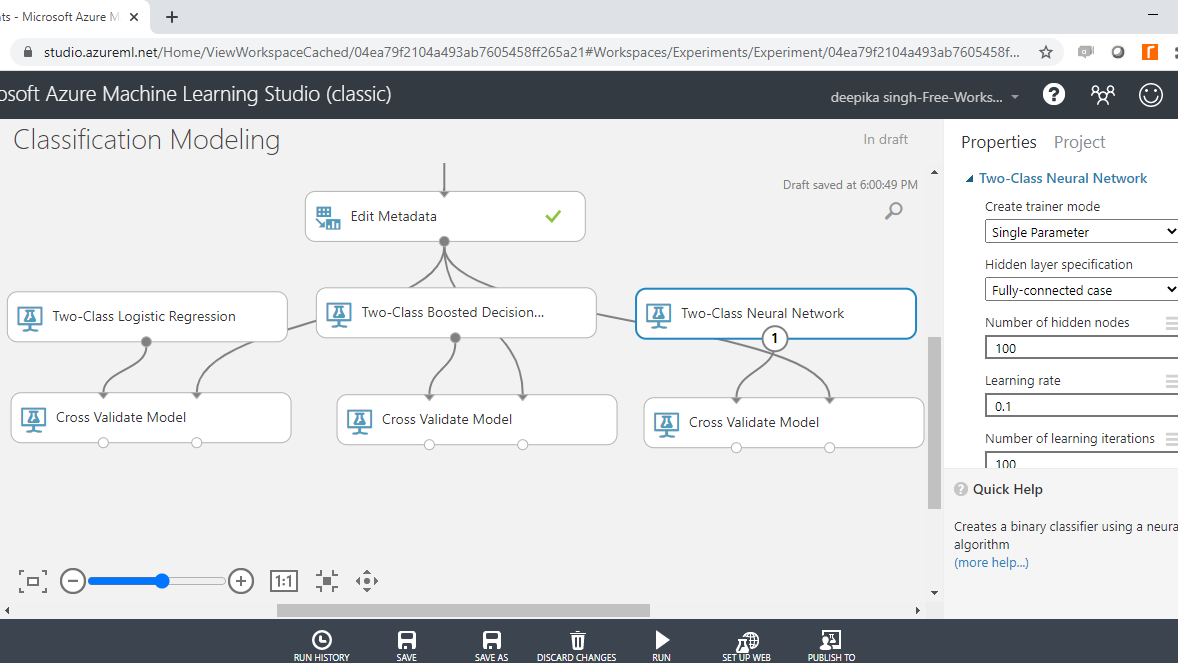
The next step is to configure the Two-Class Neural Network module as shown below. The parameters of the algorithm are configured in this step.
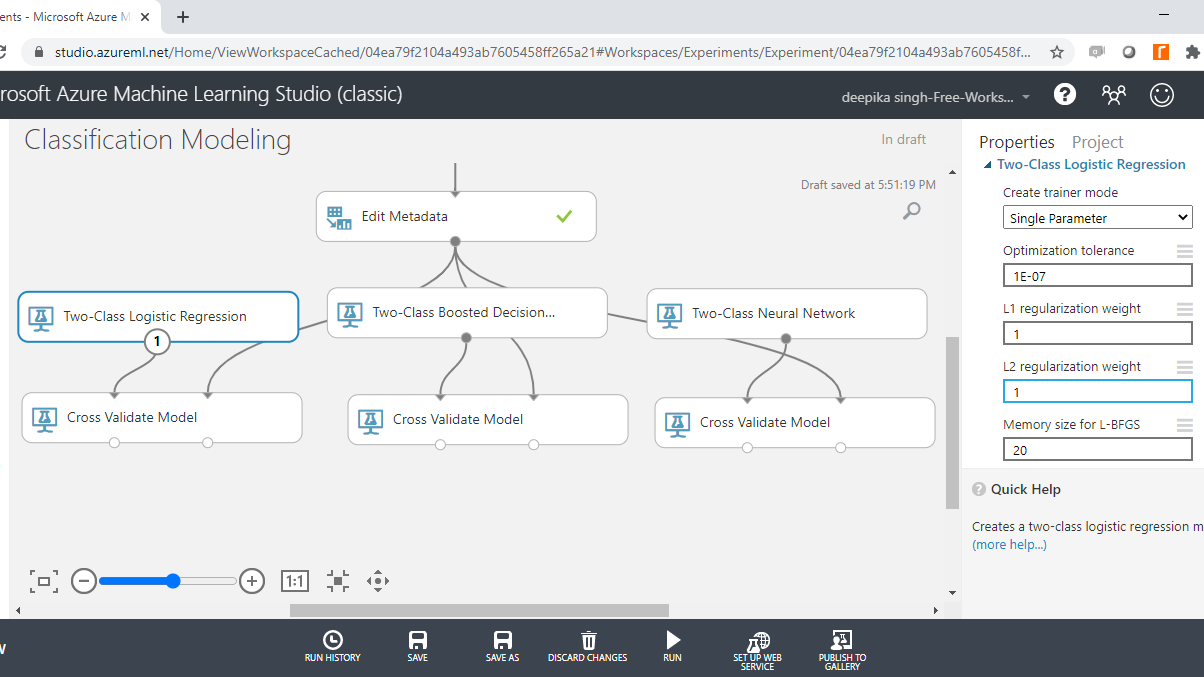
Finally, specify the parameters of Two-Class Logistic Regression module.
To complete the operation, run the experiment. The green tick mark on each module denotes that the module has been run successfully.
Model Evaluation
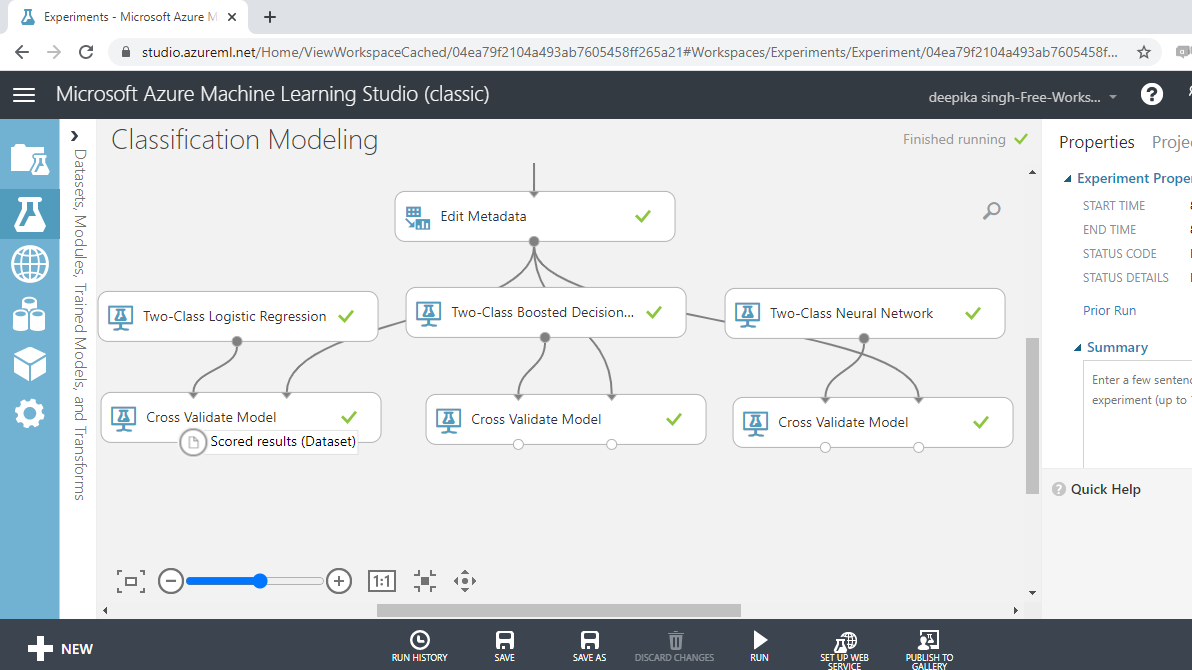
You have built the predictive model and the next step is to evaluate the performance of your predictive model. The left output port of Cross Validate Model contains the Scored results.
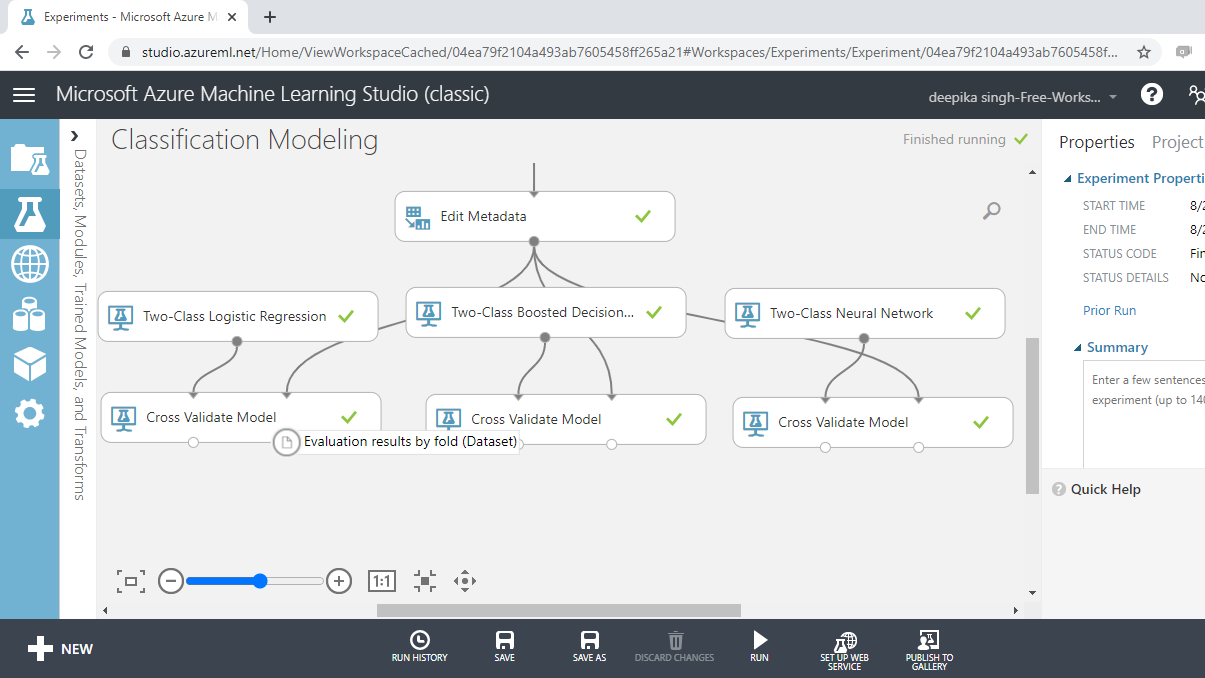
The right output port contains the Evaluation results by fold. You will use this port to evaluate model performance.
Logistic Regression Evaluation
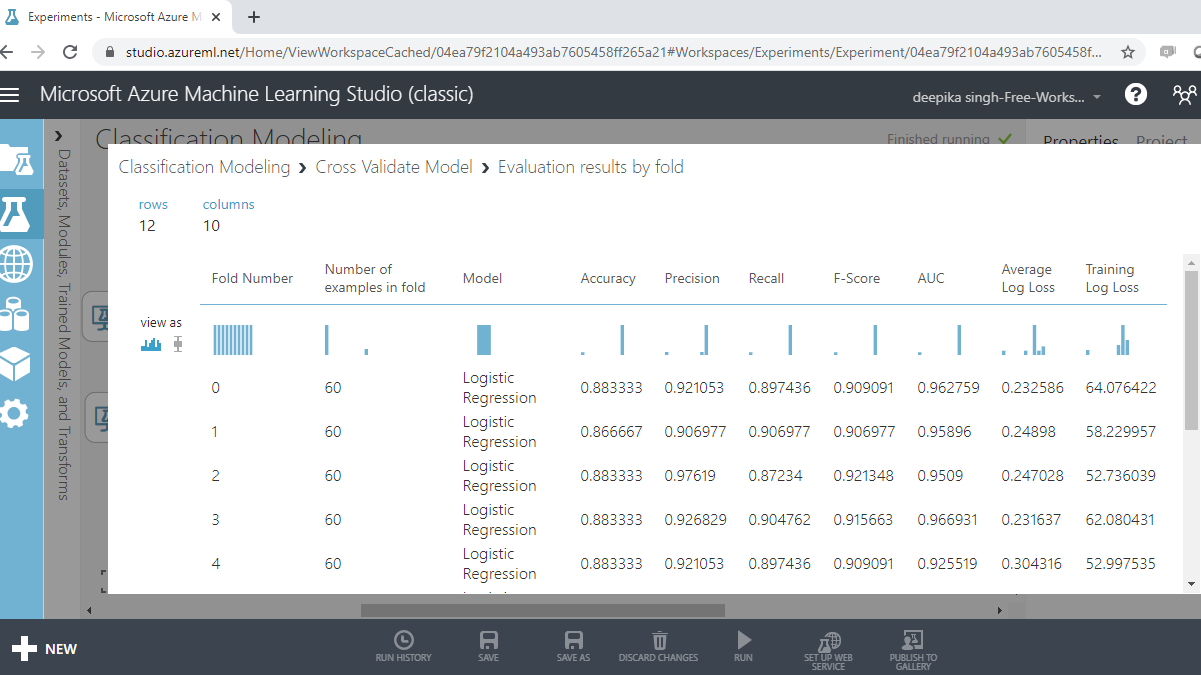
Start with the results for Two-Class Logistic Regression. Click on Visualize.
The following output will be displayed to show the evaluation results by folds. There are ten folds, zero through nine, and for every fold you have results across several metrics such as accuracy, precision, recall, and so on.
If you scroll downwards, you will see the mean results across the ten folds.
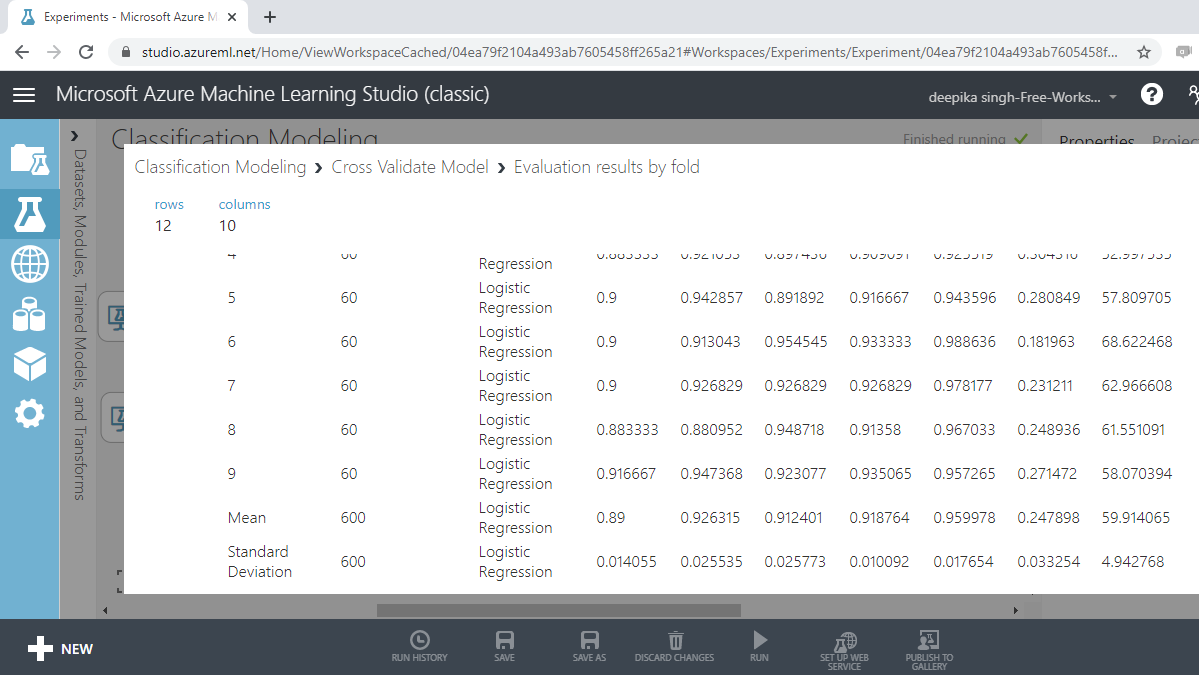
From the above output, you can infer that the mean accuracy, F-score, and AUC value for logistic regression model is 0.89, 0.92 and 0.96, respectively.
Boosted Tree Evaluation
Visualizing the result for boosted trees will give the following outputs.


From the above output, you can infer that the mean accuracy, F-score and AUC value for boosted tree model is 0.91, 0.932 and 0.967, respectively.
Neural Net Evaluation
Visualizing the result for neural net will give the following outputs.
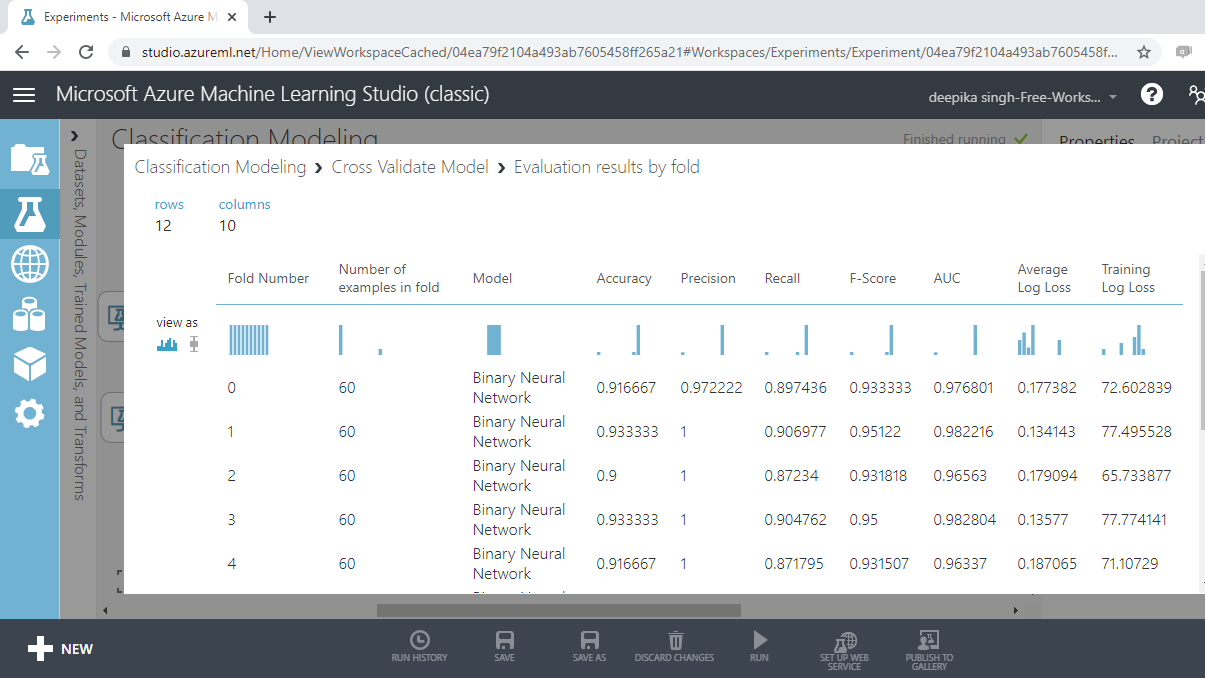

From the above output, you can infer that the mean accuracy, F-score, and AUC value for the neural network model are 0.92, 0.935, and 0.97, respectively.
Comparison of the Three Algorithms
All three machine learning algorithms performed well, but the neural network algorithm performed marginally better than the other two algorithms across the evaluation metrics of accuracy, F-score, and AUC value.
Conclusion
In this guide, you learned how to perform different types of classification models in Azure Machine Learning Studio. You learned how to use the modules in Azure Machine Learning Studio to build and evaluate logistic regression, boosted tree, and neural network models. You also learned how to cross validate and compare these classification algorithms.
To learn more about data science and machine learning using Azure Machine Learning Studio, please refer to the following guides: