Model Validation in Azure ML Studio
Sep 11, 2020 • 14 Minute Read
Introduction
To build robust and high-performing machine learning models, it is important to test and evaluate the performance of algorithms. This is done with the help of model validation. In this guide, you will learn how to validate machine learning models using 1) the holdout approach and 2) the cross-validation technique.
Data
In this guide, you will work with the automobile price data available in Azure ML Studio. The dataset contains 205 rows and 26 columns, with features such as the make, model, technical specifications, and price of individual automobiles. The data comes from the UCI Machine Learning Repository.
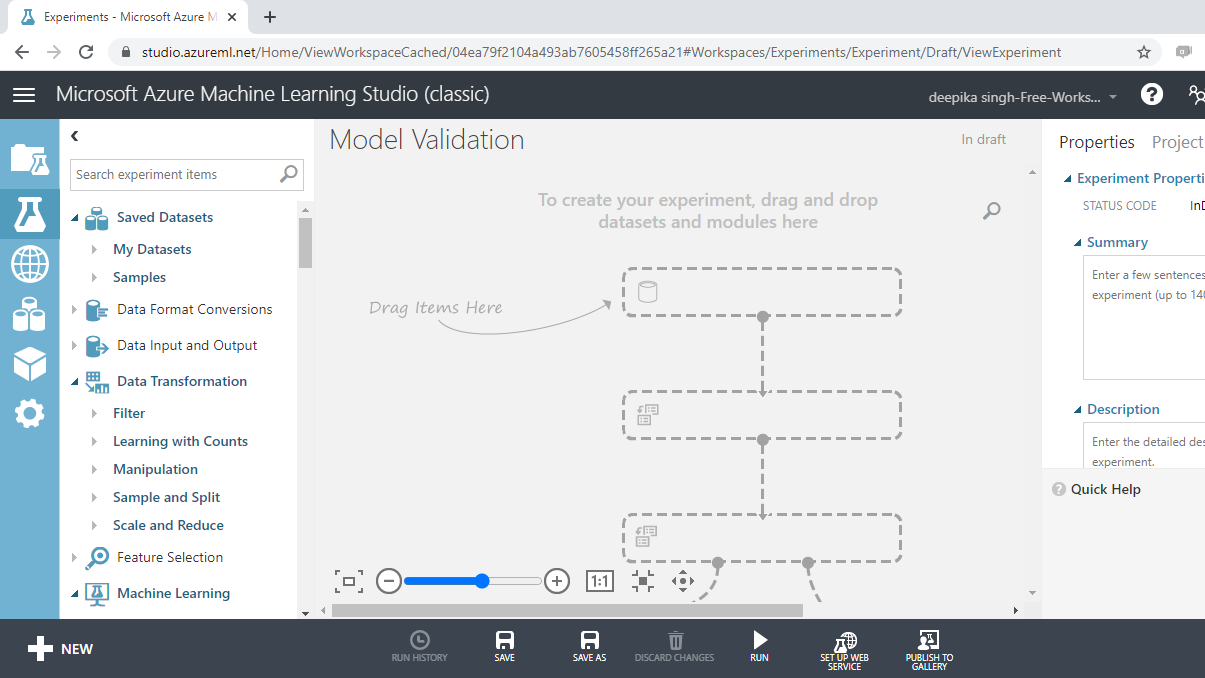
The first step is to load the data. Once you have logged into your Azure Machine Learning Studio account, click on the EXPERIMENTS option, listed on the left sidebar, followed by the NEW button. Next, click on the blank experiment and give the name Model Validation to the workspace. The following screen will be displayed.
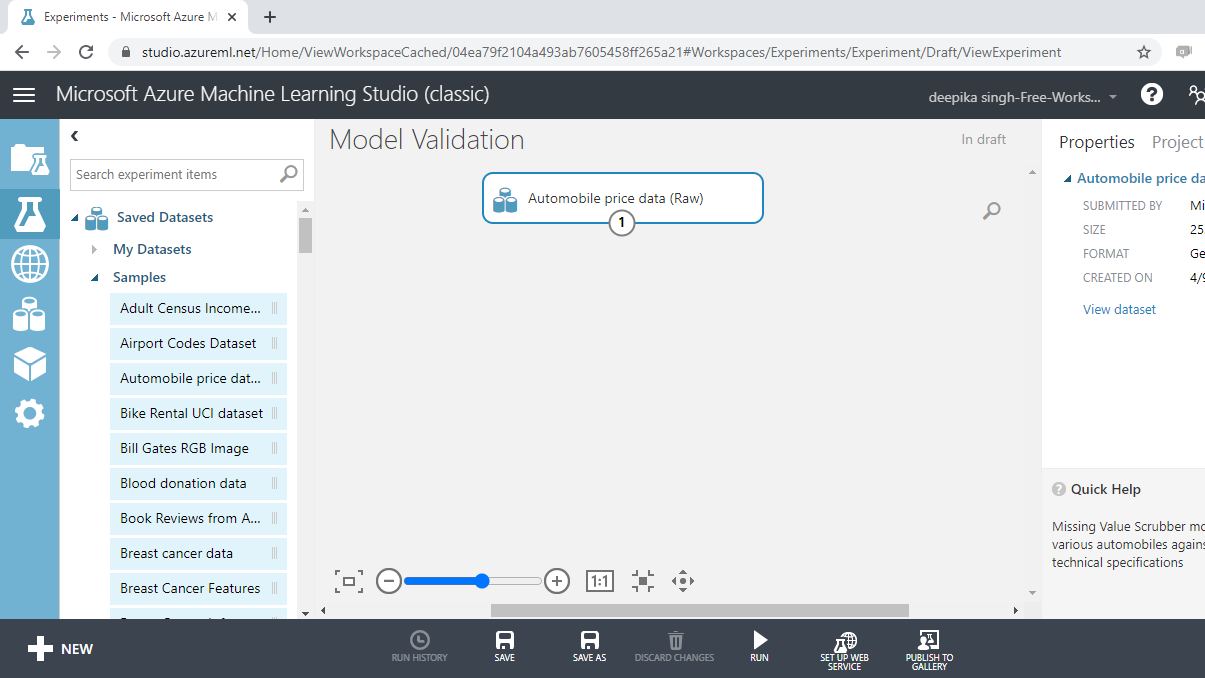
Click on the Saved Datasets option from the workspace. This will open the list of datasets available in ML Studio. Next, drag Automobile price data (Raw) from the Saved Datasets list into the workspace.
Exploring the Data
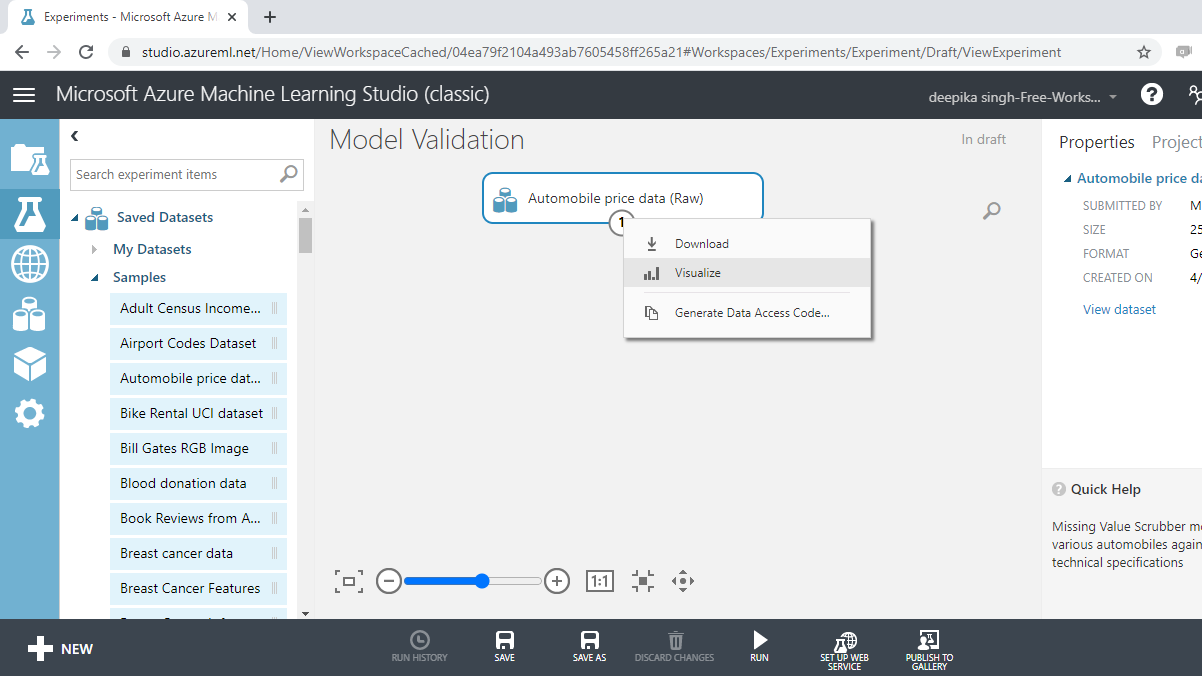
The data exploration stage helps to understand the data distribution and prepare data cleaning and feature engineering strategies. To explore the data, right-click and select the Visualize option as shown below.
Select the different variables to examine their basic statistics. For example, the image below displays the details for the variable normalized-losses.
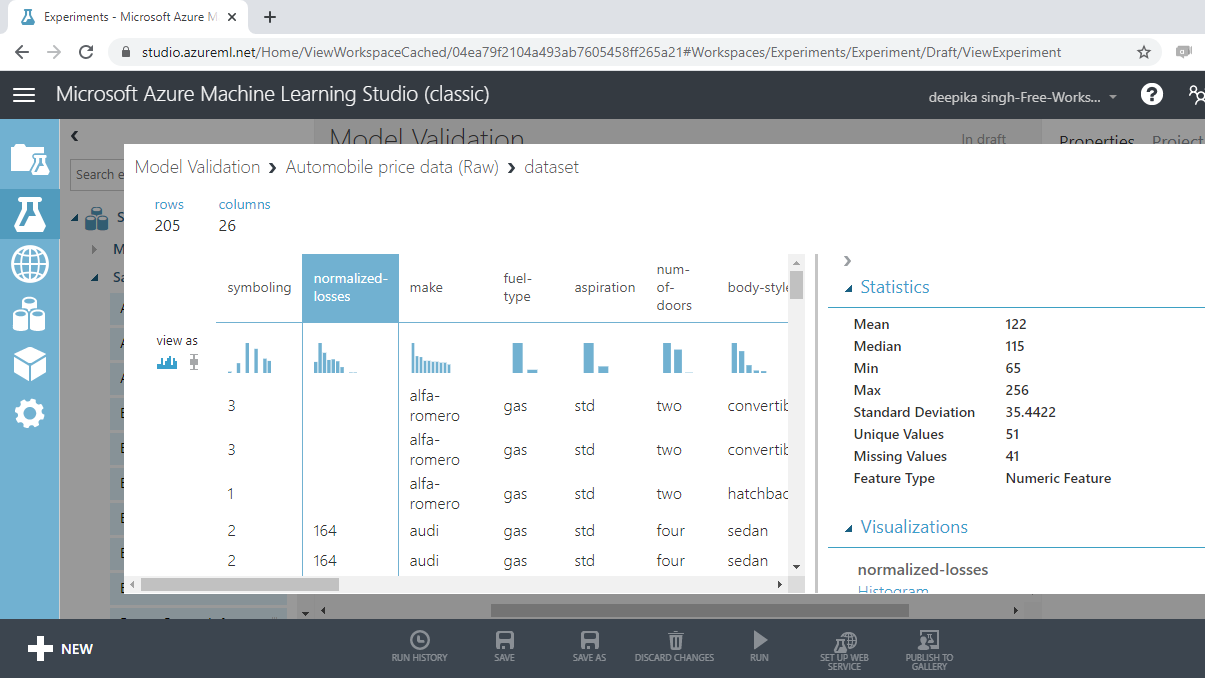
The Statistics section on the right-hand side displays summary statistic values for the variable. You can see there are 41 missing records for this variable. You will treat the missing values in the data preparation stage.
Data Preparation
To treat missing values in the data, use the Clean Missing Data module. Search and drag this module into the workspace.
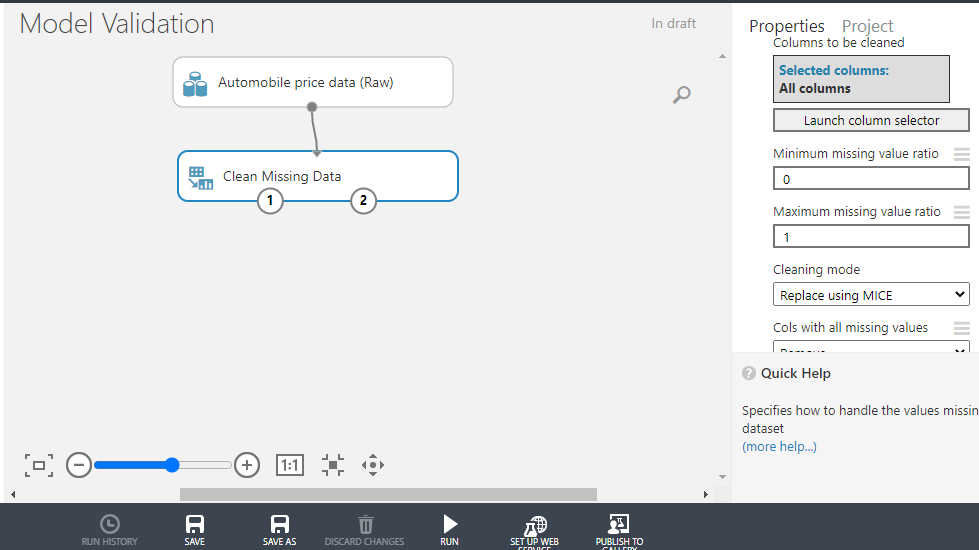
On the righthand side of the workspace, there are different options for performing the Clean Missing Data operation. There are several methods of dealing with missing values. One of the advanced techniques is the MICE technique. MICE stands for multivariate imputation by chained equations and it works by creating multiple imputations (replacement values) for multivariate missing data. Under the Cleaning mode tab, select the Replace using MICE option as shown below. Keep all the other options as default.
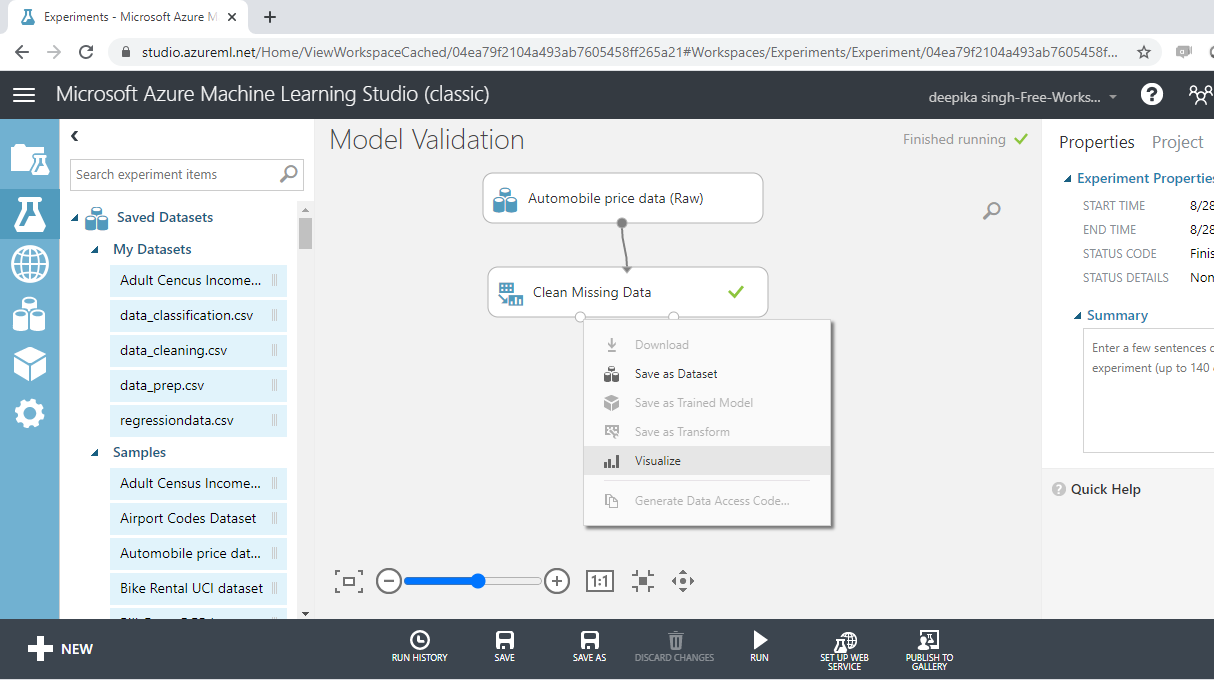
Next, run the experiment and Visualize to check if the missing data operation is performed or not.
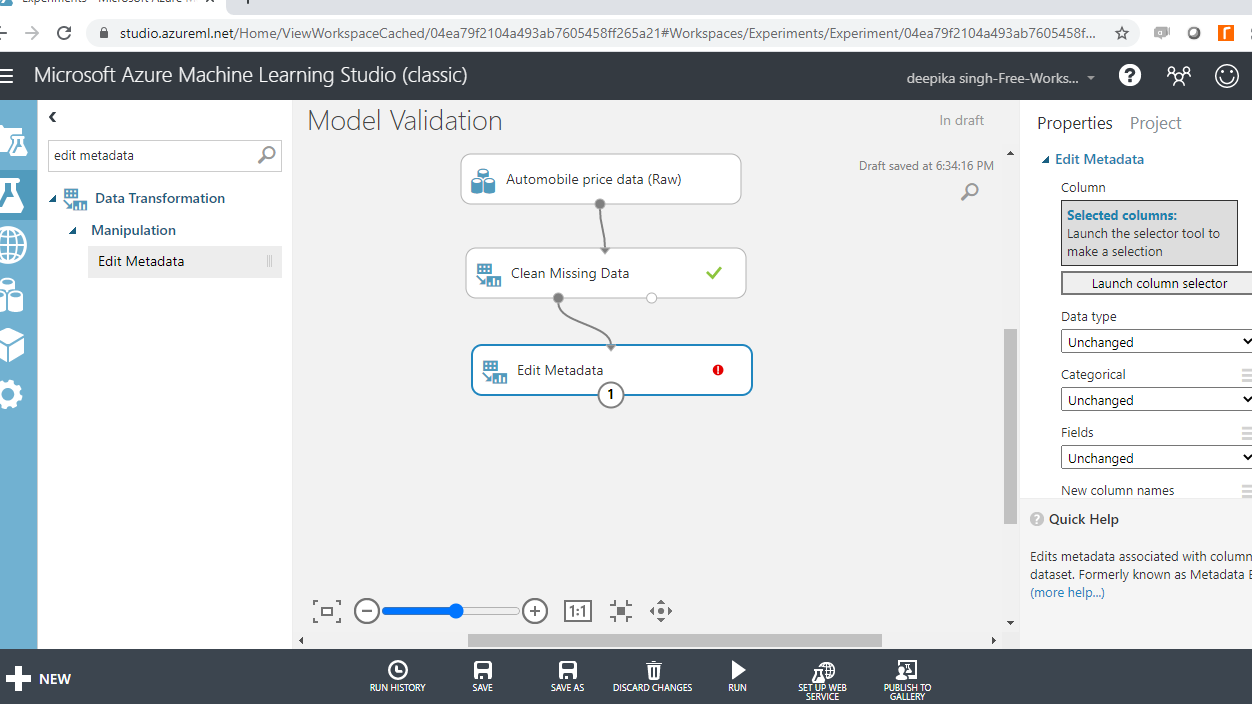
The next step is to convert the variables in the data to their correct data types. This is important because machine learning algorithms perform best when the features are the right data types.
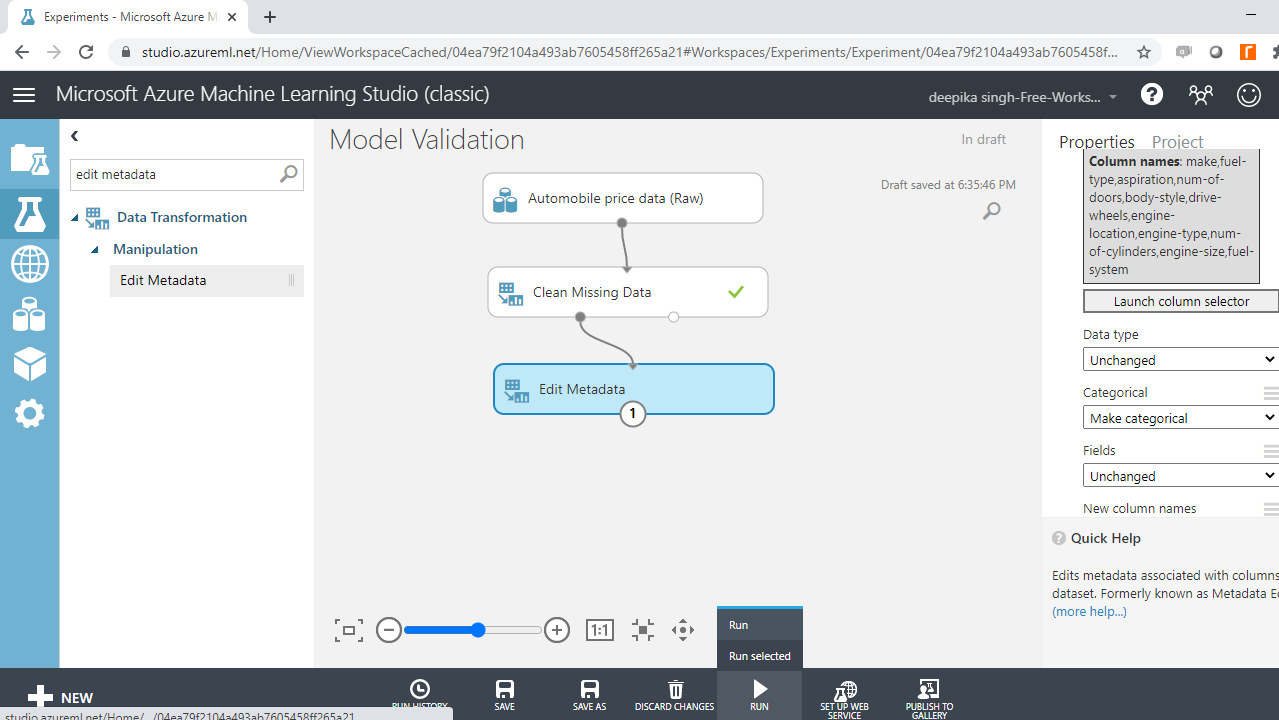
Start by typing edit metadata in the search bar to find the Edit Metadata module, and then drag it into the workspace.
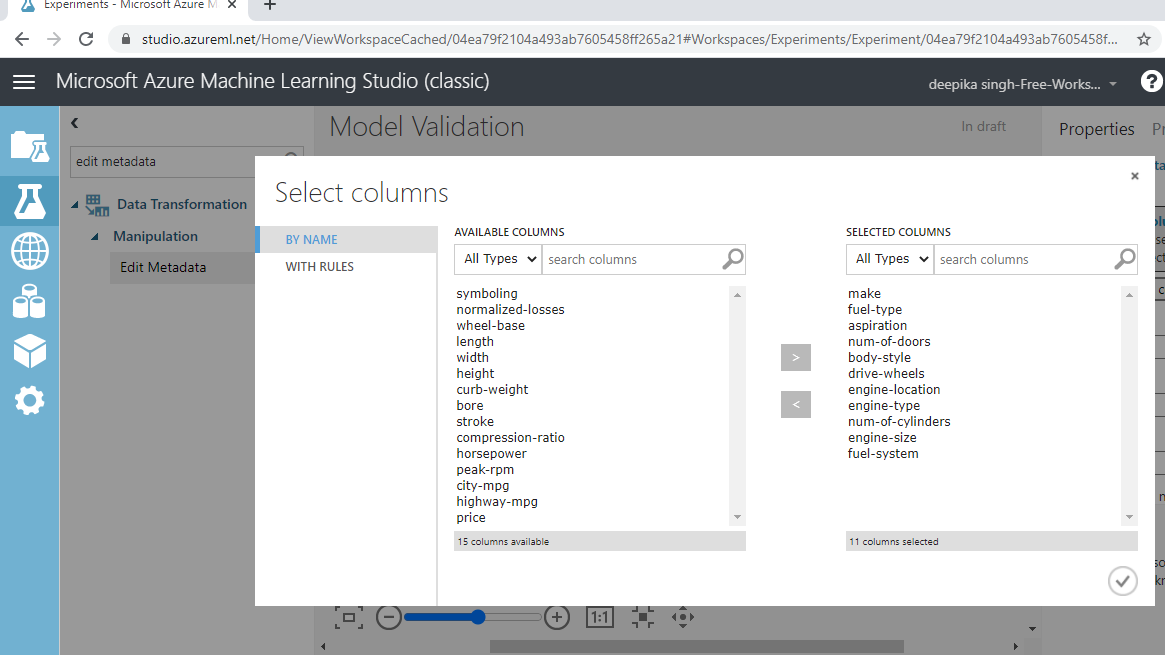
The next step is to click on the Launch column selector option in the right-hand side of the workspace and select the string variables from the available columns. This will generate the output below.
Once you have made selections, the selected columns will be displayed in the workspace. Next, from the dropdown options under Categorical, select the Make categorical option. Next, click the Run tab, and select the Run selected option.
Model Validation Approaches
Building machine learning models is an important element of predictive modeling. However, without proper model validation, the confidence that the trained model will generalize well on the unseen data can never be high. Model validation helps in ensuring that the model performs well on new data, and helps in selecting the best model, the parameters, and the accuracy metrics.
The two most widely used and popular model validation techniques are mentioned below:
-
Holdout Validation
-
K-fold Cross-Validation
These are explained and implemented in Azure Machine Learning Studio in the following sections of the guide.
Holdout Validation Approach
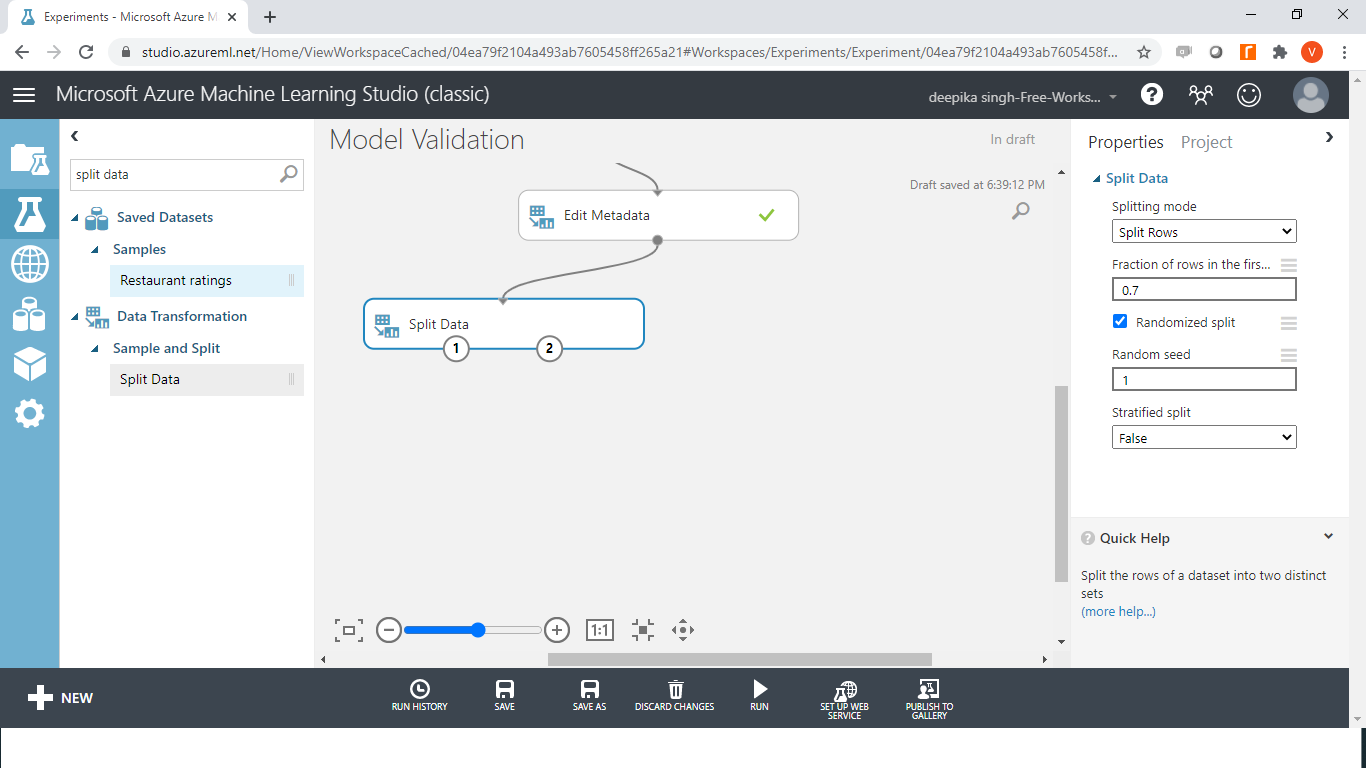
The holdout validation approach refers to creating a training set and the holdout set, also referred to as the test or validation set. The training data is used to train the model, while the unseen test data is used to validate the model performance. The common split ratio is 70:30, which means 70% of the data is used for building the model, while the remaining 30% is used for testing the model performance. In case of small datasets, the split ratio can be 90% for training and 10% for test datasets.
In Azure Machine Learning Studio, the data is divided into train and test datasets with the Split Data module. Search and drag the module into the workspace. In the Split Data options displayed in the right-hand side of the workspace, change the value under the tab Fraction of rows in the first to 0.7. Next, click the Run tab to run the experiment.
Once the data split is done, the next step is to train the algorithm.
Regression Algorithm
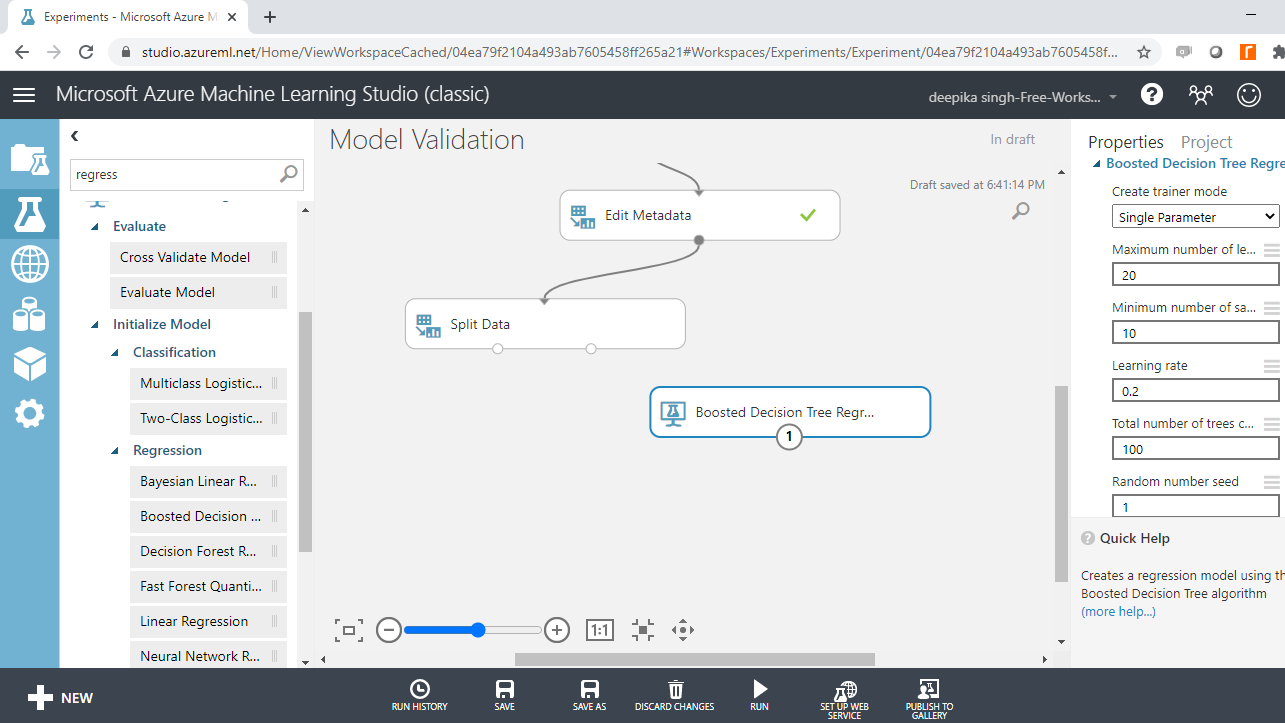
The first step for model training is selecting the machine learning algorithm. Use the boosted decision tree regression algorithm. Search and drag the module into the workspace and specify the model parameters. The algorithm and parameter specification are discussed below.
Boosted Decision Tree Regression
This algorithm is used to build boosted regression tree. The term boosted means that each tree is independent of the previous tree. This algorithm is based on the ensemble learning model, in which every tree builds upon the previous tree by correcting its error. For the data used in this guide, every single tree will make predictions on the target class of the dependent variable, price. The final predictions are based on the entire ensemble, or averaging of the price predictions, made by all the trees taken together.
To configure the module, start by setting Create trainer mode to Single Parameter. This option is selected when you know how you want to configure the model. The second argument, Maximum number of leaves per tree, is set to 20. This indicates the maximum number of terminal nodes that can be created in the tree. The third argument, ** Minimum number of samples per leaf node**, is set to 10. This indicates the minimum number of cases required to create any terminal node in this tree. Build 100 trees specified by the argument Total number of trees constructed. These are the major arguments, and you can keep the rest at default.
Train the Model
Having selected the algorithm and specified the parameters, you are ready to train the model. Start by dragging the Train Model module into the workspace as shown below. The module has two input ports. The left input port of the Train model module connects to the algorithm module, while the right input port connects with the left output port of the Split Data module. This is shown below.
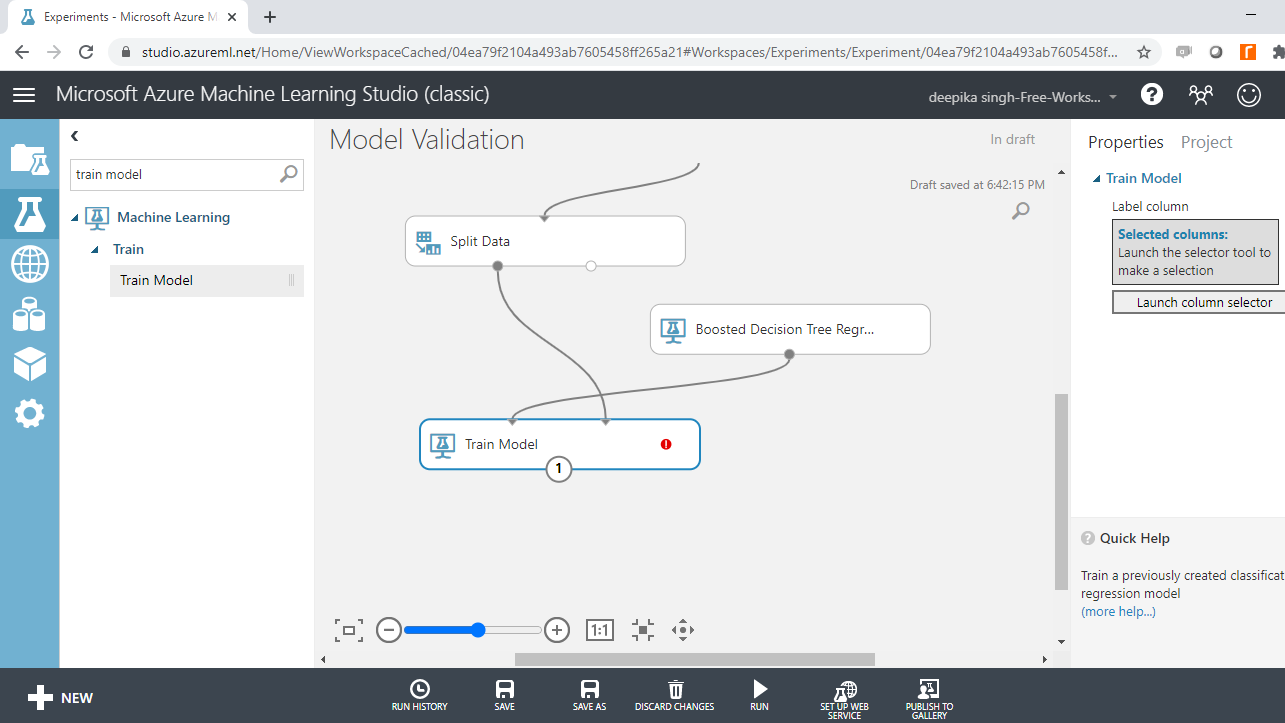
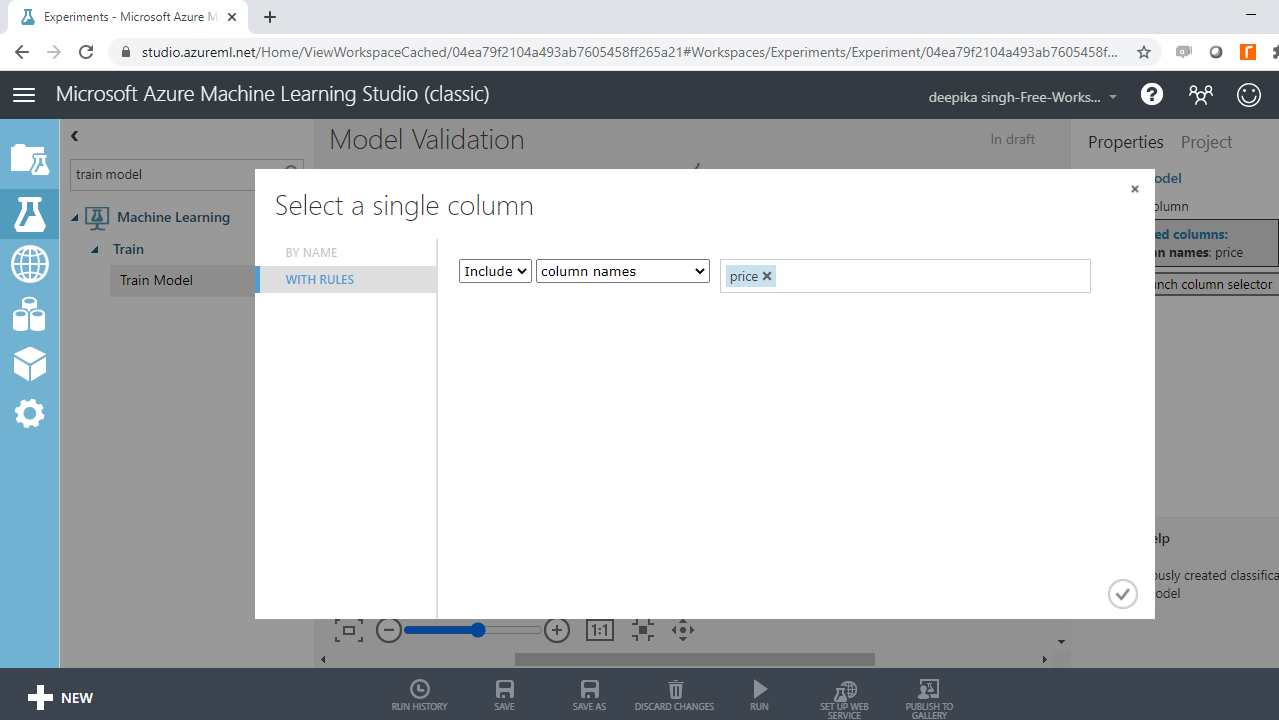
In the output above, you can see that there is a red circle inside the Train Model module that indicates that the setup is not complete. This is because the target variable is not yet specified. To do this, click Launch column selector and place the target variable price into the selected columns box, as shown below.
Score Test Data
The model has been configured and the next step is to score the test data. This step is important because the model performance will be evaluated on the scored predictions in the test data. To do this, perform the following steps.
-
Drag the Score Model module into the workspace.
-
Connect the output port of the Train Model with the left input port of the Score Model module.
-
Connect the right output port of the Split Data module to the right input port of the Score Model module. Note that this connects the test data in the Split Data module with the scoring function.
Evaluate the Model
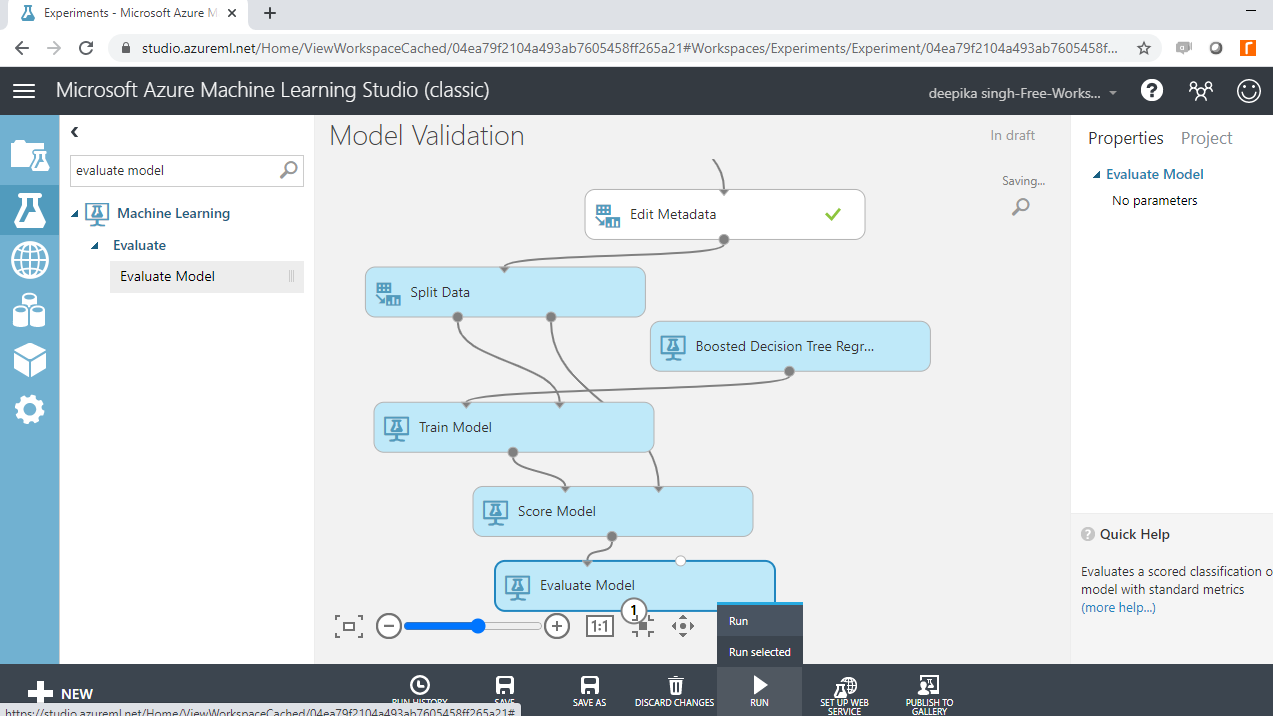
You have built the predictive model and generated predictions on the test data. The next step is to evaluate the performance of your predictive model. This step decides how good or bad your algorithm is. Drag the Evaluate Model module into the workspace and connect it with the Score Model module. Next, click the Run tab and select Run selected. This is shown below.
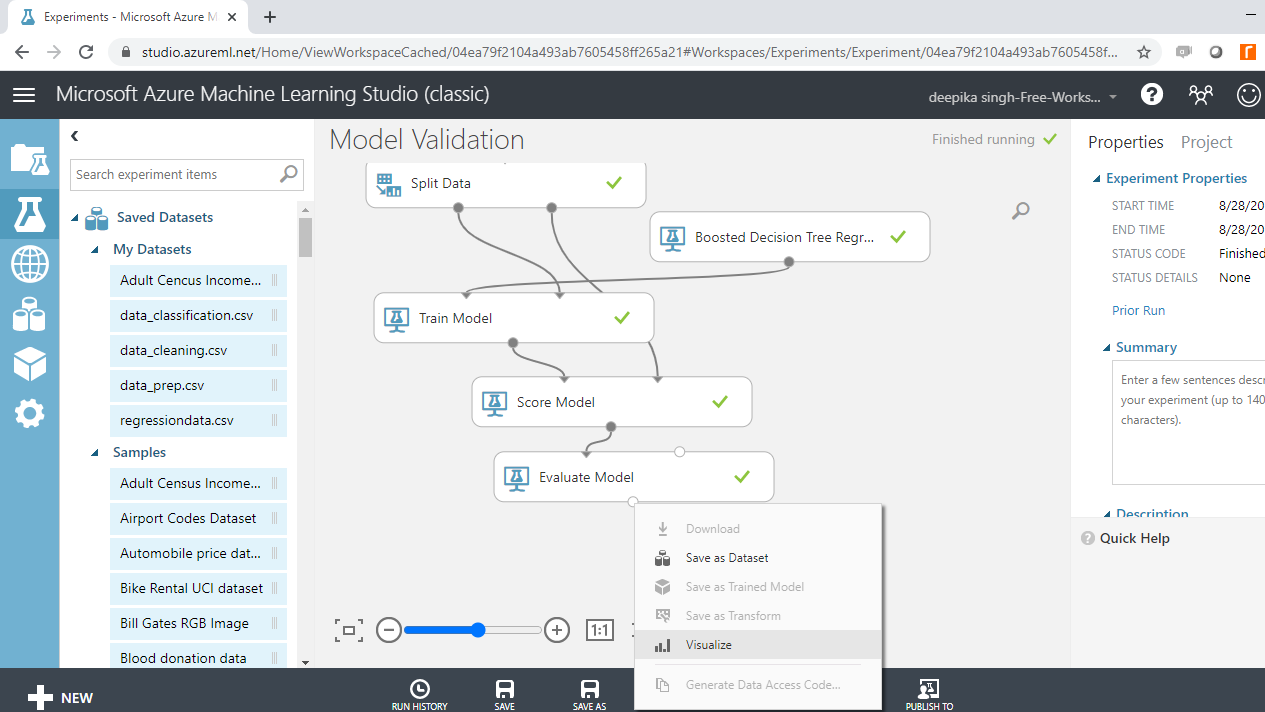
Next, right-click the output port of the Evaluate Model module and click the Visualize option.
The result window will open, and you can look at the evaluation metrics for the regression model.
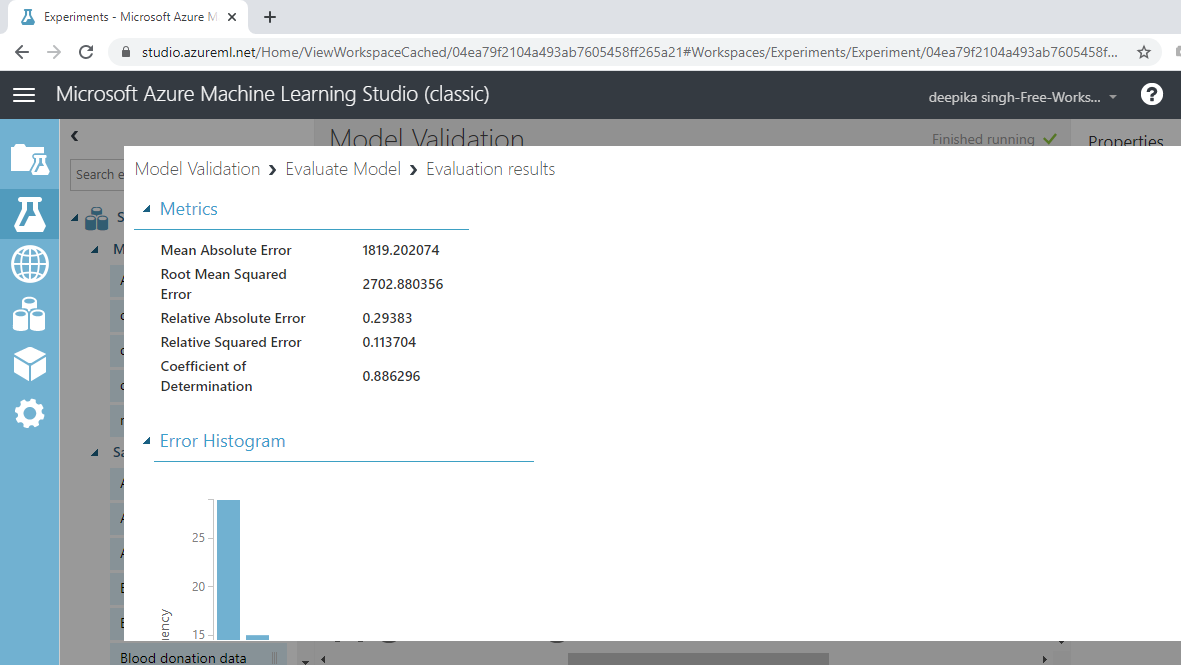
The output above shows that the coefficient of determination, or the R-squared value, is 88%, which is good model performance.
Cross-Validation
Model validation plays an integral part in building powerful and robust machine learning models. Model validation helps ensure that the model performs well on new data and helps select the best model, the parameters, and the accuracy metrics. One popular cross-validation technique is k-fold cross-validation.
In k-fold cross-validation, the data is divided into k folds. The model is trained on k-1 folds with one fold held back for testing. For example, if k is set to ten, then the data will be divided into ten equal parts. After that, the model will be built on the first nine parts, while the evaluation will be done on the tenth part or fold. This process gets repeated to ensure each fold of the dataset gets the chance to be the held-back set. Once the process is complete, summarize the evaluation metric using the mean or/and the standard deviation.
The Cross Validate Model module performs this task in Azure Machine Learning Studio. Search and drag the Cross Validate Model module into the workspace as shown below.
To set up the Cross Validate Model module, connect the Boosted Decision Tree Regression module to the left input port of the Cross Validate Model module. The output port of Edit Metadata module is connected to the right input port of the Cross Validate Model module. This setup is shown below.
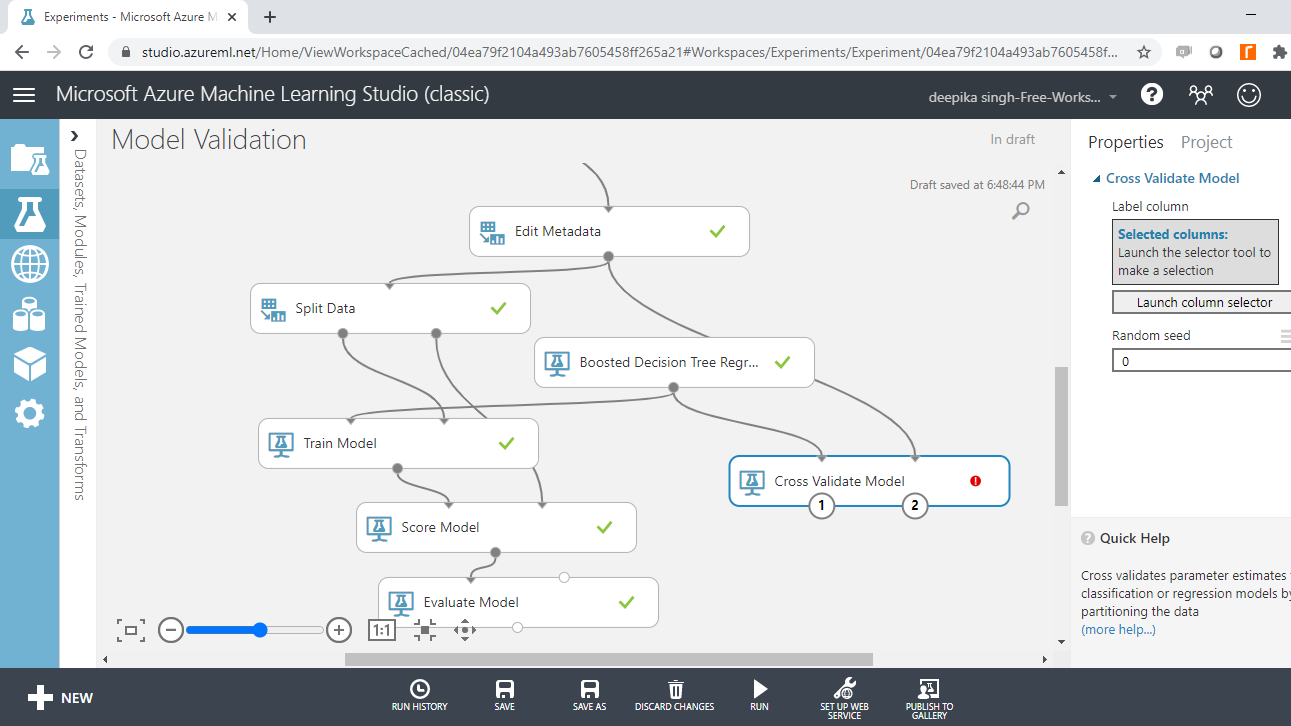
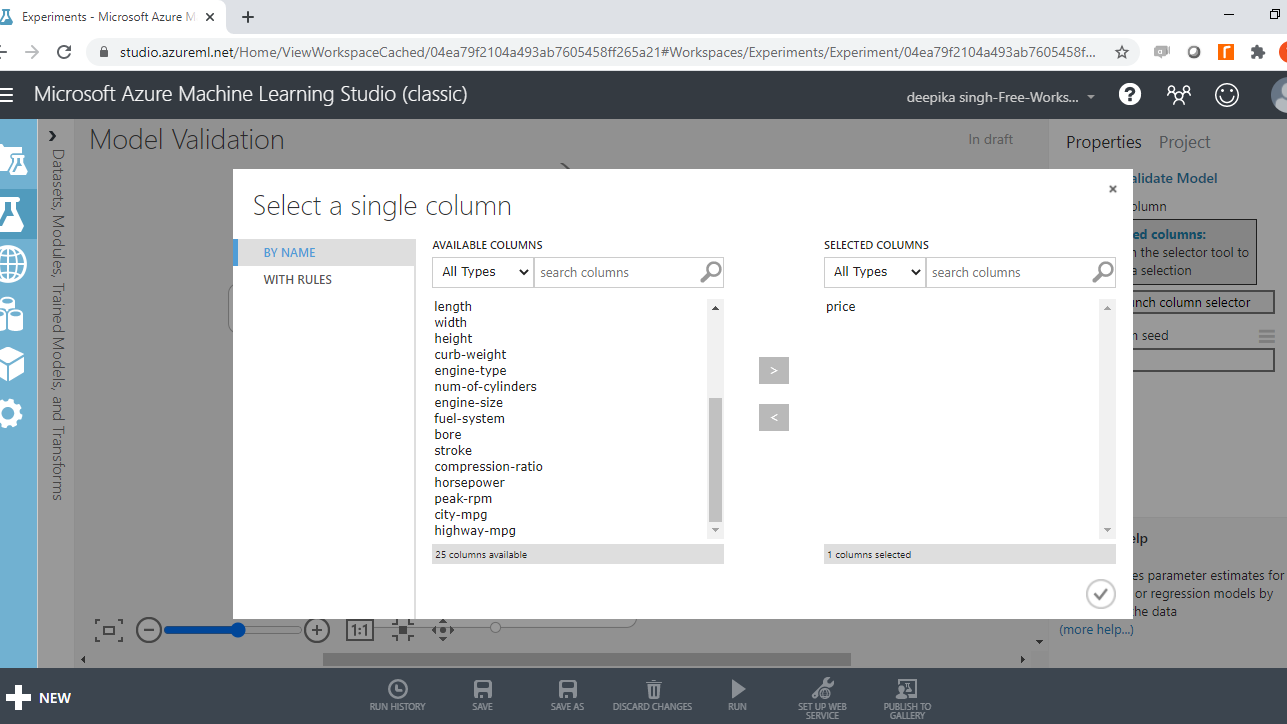
In the output above, you can see that there is a red circle inside the Cross Validate Model module that indicates that the setup is not complete. This is because the target variable is not yet specified. To do this, click on Launch column selector, and place the target variable price into the selected columns box, as shown below.
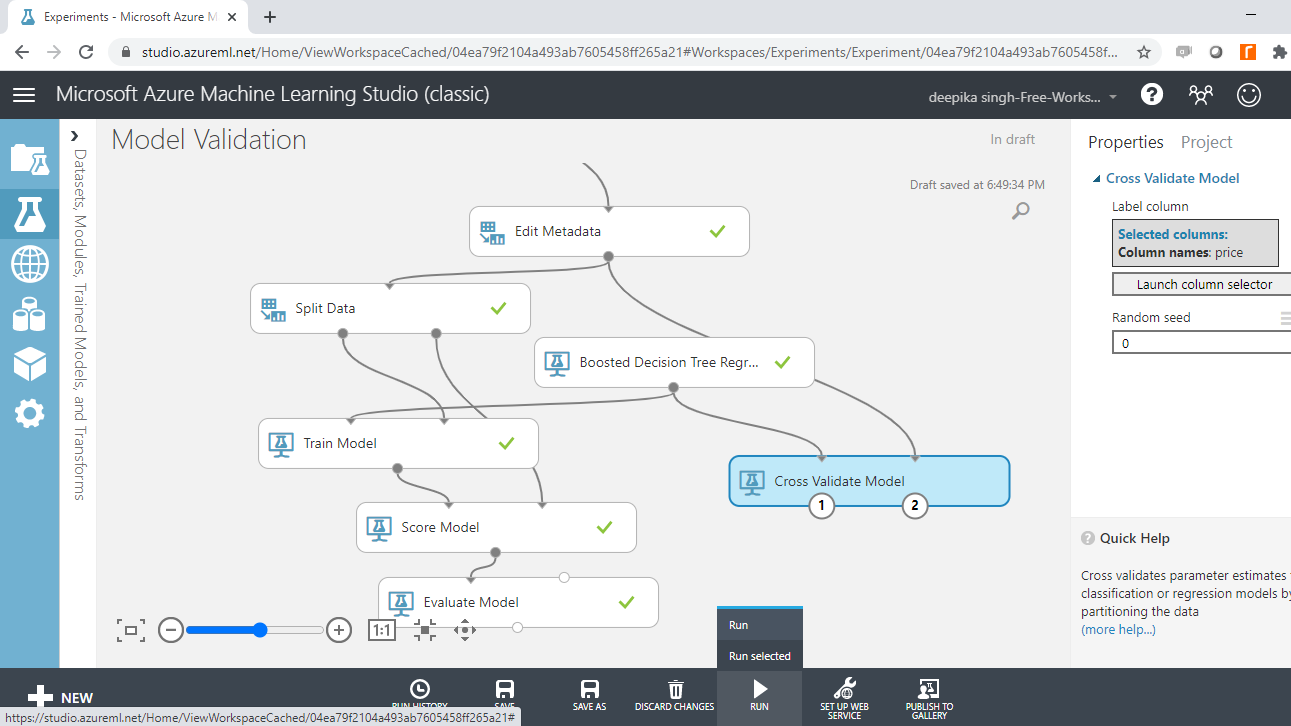
Next, click the Run tab, and select the Run selected option.
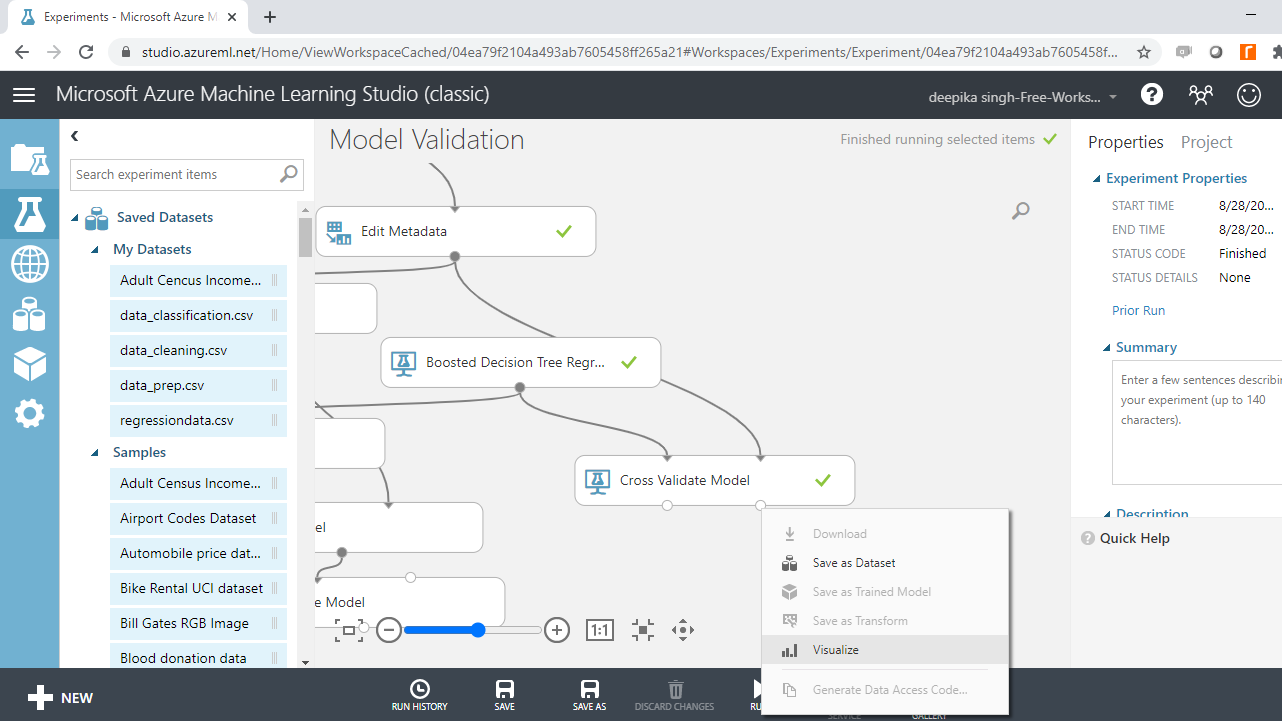
Once the experiment is run, right-click on the output port of the Cross Validate Model module, and click on the Visualize option.
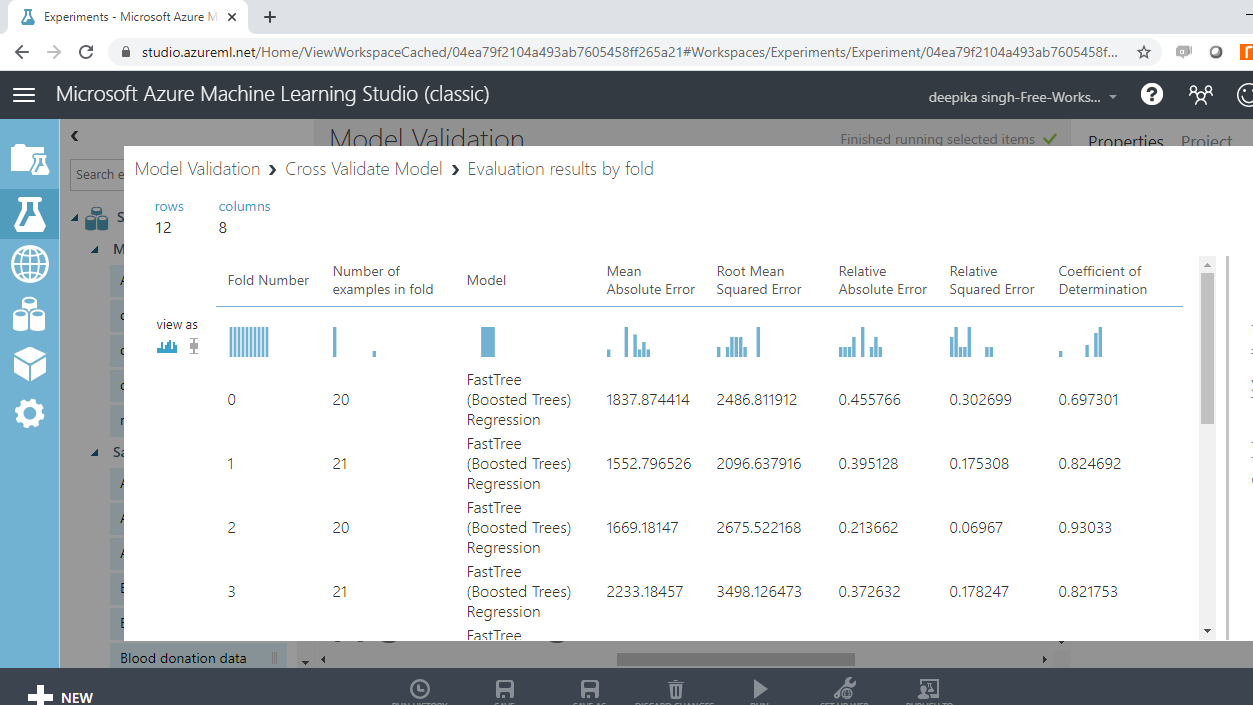
This will open the result window, and the following output will be displayed to show the evaluation results by folds. There are ten folds, zero through nine, and for every fold, you have results across several metrics, such as mean absolute error, root mean square error, coefficient of determination, and so on.
If you scroll down, you will see the mean results across the ten folds.
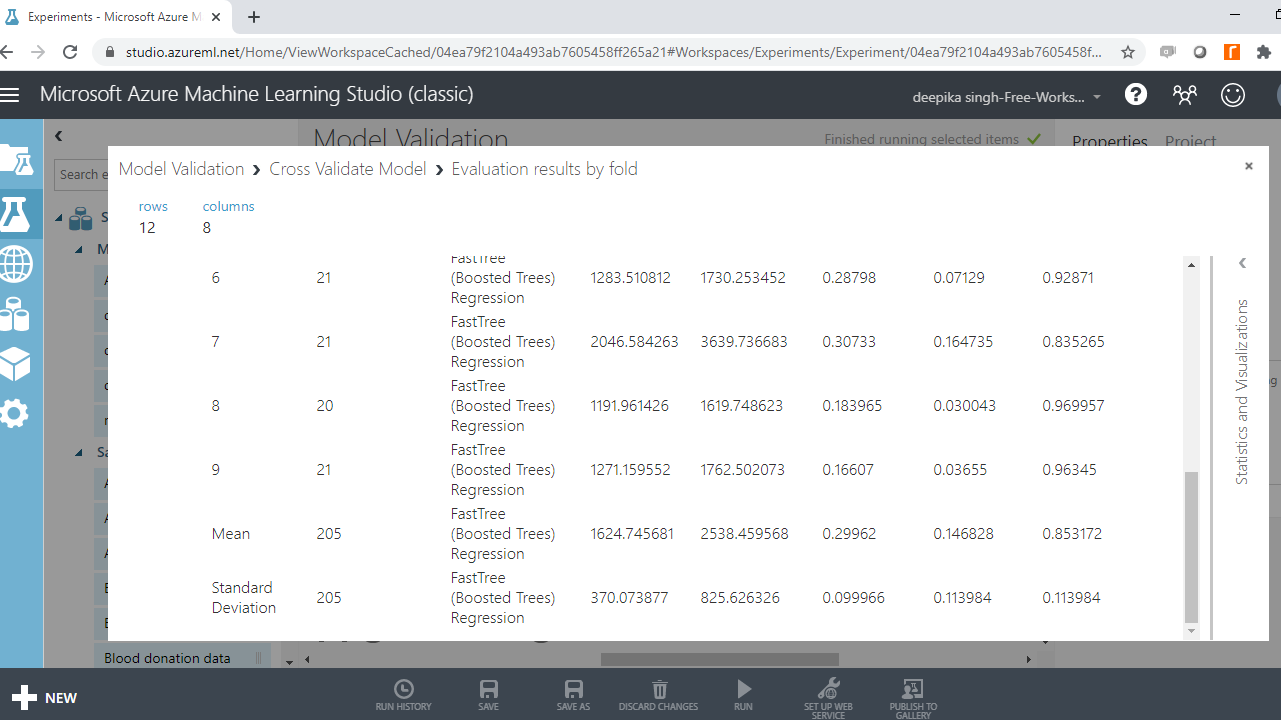
The output above shows that the coefficient of determination, or the R-squared value, is 85%, which is also good model performance.
Comparison of Model Validation
Both the model validation approaches performed well, but the holdout validation approach performed better than the k-fold cross-validation method across the evaluation metrics of coefficient of determination.
Conclusion
In this guide, you learned how to perform model validation in Azure ML Studio. You learned two widely used model validation techniques, and also learned how to train, evaluate, and compare these two model validation techniques in Azure Machine Learning Studio.
To learn more about data science and machine learning using Azure Machine Learning Studio, please refer to the following guides: