
- Course
Visualizing Data in ggplot 2: R Data Playbook
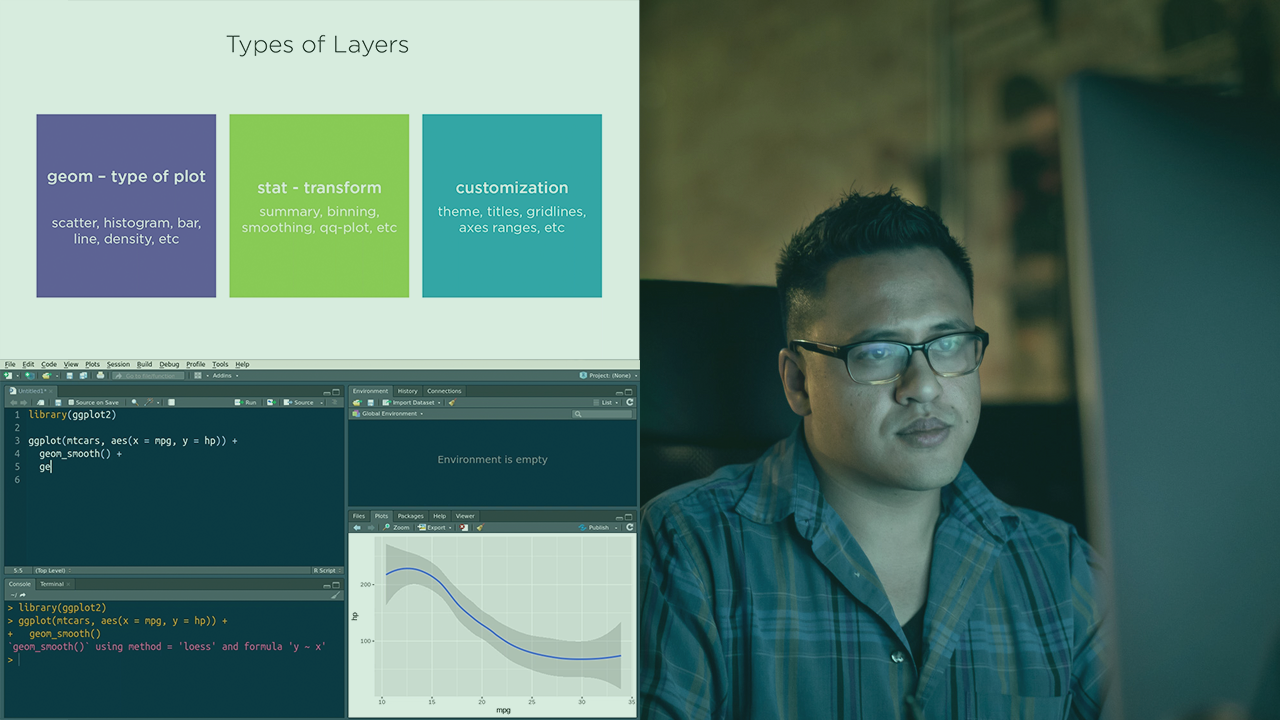
Making plots in R can be difficult, but it doesn't have to be. R's ggplot2 package makes it easy to make beautiful, high quality plots with only a couple lines of code. This course will get you well on your way to visualization proficiency.
Beginner
- Course
Visualizing Data in ggplot 2: R Data Playbook
Making plots in R can be difficult, but it doesn't have to be. R's ggplot2 package makes it easy to make beautiful, high quality plots with only a couple lines of code. This course will get you well on your way to visualization proficiency.
Beginner
Get started today
Access this course and other top-rated tech content with one of our business plans.
Try this course for free
Access this course and other top-rated tech content with one of our individual plans.
This course is included in the libraries shown below:
- Data
What you'll learn
Making high quality plots that display exactly what you want can be difficult. In this course, Visualizing Data in ggplot 2: R Data Playbook, you will gain the ability to build quality plots and customize them to fit your needs. First, you will learn the foundations of the ggplot syntax. Next, you will discover how to add multiple variables and select the plot type. Finally, you will explore how to customize and make the plot fit with the style you are looking for. When you are finished with this course, you will have the skills and knowledge of data visualization with R and ggplot needed to build presentation worthy plots for work or school.
Visualizing Data in ggplot 2: R Data Playbook
Beginner
Chase is currently Lead Data Scientist at Tesorio and formerly was an Assistant Professor of Finance and Economics at the University of South Carolina Upstate.
