Building One- and Two-variable Data Tables in Microsoft Excel
Jul 15, 2020 • 7 Minute Read
Introduction
Data tables in Microsoft Excel allow experimenting with different input values and observing how they affect results in a simulation without recreating calculations. They can be used not only in personal applications (such as calculating monthly payments based on changing interest rates and different loan amounts), but also in any scenario that involves a what-if or sensitivity analysis. Said another way, single- and multi-variable data tables are useful tools to examine how one or more sets of alternatives impact a given scenario.
In this guide, we will explain how to create single- and two-variable data tables using data from a list of resolved tickets by a help desk in a given week. You can download the spreadsheet used in the examples below here. For simplicity, we will assume that all support persons have the same degree of experience and pay rate and that all reported incidents pose the same level of difficulty.
Single-variable Data Tables
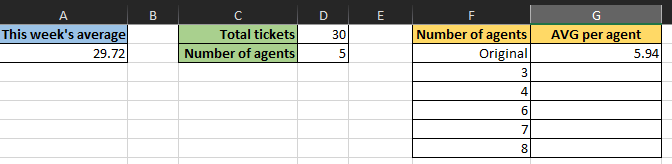
In this case, we will illustrate how to examine the variation of the incident resolution time in hours based on the number of assigned agents. During the week under consideration, five employees solved 30 incidents with a team average of 29.72 hours as calculated using the data on the tickets list. This calculation yields a mean of 5.94 hours per agent when you divide A2 by D2:
To see how a change in the number of agents would have impacted the individual average, create a data table as follows:
- Select cells F2 to G7:
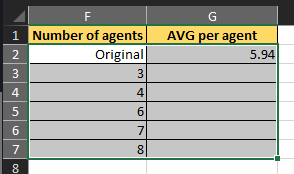
In the image above, F2 through F7 contains the set of alternatives, and G2 is where you will insert the main formula (A2/D2).
-
Go to the Data menu and Forecast section to find the What-If Analysis sub-menu. In versions of Microsoft Excel older than 2016, What-If Analysis was inside of the Data Tools section, also under the Data menu.
-
From What-If Analysis, choose Data Table.
-
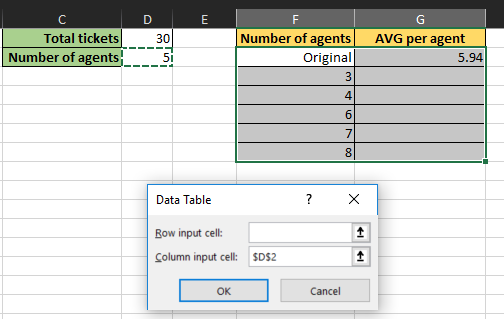
Since the analysis variable (number of agents) is across column F, place the cursor on the Column input cell box. Next, select the cell where the initial value is (D2):
- Click OK and note how Microsoft Excel populates the AVG per agent column accordingly. The image below illustrates how the average time per agent changes if you employ a different number of individuals.
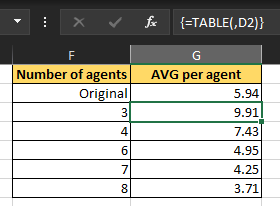
Note: If you select one of the cells between F3 and F7, you will see that its value comes from a data table instead of a fixed formula.
So what is the difference between using a data table and copying the formula across column G? The answer is simple. With a data table, you can make a change in one place and Microsoft Excel will recalculate the entire simulation. This approach also spares you from having to deal with absolute references to cells, something that you would have to handle on your own if you were to copy a formula to neighboring cells.
Although the concepts we have discussed so far are valuable, a sensitivity analysis will often require the study of two related variables. You will learn how to create a two-dimension data table in the following section.
Two-variable Data Tables
In the previous case, the average time per agent will decrease as the number of employees goes up. However, it is worth looking at this scenario from different angles by asking yourself the following questions:
-
Do you need to hire more agents to improve the average resolution time? If so, how many can you afford?
-
How do you maintain the team's average resolution time if the number of incidents changes?
In the following example, you will analyze the second scenario using a two-variable data table starting with these facts:
-
The team's average was 29.72 hours.
-
For 30 incidents and five employees, this means an average of 0.1981 hours—roughly 12 minutes—per ticket per agent.
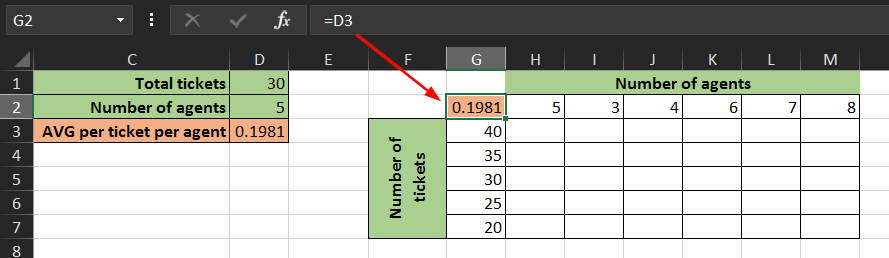
Enter a set of values for tickets in a column and another for agents in a row, as follows. The order is arbitrary, but I chose five agents and 40 incidents to start since that is the first example we will examine later. Note how cell G2 contains a reference to the calculation of average time per ticket per agent.
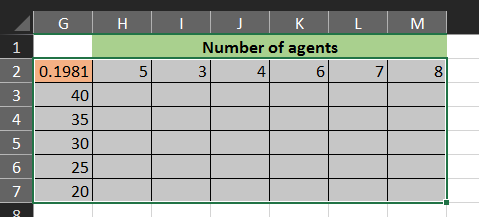
Next, select cells G2 through M7:
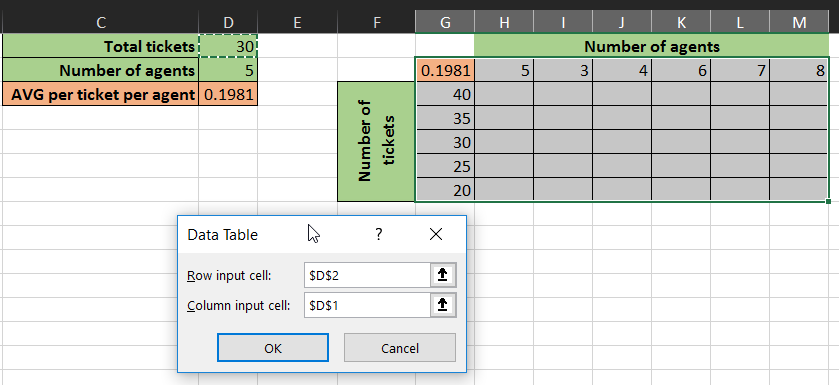
Create a data table in the same fashion as before, only this time you will need to choose both row (D2) and column (D1) input cells since that is where your initial values are:
When you click OK, Microsoft Excel will populate the data table with a series of values:
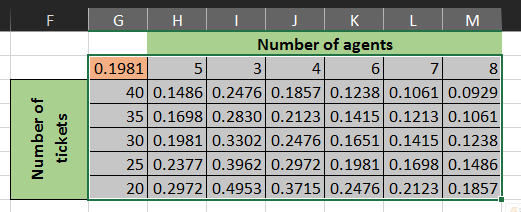
Using this data set, you can draw the following conclusions if you want to maintain the team's average of 29.72 hours:
-
If you keep a staff of five individuals and the number of tickets increases to 40, employees will need to solve each incident in 0.1486 hours (roughly nine minutes) or less.
-
If the number of employees decreases to three and the amount of tickets increases to 35, agents will have up to 0.2830 hours (17 minutes) to close each case.
-
If you allocate more resources for your help desk (let's say eight employees) and the number of tickets remains constant at 30, agents should be able to close each incident in 0.1238 hours (seven and a half minutes) or less.
These observations—among others—will aid you in determining whether you need to level up your agents' skills to improve their productivity or if you need to hire more people.
Summary
In this guide, you have learned how to create one- and two-variable data tables and how to use them to speed up calculations for decision making. Although copying and pasting formulas across a range of cells can be handy sometimes, utilizing data tables is a more robust solution. This Microsoft Excel feature can allow you to visualize with little effort how a change in one or two variables impacts a complex simulation.
Advance your tech skills today
Access courses on AI, cloud, data, security, and more—all led by industry experts.
