Create Tooltips in D3.js
This guide offers two approaches to adding tooltips, which gradually reveal information as users hover or put keyboard focus on an element, in D3.js charts.
Sep 29, 2020 • 7 Minute Read
Introduction
Tooltips are a feature designers can use when they want to gradually reveal information to users as they hover or place keyboard focus over an element. In this guide, you will learn two approaches to enhancing your D3.js charts by implementing tooltips.
This guide builds on a previous guide, Using D3.js Inside a React App, that covers how to set up a simple bar chart in D3.js using static in-memory data. Here you will extend that bar chart with tooltips.
Two Approaches To Tooltips
There are two possible methods of creating tooltips in D3.js. The first method is by creating the SVG <title> tags as a descendant of an interactable element. The second approach is to use mouseover, mosueleave, and mousemove events to dynamically move and change the visibility of a tooltip. The first approach is simple to implement but can lead to unnecessarily creating more elements that can hurt performance. Both approaches will be demonstrated.
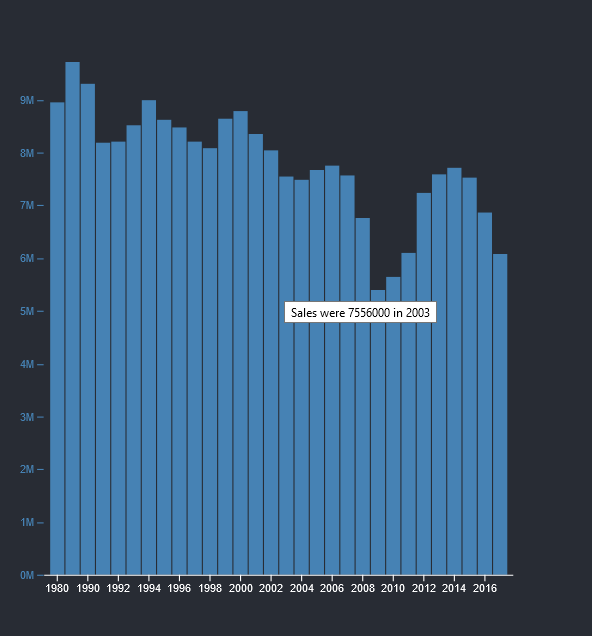
Adding Tooltips Using the Title SVG Element
In Using D3.js Inside a React App, the <BarChart /> component creates the <rect> element per sales year. To add a simple tooltip, you can insert the <title /> tag inside the interactable elements. This means that the SVG hierarchy looks like this:
      <svg>
  <g class="plot-area">
  <rect class="bar" x="46" width="13" y="37" height="433">
    <title>Sales were 8949000 in 1980</title>
  </rect>
  <rect class="bar" x="60" width="13" y="-61" height="531">
    <title>Sales were 10979000 in 1985</title>
  </rect>
  </g>
  ...
</svg>
The SVG element has been simplified for brevity.
To do this with D3.js, you only need a minor update to the code that joins the data to the <rect /> elements.
      svg
  .select(".plot-area")
  .attr("fill", "steelblue")
  .selectAll(".bar")
  .data(data)
  .join("rect")
  .attr("class", "bar")
  .attr("x", (d) => x(d.year))
  .attr("width", x.bandwidth())
  .attr("y", (d) => y1(d.sales))
  .attr("height", (d) => y1(0) - y1(d.sales))
  .append('title')
  .text((d) => `Sales were ${d.sales} in ${d.year}`);
Using Mouse Events to Control Tooltips
The second approach is to use mousemove, mouseleave, and mouseenter events to control the visibility, styling, and position of tooltips. This approach requires more code but gives you more control. The updated <BarChart /> component with this approach is demonstrated below:
      import { useD3 } from "./hooks/useD3";
import React from "react";
import * as d3 from "d3";

function BarChart({ data }) {
  const ref = useD3(
    (svg) => {
      const height = 500;
      const width = 500;
      const margin = { top: 20, right: 30, bottom: 30, left: 40 };

      const x = d3
        .scaleBand()
        .domain(data.map((d) => d.year))
        .rangeRound([margin.left, width - margin.right])
        .padding(0.1);

      const y1 = d3
        .scaleLinear()
        .domain([0, d3.max(data, (d) => d.sales)])
        .rangeRound([height - margin.bottom, margin.top]);

      const xAxis = (g) =>
        g.attr("transform", `translate(0,${height - margin.bottom})`).call(
          d3
            .axisBottom(x)
            .tickValues(
              d3
                .ticks(...d3.extent(x.domain()), width / 40)
                .filter((v) => x(v) !== undefined)
            )
            .tickSizeOuter(0)
        );

      const y1Axis = (g) =>
        g
          .attr("transform", `translate(${margin.left},0)`)
          .style("color", "steelblue")
          .call(d3.axisLeft(y1).ticks(null, "s"))
          .call((g) => g.select(".domain").remove())
          .call((g) =>
            g
              .append("text")
              .attr("x", -margin.left)
              .attr("y", 10)
              .attr("fill", "currentColor")
              .attr("text-anchor", "start")
              .text(data.y1)
          );

      svg.select(".x-axis").call(xAxis);
      svg.select(".y-axis").call(y1Axis);

      var tooltip = d3.select('.tooltip-area')
        .style('opacity', 0);

      const mouseover = (event, d) => {
        tooltip.style("opacity", 1);
      };

      const mouseleave = (event, d) => {
        // tooltip.style('opacity', 0);
      }

      const mousemove = (event, d) => {
        const text = d3.select('.tooltip-area__text');
        text.text(`Sales were ${d.sales} in ${d.year}`);
        const [x, y] = d3.pointer(event);

        tooltip
          .attr('transform', `translate(${x}, ${y})`);
      };

      svg
        .select(".plot-area")
        .attr("fill", "steelblue")
        .selectAll(".bar")
        .data(data)
        .join("rect")
        .attr("class", "bar")
        .attr("x", (d) => x(d.year))
        .attr("width", x.bandwidth())
        .attr("y", (d) => y1(d.sales))
        .attr("height", (d) => y1(0) - y1(d.sales))
        .on("mousemove", mousemove)
        .on("mouseleave", mouseleave)
        .on("mouseover", mouseover);
    },
    [data.length]
  );

  return (
    <>
      <svg
        ref={ref}
        style={{
          height: 500,
          width: "100%",
          marginRight: "0px",
          marginLeft: "0px",
        }}
      >
        <g className="plot-area" />
        <g className="x-axis" />
        <g className="y-axis" />
        <g className="tooltip-area">
          <text className="tooltip-area__text">aas</text>
        </g>
      </svg>
    </>
  );
}

export default BarChart;
You have performed the following necessary changes:
- Updated the jsx to include a tooltip-area group
- Created a callback function for mouseover that makes the tooltip visible
- Created a callback function for mouseleave that hides the tooltip when your mouse is no longer on the <rect /> element
- Created a callback function for mousemove that repositions and updates the tooltip text as you move between different <rect /> elements
You may also want to create extra elements to help you style the tooltip. However, this is out of scope of this guide. As a final note on this approach, the code to do this has changed between different versions of D3.js. The code snippet demonstrated above is for version 6. You can learn more about the changes in the D3 6.0 migration guide.
Conclusion
Tooltips allow you to gradually reveal extra information to users. However, they are not always the solution to your data presentation problems. You can learn more about how you should and shouldn't be using tooltips by reading these Tooltip Guidelines.
Advance your tech skills today
Access courses on AI, cloud, data, security, and more—all led by industry experts.
