Debugging Angular 2 Applications
Get a comprehensive overview in this tutorial of the various ways you can debug an Angular 2 applications using the Google Chrome Developer tools.
Jan 10, 2019 • 8 Minute Read
Introduction
Even though Angular 2 is still young, there are plenty of debugging techniques and methods you can use.
This guide gives a comprehensive overview of the various ways you can debug an Angular 2 applications. To make the most out of Angular 2 debugging, it is recommended that you use Google Chrome as most of the examples presented here rely on the Chrome Developer Tools
Enabling and disabling debugging
Angular 2 applications have development mode enabled by default. Development mode enables errors to be displayed in the console and the usage of breakpoints. When you open your console in debugging mode, you would normally see this message pop up:
Angular 2 is running in the development mode. Call enableProdMode() to enable the production mode
Before you deploy your application and put it on a live server, make sure you disable development mode. To do so, you need to import the function in the file where you're bootstrapping the application:
      //main.ts

import { enableProdMode } from '@angular/core';

enableProdMode();
bootstrap(AppComponent, [
//providers, etc
]);
Before you dive in this guide, make sure your application has production mode disabled so that you can have access to the all the methods described below.
Console
If you like being old school, there is a neat way to debug your Angular 2 application from the console. To start off, you can use the Chrome Developer Tools (Devtools for brevity) to get the refernce of an element you have selected by using $0 .

Having the reference of an DOM element, you have the ability to inspect the scope of the component it is located in. You can do this by using ng.probe() and put the DOM element as an argument:
> ng.probe($0)
As you can seeng.probe($0) you can acess the scope of the component itself and manipulate its various attributes directly from the console.**. You can go ahead and explore the component's model and change things around in its instance:
> ng.probe($0).componentInstance

However, the changes are not reflected in the UI. Why? Because you are editing the component programatically isntead of doing it directly through the DOM, Angular does not detect the change in the model.If you are coming from Angular 1, you may already know that you can apply the changes by creating $digest event that will check for changes in all the watchers in the applications.
However, in Angular 2, each component has its own scope, so you have to apply the changes to the component's scope itself.
ng.probe($0)._debugInfo._view.changeDetectorRef.detectChanges()

Debugger
Enabling source maps will let you see the TypeScript code of your application instead of the transpiled JavaScript code, making it easier for you to debug your code line by line.
To enable sourcemaps, edit tsconfig.json
tscofig.json
      {
  //...
  "compilerOptions": {
    "sourceMap": true
  }
  //...
}
Now, in your source code, whever you put the debugger statement, you'll be able to see the TypeScript code in your debugger, instead of your transpiled JavaScript:
      search(term: string) {
    this.searchSubject.next(term);
    debugger; //debug here!
}
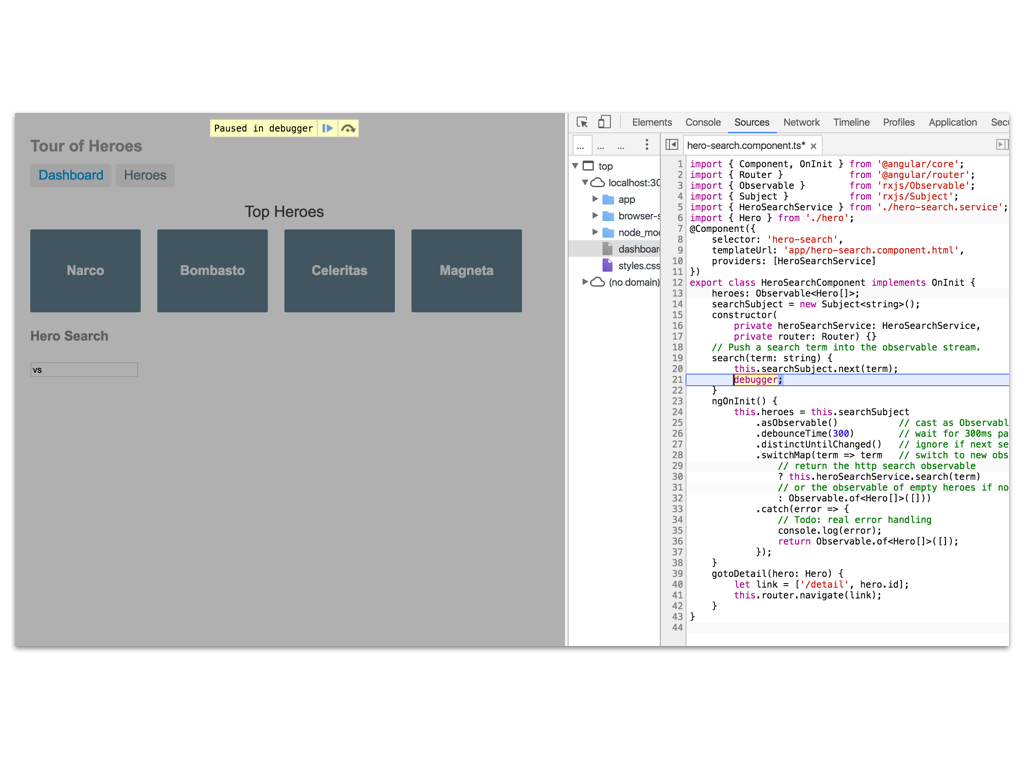
When you use it, debugger is going to pause the code in your application and let you review its state.
JSON pipe
      <p> I can see the whole model here! :</p>
{{hero | json}}
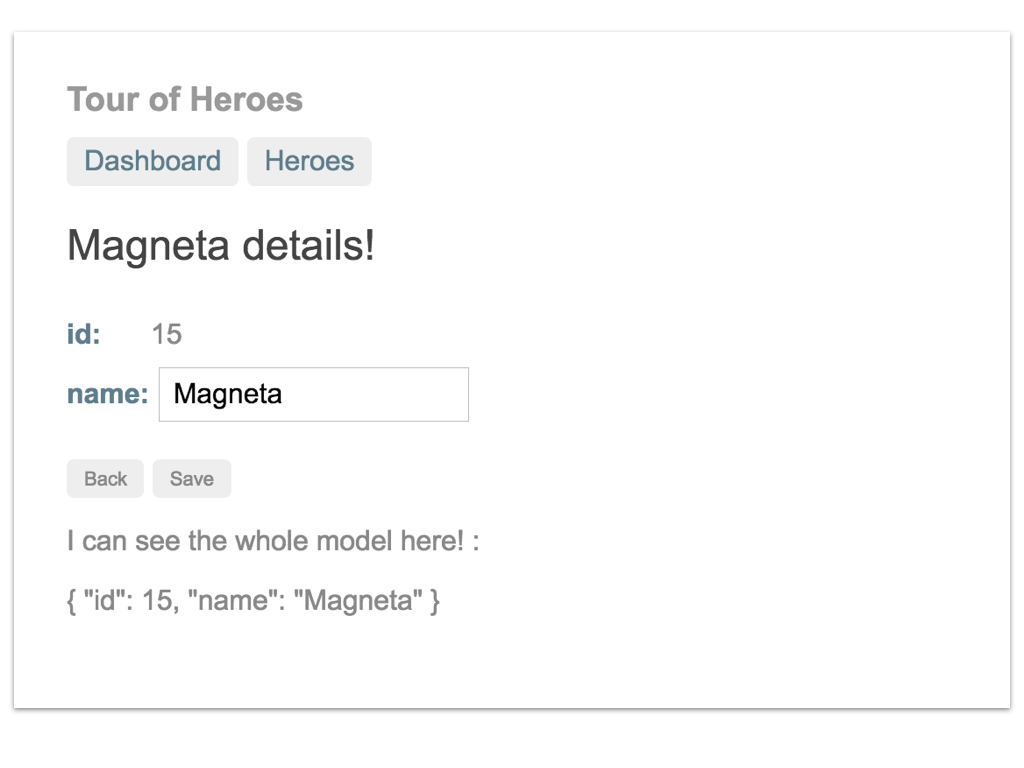
Now you are be able to see all the model's properties being changed in real time as you interact with it.
Augury

Angular Augury is a great way to make the debugging process of your application more visual. You can get it as a Chrome Extension.
With Augury you can visually traverse through the component tree and view each of the component's providers, directives and more. You can also see how the diferent providers have been injected into the components.

Logging
Loggers are a great way to structure the errors in your application and provide more detailed bug reports.
As of the time of the writing of this guide, Angular 2 does not have an equivalent of Angular 1's $log service. However, there are two packages that provide similar functionality - angular2-log and angular2-logger. For this guide, we'll go through using angular2-logger because it is more thoroughly developed and stable.
Installing a logger
First, we need to install the package. Open the terminal in the root directory of your project:
$ npm install --save angular2-logger
Then, import the Logger in the file where your Angular 2's bootstrap() function resides and put it as an argument in the function. This will inject the Logger on the top level and make the service available in your whole application.
main.ts
import { Logger } from "angular2-logger/core";
bootstrap(AppComponent, [Logger]);
Finally, include the script in index.html. Make sure you incldue it under SystemJS's configuration, as the package relies on it.
index.html
      <!-- 2. Configure SystemJS -->
<script src="systemjs.config.js"></script>
<!-- 3. Import logger -->
<script src="node_modules/angular2-logger/bundles/angular2-logger.js"></script>
Using the logger
Using the logger is fairly easy. Whenever in your application you choose to use the logger, you need to do two things:
1. Import it
import { Logger } from "angular2-logger/core";
2. Add it in the constructor of the component/service/directive
      constructor(private _logger:Logger) {
//
}
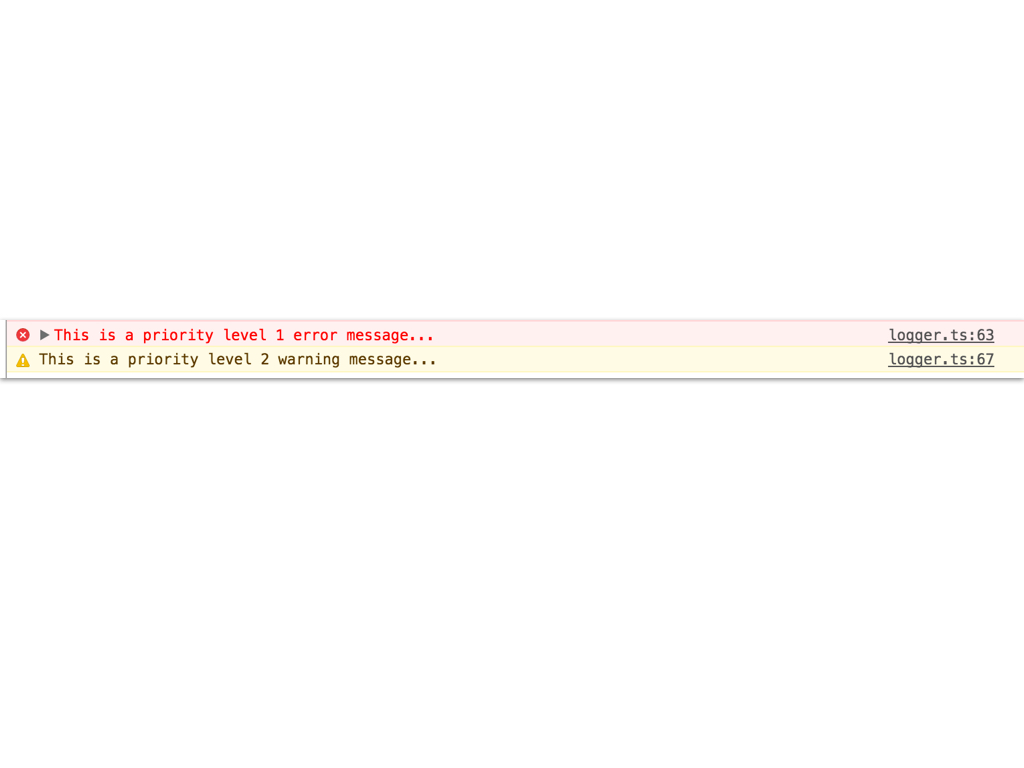
You can now use the logger by referring to it as this._logger :
      this._logger.error('This is a priority level 1 error message...');
this._logger.warn('This is a priority level 2 warning message...');
Conclusion
That was all! I hope this guide saved some of your time on researching for options.
Advance your tech skills today
Access courses on AI, cloud, data, security, and more—all led by industry experts.
