Debugging Components with React Developer Tools
Jun 5, 2020 • 11 Minute Read
Introduction
Debugging a React app using methods such as breakpoints, step-through, and logging to the console is perfectly possible, but it can sometimes be a difficult process—especially when debugging an application you have not seen before. Fortunately, by installing the React developer tools, some of these difficulties can be overcome. This guide will show you how to use the React developer tools Components tab to help navigate and debug an unfamiliar codebase.
The guide will be based on a React web application; however, the developer tools can also be used with a React Native application. The application used in the examples is here.
Installation
The first thing to do is to install the developer tools. How you do this depends on the browser you are using to run the application. For Chrome and Firefox the developer tools are available as browser extensions and can be found in the appropriate extension store. If using a different browser, the developer tools can be installed as a standalone app from this npm package.
Once installed, either in the standalone application or the browser developer tools, two new tabs will be available: Components and Profiler. This guide will use the Components tab.
Components Tab
One of the biggest problems when looking at a React application that you have never seen before is where to find the code for what you see in the browser. React applications will often use techniques such as component composition and, as such, will contain many small components, so identifying which component renders what in the browser can be tricky. This is one time the developer tools Components tab can be very useful.
Find a Component
When you open the components tab, in the left-hand panel you will see the React component tree:
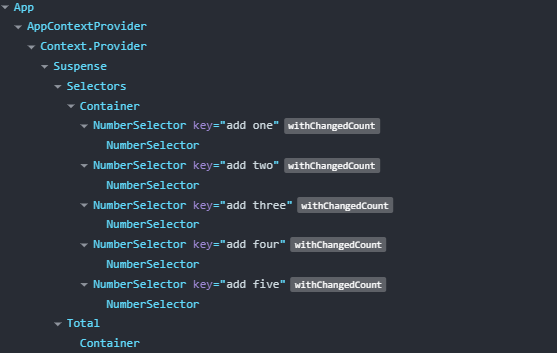
Hover over a component and the HTML it has rendered will highlight in the browser.

Once you've identified the React component you want to look at in detail, you can select it in the tree, and in the right hand panel you can find the file and line of code that rendered it. So in the example application, if you select the first Container component in the tree, you will see this:
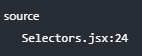
If you go to line 24 of Selectors.jsx it looks like this:
      <Container>
  ...
</Container>

Sometimes you may see components in the tree named Anonymous. This is usually caused by developers exporting the component as an unnamed default using syntax such as:
      export default () => {...};
export default function() {...}
export default class extends Component {...}
All of the above techniques will still work to find the code for the component, it just has no name. In order to ensure your components are named in the tree, replace the above syntax with:
      const AComponent = () => {...}
export default AComponent;

export default function AComponent() {...}
export default class AComponent extends Component {...}

      const WithChangedCount = props => {...};
WithChangedCount.displayName = `withChangedCount(${Component.name})`;
return WithChangedCount;
Filter and Search


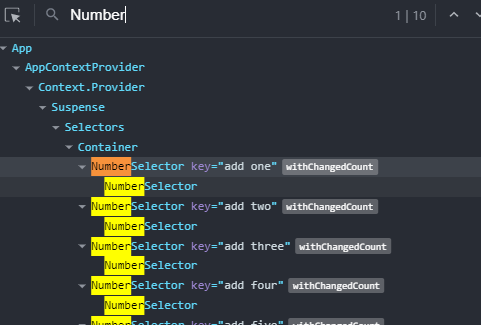
You can also search for components by name by typing a regular expression into the search box like this:
Component State and Props
When a component has been selected in the tree, its current state and props are shown in the right hand panel. As a developer, this allows you to check at any point when debugging an application that the state and props of components are as you expect them to be.
Along with inspecting state and props, it is also possible to change them, which is very useful as a simple way to check how some UI looks under different circumstances and to debug how components interact depending on their current state/props. For instance, in the example app, you could select one of the NumberSelector components in the tree and in its props add an isSelected prop, like this:
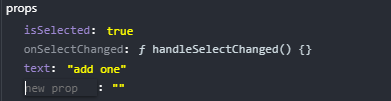
Adding this prop would then check the checkbox of that component. Note that it would only check the box, not call the onSelectChanged callback as you are changing the prop, not checking the box through the UI.
You could also change the state hook in the AppContextProvider component, which controls the running total:
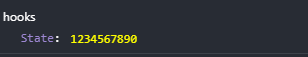
This will update the total displayed in the browser and any subsequent changes to that total will be based on this new state.
Component Render
With the React developer tools, it is also possible to view which components were responsible for rendering the selected component. Often this can be seen by looking at the component tree, but this is not always the case.
To view which components rendered one of the NumberSelector components in the example app, you can select the component in the tree, and in the right-hand panel you will see:
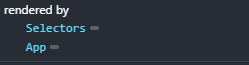
This shows that the NumberSelector was rendered by the Selectors component, which was rendered by the App component. If you look at the component tree, you can see that the NumberSelector is a child of the Container component ,but the Container was not responsible for rendering it. This is because the application has been built using component composition and the list of NumberSelector components were passed as children to the Container from within the Selectors component, like this:
      return (
  <Container>
    {Object.entries(numberSelectors).map(([text, { value }]) => (
      <NumberSelector
        key={text}
        text={text}
        onSelectChanged={handleSelectChanged(text, value)}
      />
    ))}
  </Container> );
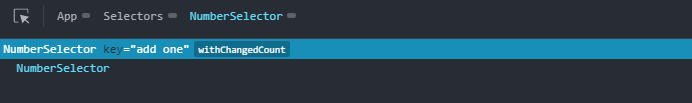
You can also view this information by double-clicking on a component in the tree, which will change the tree to only show components rendered by the selected component. The components that rendered it will be shown in the bar at the top:
Suspense

      <Suspense fallback={<div>This is a suspense fallback</div>}>
  ...
</Suspense>
When the suspend button is clicked, the content specified in the fallback prop will be displayed.
Conclusion
This guide has shown how the React developer tools can be used to make navigating around a React application and debugging the components that are part of it much easier and faster. The code for the example application can be found here.
Advance your tech skills today
Access courses on AI, cloud, data, security, and more—all led by industry experts.
