Enrich Your Enterprise Analytics Capabilities Today With The Elastic Stack
Simplify and better monetize your data analytics and insights by applying these enterprise grade analytics capabilities to your existing software platform.
Jan 10, 2019 • 19 Minute Read
Introduction
“What gets measured, gets managed” - Peter Drucker
Everyone around you is talking about data analytics and insights. They are talking about how they are able to monetize the information they are gathering from their software platforms.

How about you? Have you considered gathering insights from your software platform?
Oh, but it probably will cost a fortune to develop and integrate such capabilities into your platform, right? Well, not necessarily.
The world of software has plenty to offer in terms of data collection, ingestion and analysis. Many of these modern systems integrate fluidly into existing systems.
In this article, I am going to overview a technology stack that will enrich your existing software platform with enterprise grade analytics capabilities.
And to put the cherry on top, we will perform this upgrade without writing a single line of code, through the magic of the Elastic Stack.
What We Will Cover in This Article
At a higher abstraction level, one might break down the common process of gathering (possibly monetization enabling) insights from a running systems information to the following three steps. These steps can be performed on information gathered from our current, running software platform.
Log Collection, Analysis, and Visualization
Note: In this article I using the term “logs” to describe any information our software system produces (e.g. output stream, error stream, hardware interrupts, and also textual log files), and not only textual log files, to which developers write information.
Collection

A running software platform produces plenty of data. This information might be the individual processes log info, CPU utilization information, I/O utilization information, and much more.
Every piece of information, as described above, might come handy in the process of gathering insights that our marketing team can leverage to better understand how the system is being used.
However, it may be the case that we have deployed integrated instrumentation tools into our software platform unwisely or not at all. Sometimes, to include such instrumentation tools (e.g. performance counters on the Windows operating system), we will need to deal with an already deployed system that cannot be modified currently.
For the sake of data collection, we will examine the most capable products from elastic - Beats, and Logstash.
Analysis

Once we’ve gathered all our system logs, we will want to analyze them in order to gather as much insight as possible.
To do so, we will introduce the powerful analytics engine, Elasticsearch. With Elasticsearch at our disposal, we will be able to ingest and “massage” our data to a form suitable for us.
Alternatively, we could simply use Elasticsearch as our “integration” platform. Such a platform integrates our transmitted data with with our visualization layer, something that we will cover shortly. In other words, sometimes data “massaging” prior to visualization may be unnecessary.
In any case, it is important to understand that in the technology stack we are discussing, data visualisation and analysis are coupled to an extent; the visualization layer utilizes the analytics capabilities of Elasticsearch in order to answer the questions the user is asking it. We will see how it works shortly.
Visualization

Data has been transmitted, collected, and analyzed. Next, we want to display it to our end users. That will be done using Kibana, another amazing tool, which directly connects to Elasticsearch and utilises its analytical capabilities to provide stunning dashboards, graphs and ad-hoc queries.
Before we begin, I would like to emphasize several things, which justify the existence of this article.
The Concept

Outsource your distributed systems central log management
Logging information correctly in software platforms, in particular distributed systems - is hard. Gathering data reliably, across machines, networks and domains, and doing so while preserving correct data context is not simple.
Under many circumstances, it will be easy to lose data context (e.g. “where did this function call arrive from”) or even loss data completely.
As we want our data and we want it in context, it is better that we make sure to reliably collect and analyze it. Otherwise, else we will simply not be able to gather insights about our system or even worse we will gather incorrect insights.
Outsourcing the concern for centralized system logging into a dedicated technology stack, does not seem like a bad idea at all. It actually sounds good, to me, and I have done that successfully in several projects.
The Opportunity

Rapid introduction of a rock-solid log analytics provider to your existing system
People tend to underestimate the importance of logging. That is true mostly at the development phase, but not only. Sometimes, we already have good system logs but are simply unaware of them! Important data could actually be lying there and becoming obsolete.
Why not harness the log data your system produces to your advantage? You’ve invested so much in development and maintenance and your system is up and running - take advantage of what it tell you.
Well, using the Elastic Stack, it becomes so easy, that the “it takes too much time and I would rather focus on feature development” excuse becomes irrelevant. And you know what? Gathering relevant data can even become a DevOps task, as you will shortly see, when we examine Beats and Logstash.
Deploy As You Wish

Supports on-premise and cloud deployment
Flexible deployment options are important, but I don’t have to tell you that, right?
You already know that in some cases, a multi-tenant, cloud-hosted deployment is desirable. You also know that in other cases, your client might require you to deploy your data managing technologies on-premise.
Choosing a technological stack, then, becomes more interesting.
Lucky for us, the Elastic Stack is capable of running on the cloud and on-premises.
When running on-premise, we can run all required services on Windows, Linux or inside a docker container.
Interesting, right? Without further ado, let's get started.
Collecting Data With Beats and Logstash
Elastic Stack from the bird’s-eye-view
We’ve come to the point in our discussion were we can begin our dive into the technologies which combined, form the Elastic Stack.
Our journey towards gathering insights begins with collecting raw data our system produces.
Within the Elastic Stack, two technologies can provide us with the ability to gather data and pass it forward to our analytics and visualization engines. I will present and explain both.
Logstash - a short overview
With the open-source Logstash platform, one might define a data processing pipeline on the server-side with its output directed at your desired persistence.
What is a data processing pipeline, in our context? Once again, we are talking about data collection, data processing and data output, just as we have in the bigger context.
This time, though, we are talking about collecting raw data from various inputs, sending that data through filters, and outputting the result data into outputs.
Inputs, filters, and outputs implemented as plugins.
You will probably be able to find what you need on the Logstash page, but in case you don’t, it is rather simple to implement your own plugins.
As a standalone, Logstash can and should be deployed as a cluster of multiple nodes per each data processing pipeline. This setup reduces the risk of data loss and enable the possibility of load balancing incoming data.
Real-life example
Let’s see an example of a data processing pipeline.
Our (male) client has Windows machines. He would like to pass all Windows event logs to the analytics platform.
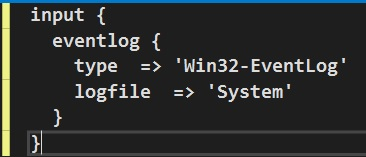
Input(s) configuration
He begins by deploying the Logstash agent on the windows machines, as well as the Eventlog input plugin, as described here. There are plenty of configuration options for which event to send and at which interval to look for them, though, for this example, the below input configuration will suffice:
Filter(s) configuration
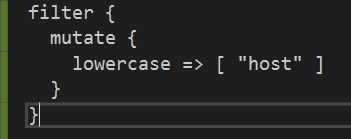
Now, once our data is being collected by Logstash, because we’ve configured an input plugin, we can proceed to the (optional) task of transforming the data and preparing it for transmission. This is done using a filter plugin. Again, a plethora of filter plugins is already available for you to use. If you cannot find a desired filter, you can roll your own.
For the sake of simplicity let's assume that client want us to transmit all “host” fields in the event log messages in lowercase. To do so, we will configure a mutate filter which will do just that.
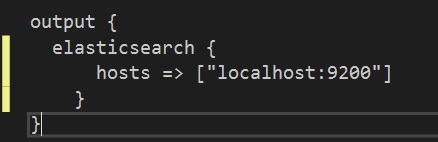
Output(s) configuration
Just you’ve probably guessed, setting an output will also happen via the configuration of an output plugin. I will choose the Elasticsearch output plugin from the list of available plugins. Configuring the Elasticsearch output plugin is a breeze, as can be seen below.
Excellent! At this point we understand how we can build a comprehensive data processing pipeline using Logstash while including input gathering using input plugins, “massaging” data using filter plugins and outputting data using output plugins. And all of that was done without writing a single line of code. Cool, right?
Beats - another short overview
Let’s look at Beats now, the second technology in the Elastic Stack. Beats will allow us to gather and transmit data.
Instead of building a complete data processing pipeline as Logstash does, Beats focuses on doing one thing only in a reliable and light way. That one thing may vary, of course, and there is an expansive collection of available beats on the elastic website. There are also community developed beats, to which you can contribute as well.
Each beat is a lightweight agent, running on the host machine, which specializes at collecting a single type of data (e.g. file, windows event log, network, uptime) and transmitting it to either Logstash or directly to Elasticsearch (which will be reviewed shortly).
Just as with Logstash, you are very likely not to write a single line of code when using Beats. It will usually be a matter of few lines of configuration and running an agent.
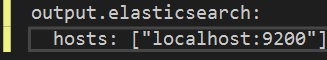
Here is a simple example which demonstrates how to configure the Winlogbeat, which is responsible for gathering and transmitting Windows event logs, and pass them forward to Elasticsearch.
Almost too simple, right? Well, it doesn’t get much more complicated.
There are the expected configuration parameters, such as those required to establish a secured connection, and an optional template mapping configuration (in order to map between transmitted fields and relevant Elasticsearch indexes), but it absolutely remains a configuration concern.
Why both Beats and Logstash?
Well, truth be told, using either in not mandatory.
In general, Beats are very lightweight, and are single-purpose. Use them when you know the contents you are shipping. In that case shipping data directly to Elasticsearch (or Logstash, optionally) is sufficient.
Logstash, as you previously seen, allows you create a complete data pipeline, which is composed of several inputs, filters and outputs. It carries more overhead than simply using single beats.
Indexing, Searching and Analyzing with Elasticsearch
Ok, at this point in time, we have data shipped to our Elasticsearch cluster.
But wait, Kobi, what is this Elasticsearch you keep talking about? And a cluster? You haven’t said anything about a cluster.
Elasticsearch is a distributed technology which acts as an abstraction layer to the most capable full-text-search engine, Lucene, and does so while introducing scalability and reliability to the equation. To top that, Elasticsearch adds a RESTful query language which makes integrating with it simple.
Using Elasticsearch, we can receive textual data, from various sources. In our case, these data sources will be Logstash instances or Beats - or both.
The data is then indexed (for the sake of fast retrieval, upon request) and replicated across data nodes in the Elasticsearch cluster.
By deploying more than one node, we can scale-out our cluster and increase the bandwidth (of data) it can manage.
The cluster exposes an endpoint, to which we can then connect and run queries against using the Elasticsearch query DSL(domain specific language). This is what Kibana does, by the way, as we will shortly discuss.
Utilizing the Sense chrome plugin, for example, you can query your Elasticsearch cluster on-demand.
In the screenshot below, you can see that I’ve sent an HTTP GET request to the cluster, requesting of it to tell me which indexes exist in it.

The cluster I am pointing at currently has no data in it, so you see no indices other than the default ones.
An interesting query, for example, could be “Show me all Error messages transmitted from the Windows Event Log of machine X, in the last 24 hours”.
In the end, there are an unlimited number of interesting questions to ask about our collected data :-).
For a more in-depth review of Elasticsearch, feel free to check my latest Pluralsight course, which dedicates a complete module to explain how the technology works.
Visualizing with Kibana
The last piece of the Elastic Stack puzzle will be Kibana.
Kibana is a visualization engine, specifically made to work with Elasticsearch as its data store. As such, it allows utilizing the full capabilities of the Elasticsearch query DSL in order to tailor dynamic graphs, charts, time-series, geospatial queries and much more.
I encourage you to head to the product website, just to get a better notion of what it allows you to do.
Interacting with Kibana is done via a web UI, as can be seen below.

Configuring a dynamic dashboard to show the amount of error messages in your deployed software platform becomes a matter of several short steps. No more arguments about “painful integrations” and “development costs,” as there are none of either.
Kibana also offers “Dev Tools” as you might have noticed. These will allow your developers and system analysts perform raw queries against the data store. These queries can also be dynamic and shared among different players.
For example, a system analyst might point out to some “strange” result he encountered, and share the query with a developer who will then be able to check if the results are due to a system bug or to some interesting data anomaly.
In Conclusion
Gathering information from and about your running software used to be a task for developers. At one time, our developers needed to “be prophets," anticipating any information which might be of interest to them when debugging a system bug. They also had to embed instrumentation tools (e.g. performance counters) into the software in case clients were interested in any such information. Then, they were tasked with properly transmitting and centralizing the collected information in a single place, where they would use external tools to analyze the data. For that reason, logging was once a developer domain.
The Elastic Stack has completely revamped this system.
Using your DevOps team, you can deploy and configure data-shippers, such as Logstash and/or Beats, and have them transmit all data into an Elasticsearch cluster (also deployed by your DevOps team or hosted in the cloud) which you can then gather insights from using Kibana.
Being able to eliminate dependence on development resources to gather information and analyze a running system grants flexibility to any enterprise.
Best of all, accessing such data and being able to visualize it without any overhead could be the most cost-effective feature you can introduce to your existing software system.
No more excuses. Get to it!
Thank you for joining me in this short journey through the Elastic Stack! I hope you found this article informative and engaging.
Advance your tech skills today
Access courses on AI, cloud, data, security, and more—all led by industry experts.
