Estimate Correlation Coefficient in Azure Machine Learning Studio
Computing a Pearson linear correlation coefficient in Azure Machine Learning Studio helps detect and treat multicollinearity.
Oct 16, 2020 • 8 Minute Read
Introduction
Many machine learning algorithms require that the continuous variables are not correlated with each other, a phenomenon called multicollinearity. This is because multicollinearity adversely impacts the model training process. Estimating relationships between the numerical variables is a common step to detect and treat multicollinearity. For numerical features, finding a correlation coefficient is a common statistical technique used to estimate the presence or absence of a linear relationship between variables. This guide will demonstrate how to compute a Pearson linear correlation coefficient in Azure Machine Learning Studio.
Data
In this guide, you will work with the Pima Indian diabetes dataset available in Azure Machine Learning Studio. This data originally comes from the National Institute of Diabetes and Digestive and Kidney Diseases. The dataset consists of several variables, such as the number of pregnancies the patient has had, their BMI, insulin level, age, and so on. You can have a look at this data here.
The next step is to load and explore the data.
Loading Data
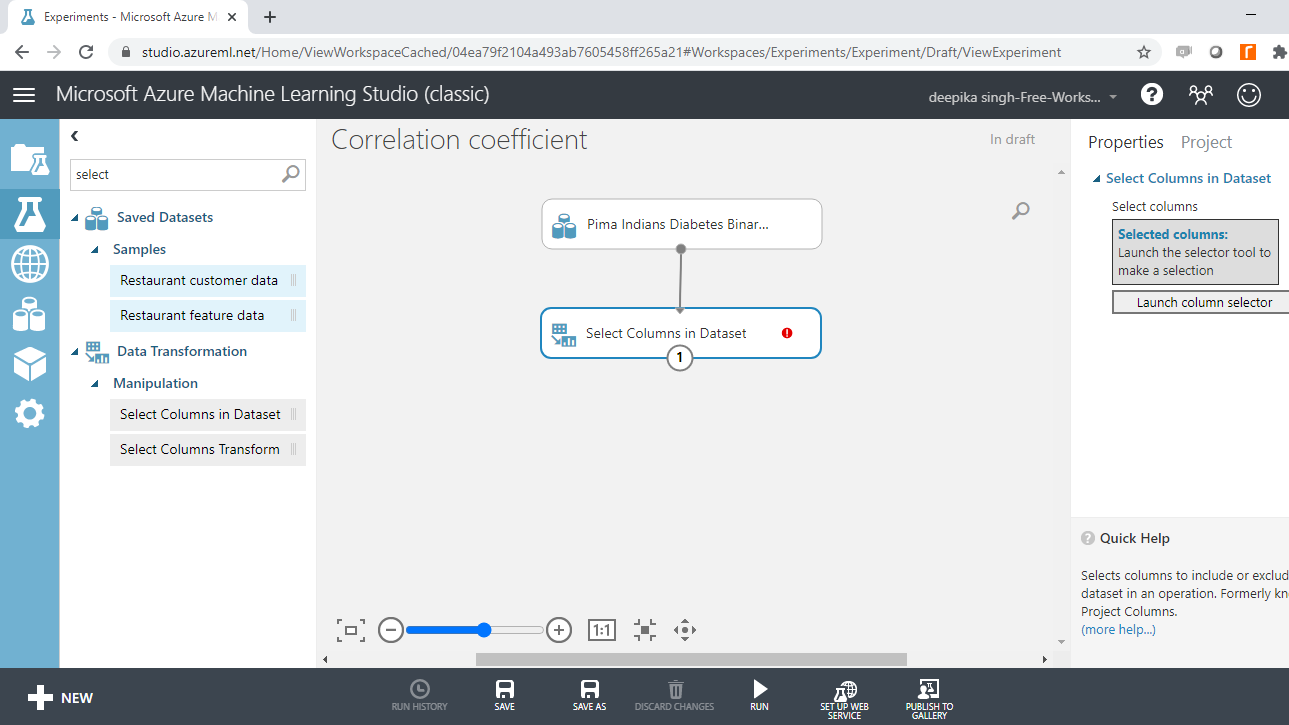
Once you have logged into your Azure Machine Learning Studio account, click on the EXPERIMENTS option, listed on the left sidebar, followed by the NEW button. Next, click on the blank experiment and give the name Correlation coefficient to the workspace. The following screen will be displayed.

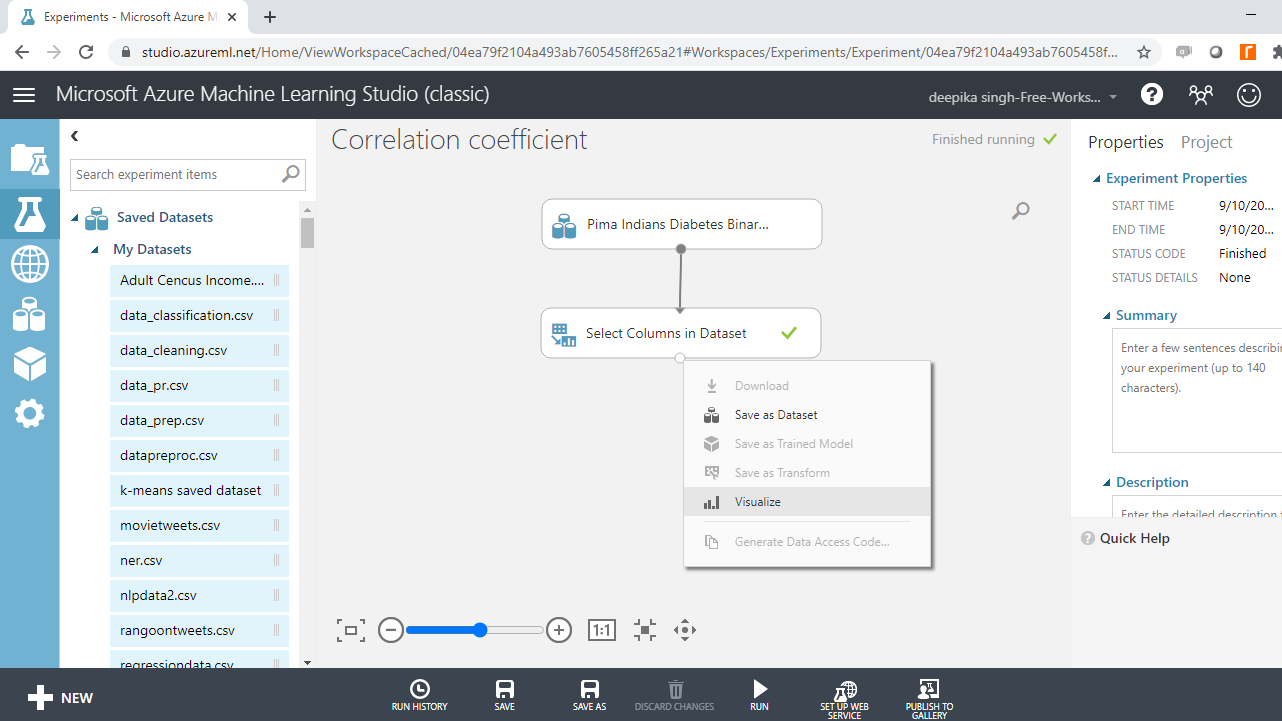
Under the Saved Datasets option, drag the Pima Indians Diabetes dataset into the workspace. Right-click and select the Visualize option to explore the data.

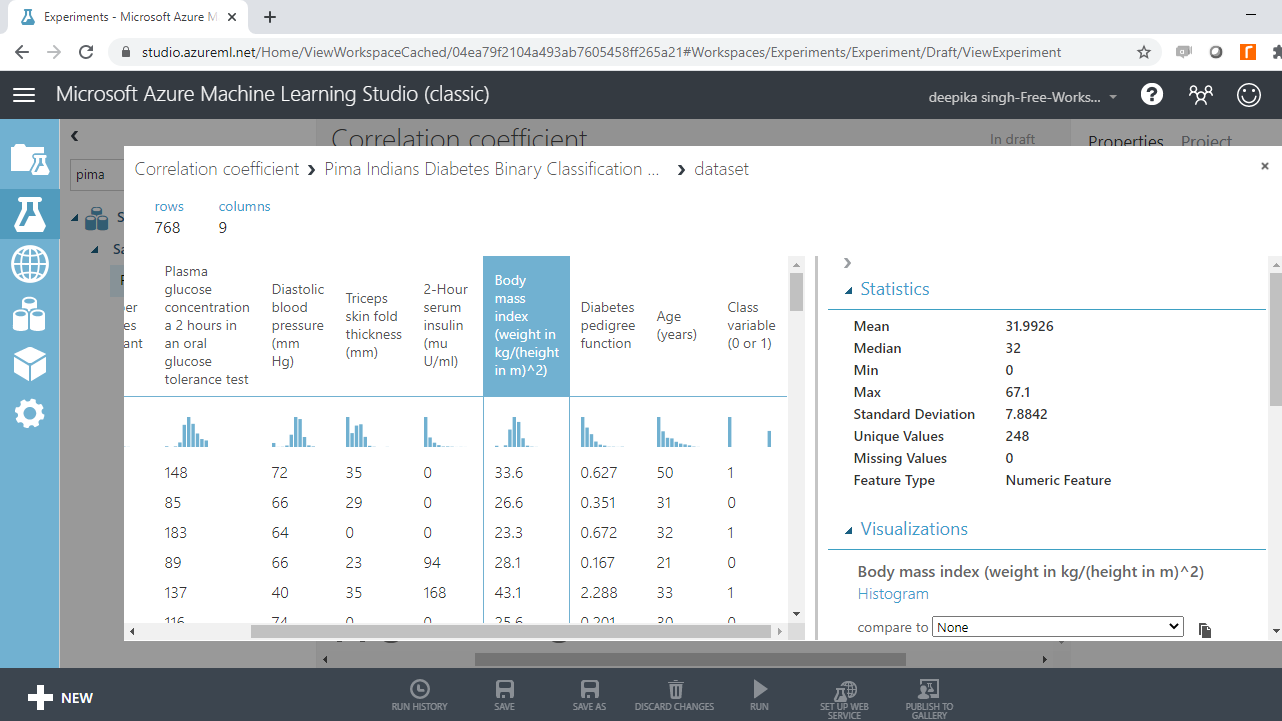
The data contains 768 rows and 9 columns. Select the different variables to examine their basic statistics. For example, the image below displays the details for the Body mass index variable.
Select Columns
Multicollinearity, the presence of a linear relationship, is tested only for numerical variables. The correlation matrix is a technique to identify multicollinearity among numerical variables. To select the required variables in data, search and drag the Select Columns in Dataset module.
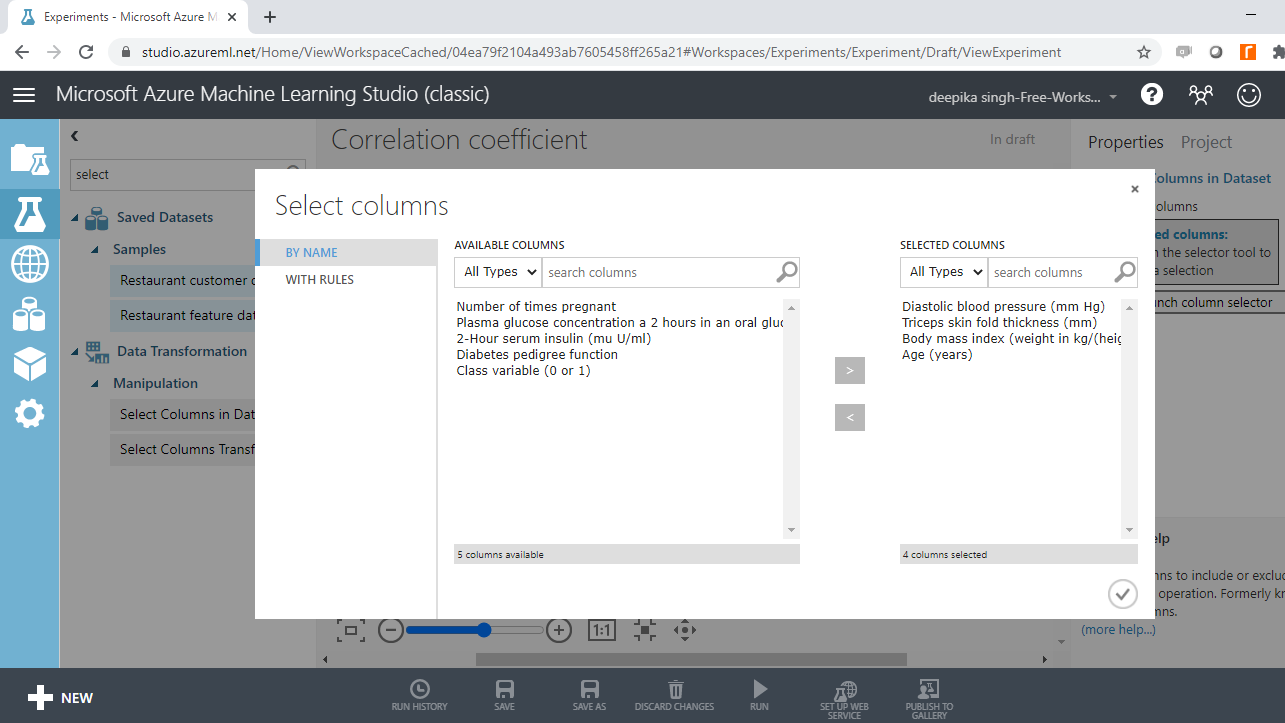
The next step is to click Launch column selector and place the numerical variables you want to test for multicollinearity, into the selected columns box, as shown below.
Run the experiment and Visualize the resulting output.
The output below shows that the resulting data has 768 rows and 4 numerical variables.
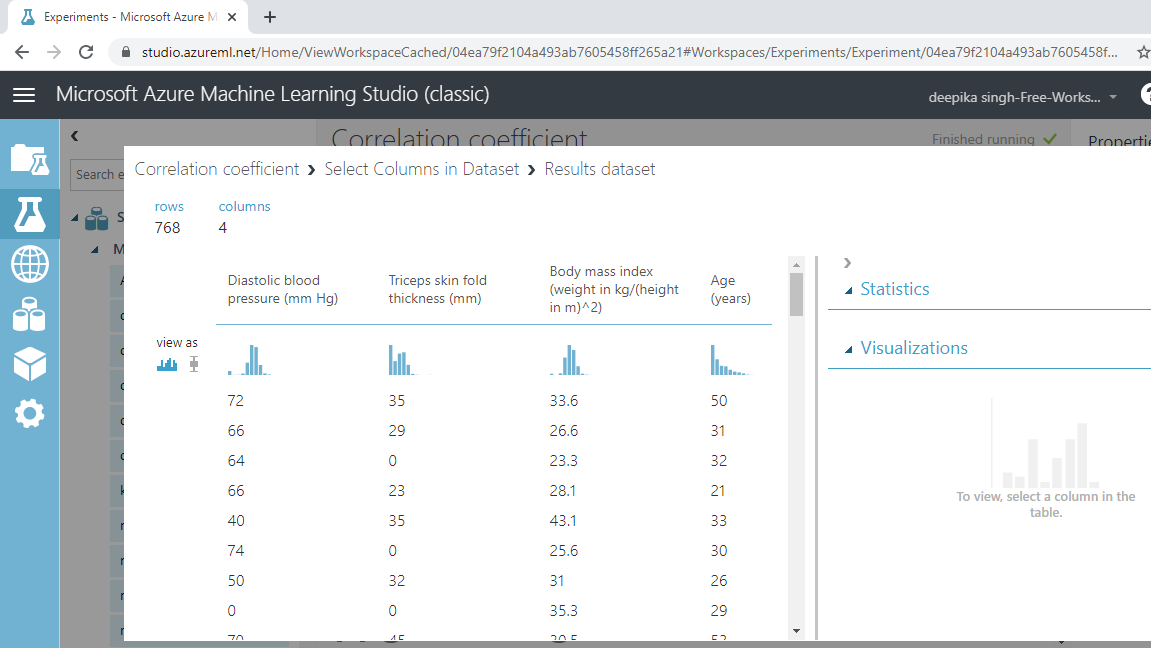
You will compute linear correlation coefficients on these four variables.
Correlation Matrix
The Compute Linear Correlation module is used in Azure Machine Learning Studio to compute and create the correlation matrix. This module is used to compute a set of Pearson correlation coefficients for each possible pair of numerical variables. The coefficient indicate the direction and extent of linear relationship between the variables of interest.
Search and drag the module into the workspace, and Run the experiment.

Once the module run is completed, right-click and select Visualize.
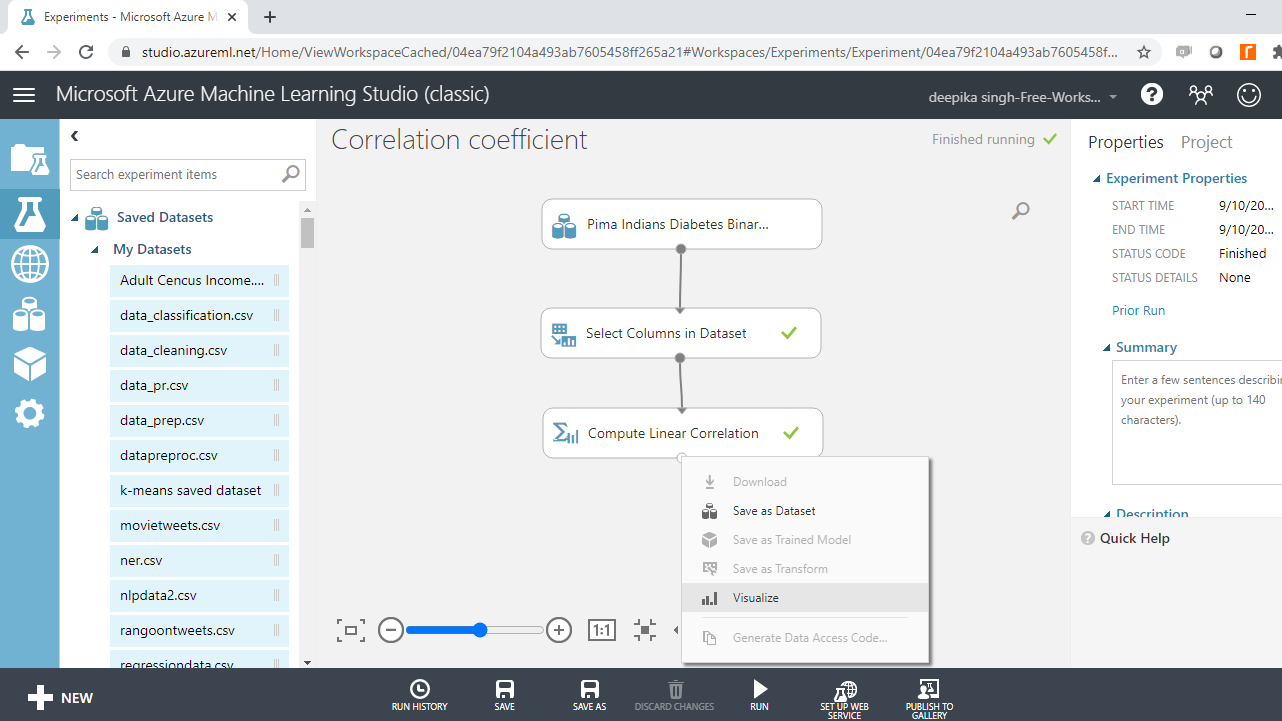
Completing the steps above will generate the following correlation matrix as output.
Interpreting the Correlation Matrix
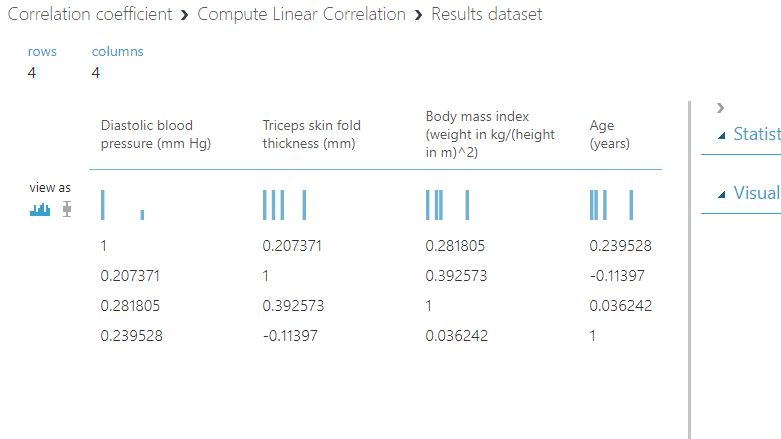
The output shows the correlation between four numerical variables: Diastolic blood pressure, Triceps skin fold thickness, Body mass index, and Age.
The linear correlation coefficient between Diastolic blood pressure to itself is one, which is obvious, but that does not make any sense from a modeling perspective.
The correlation coefficient between Diastolic blood pressure and Triceps skin fold thickness is 0.207371. This is not a significant correlation, so multicollinearity is ruled out between these two variables.
Similarly, the linear correlation coefficient of Diastolic blood pressure with Body mass index and Age is 0.281805 and 0.239528, respectively.
You can similarly interpret the correlation coefficient between the four variables. For correlation to be significant, the rule of thumb is that the absolute value of the coefficient should be greater than 0.6. You can conclude that these four variables are not correlated with each other because the linear correlation coefficient is not significant.
Conclusion
Estimating a correlation coefficient is useful to treat multicollinearity. This often improves machine learning performance for both classification and regression tasks, which are widely used across applications such as marketing analytics, house price prediction, diabetes prediction, equipment failure breakdown, and many more.
Linear correlation coefficient also finds application in inferential statistics, where you can use it to understand the relationship between explanatory and dependent variables.
This guide covered how to compute a linear correlation coefficient and create correlation matrix in Azure Machine Learning Studio. You can learn more on this concept with guides on other technologies like Python and R.
To learn more about data science and machine learning using Azure Machine Learning Studio, please refer to the following guides:
Advance your tech skills today
Access courses on AI, cloud, data, security, and more—all led by industry experts.
