Forecasting in Power BI
Nov 24, 2020 • 5 Minute Read
Introduction
Forecasting is one of the most important areas for any business. You can forecast any metric like revenues, expenses, unit sales, demand, prices, and many more. This guide will demonstrate the important skill of forecasting using inbuilt capabilities in Power BI Desktop.
Data
In this guide, you will work with a fictitious data set of bank loan disbursal across years. The data contains 3,000 observations and 17 variables. You can download the dataset here. The variables to be used are described below:
- Date: Loan disbursal date.
- Loan_disbursed: Loan amount (in US dollars) disbursed by the bank.
Start by loading the data.
Loading Data
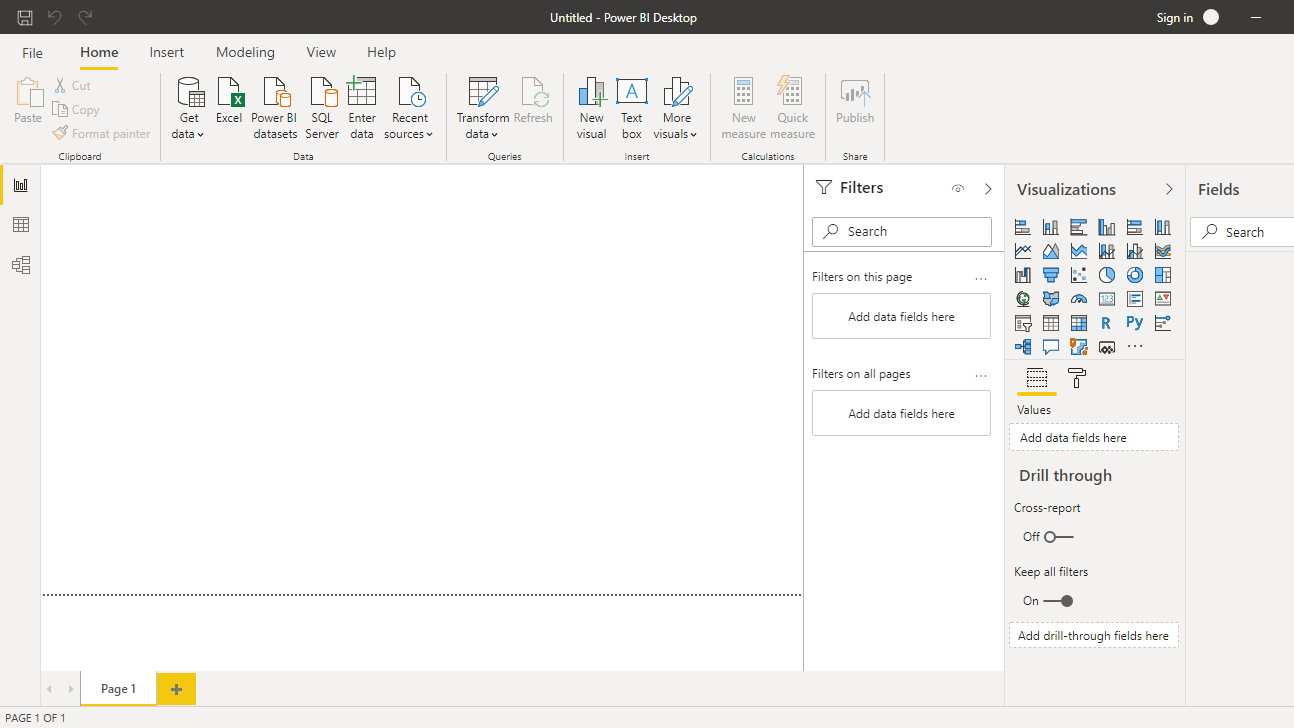
Once you open the Power BI Desktop, the following output is displayed.
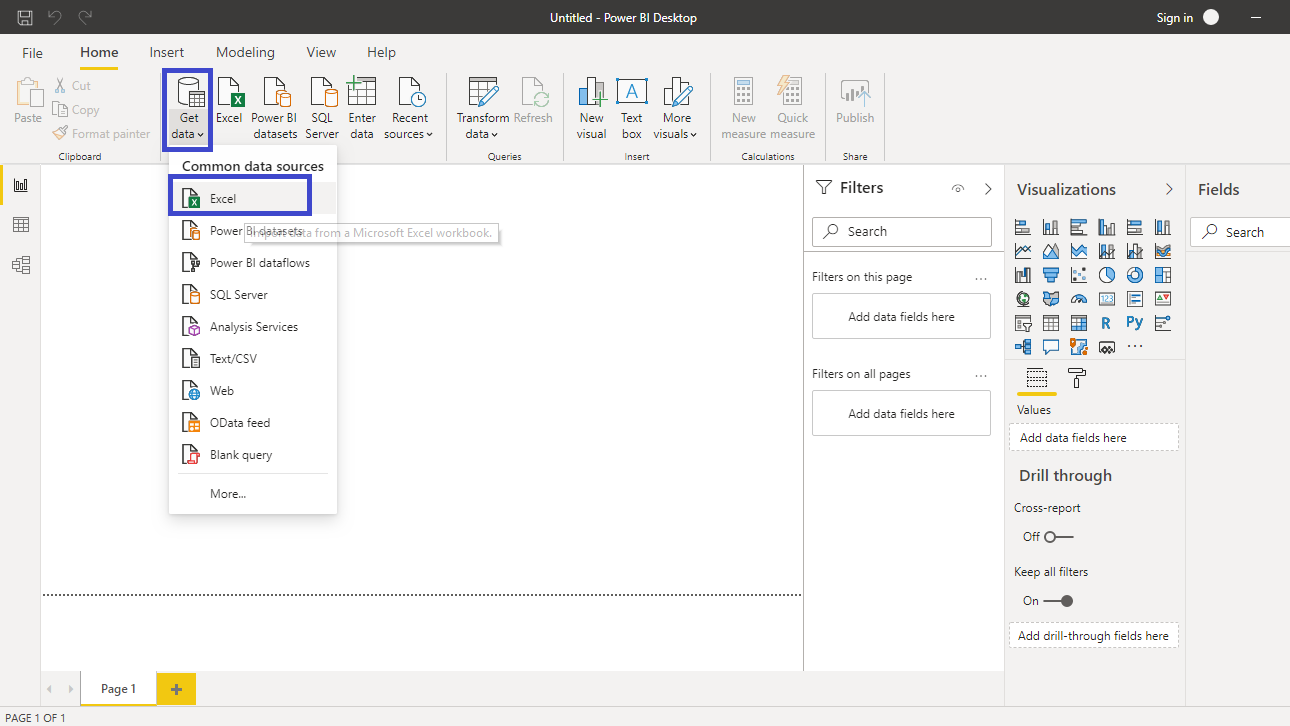
Click on Get data option and select Excel from the options.
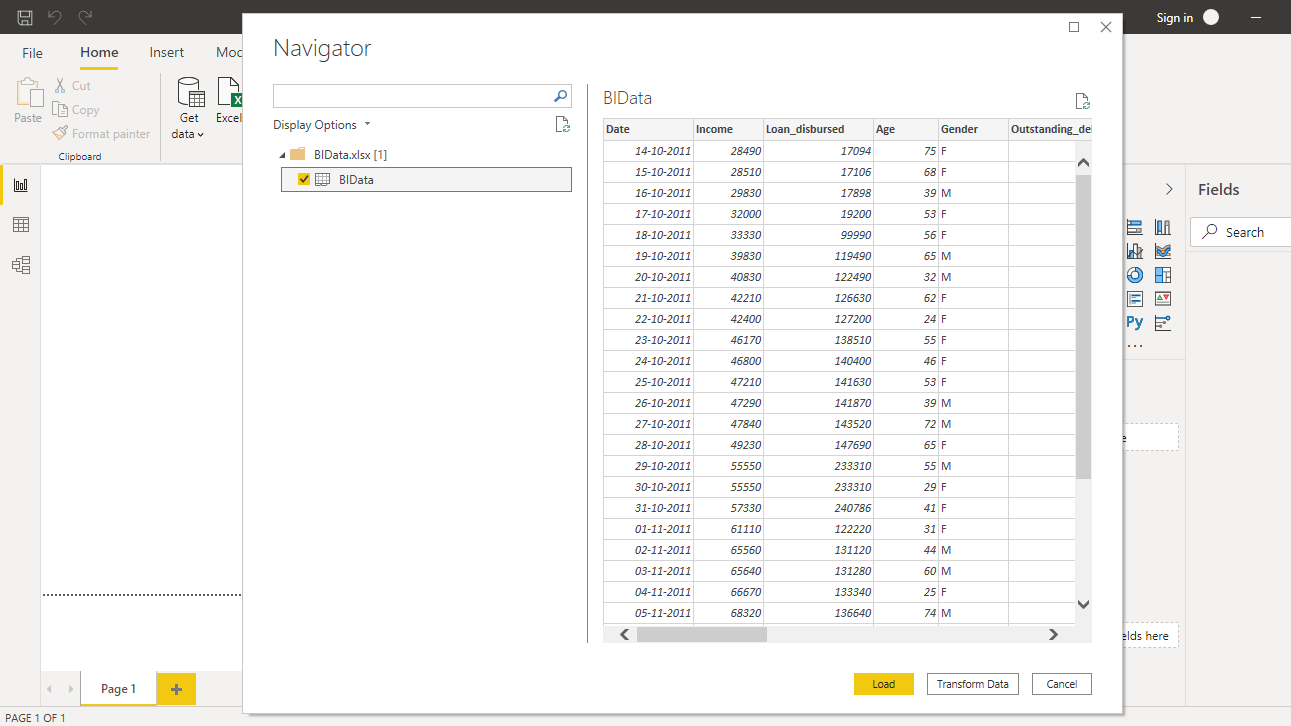
Browse to the location of the file and select it. The name of the file is BIdata.xlsx, and the sheet you will load is BIData sheet. The preview of the data is shown, and once you are satisfied that you are loading the right file, click Load.
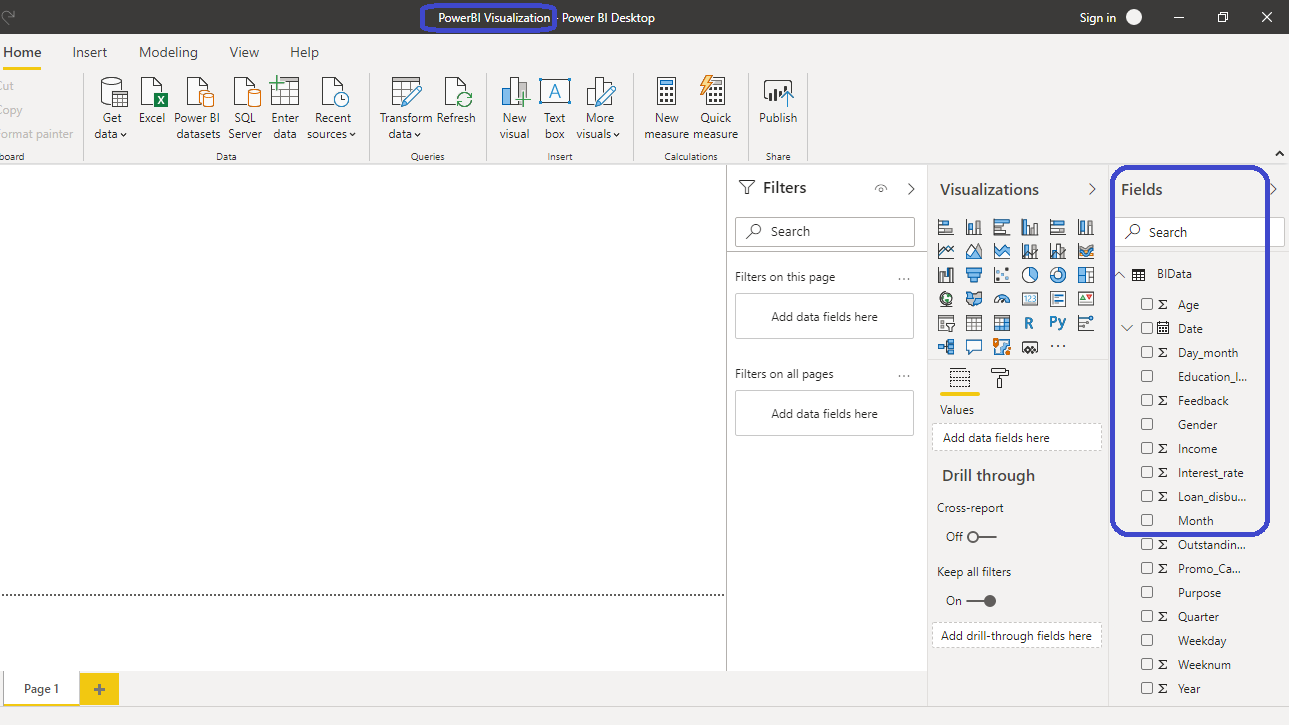
You have loaded the file, and you can save the dashboard. It is named PowerBI Visualization. The Fields pane contains the variables of the data.
Creating Line Chart
Time series forecasting is visually represented with a line chart. So, to begin, you will add a line chart to the canvas. You can locate it in the Visualizations pane. Click on the Line chart and it will create a chart box in the canvas. Nothing is displayed because you are yet to add the required visualization arguments.
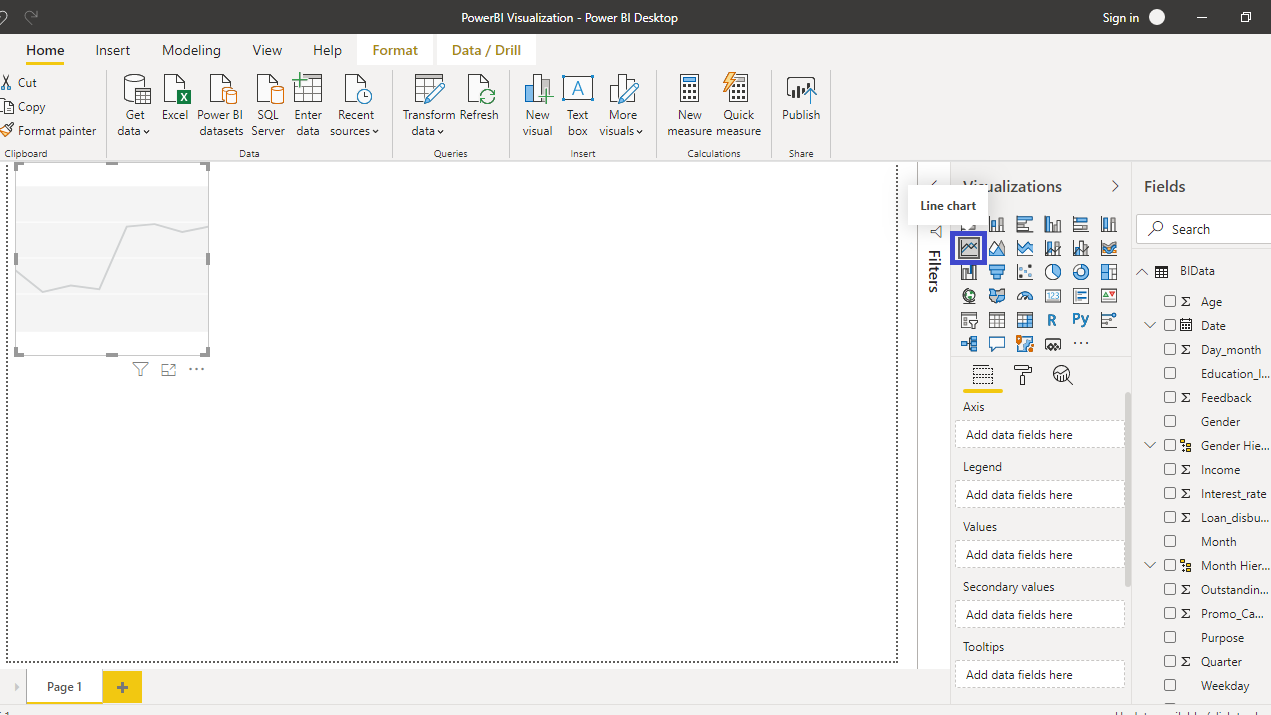
You can resize the chart on the canvas, and the next step is to fill the visualization arguments. Drag the Date variable to the Axis field, and the Loan_disbursed variable into the Values field. This will create the following chart.
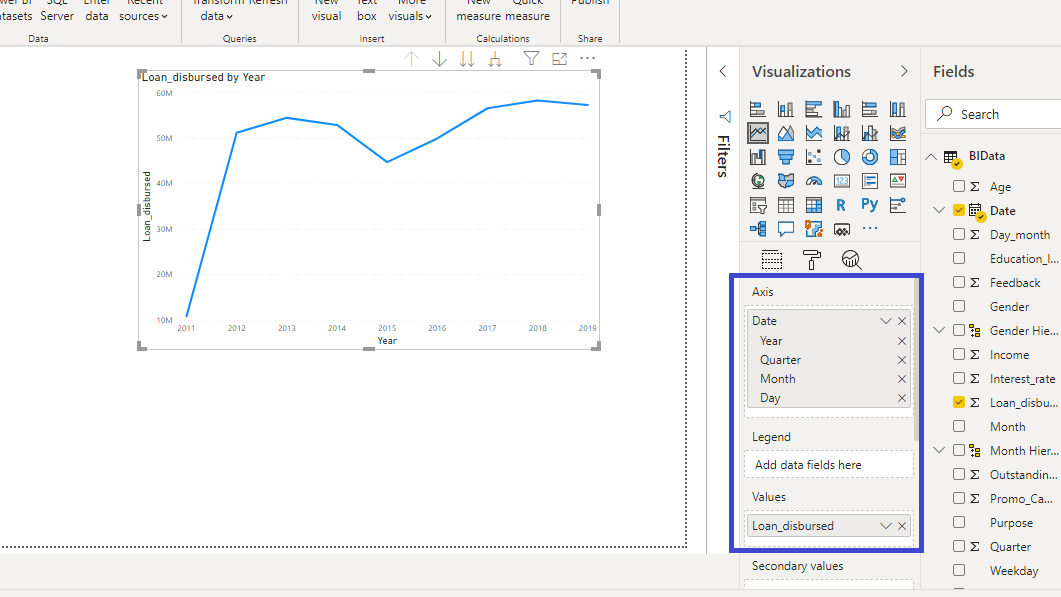
You have created the time series chart named Loan_disbursed by Year. The next step is to generate the forecast of future loan disbursal.
Forecasting in Power BI
The Forecast capability in Power BI is in the Analytics tab.
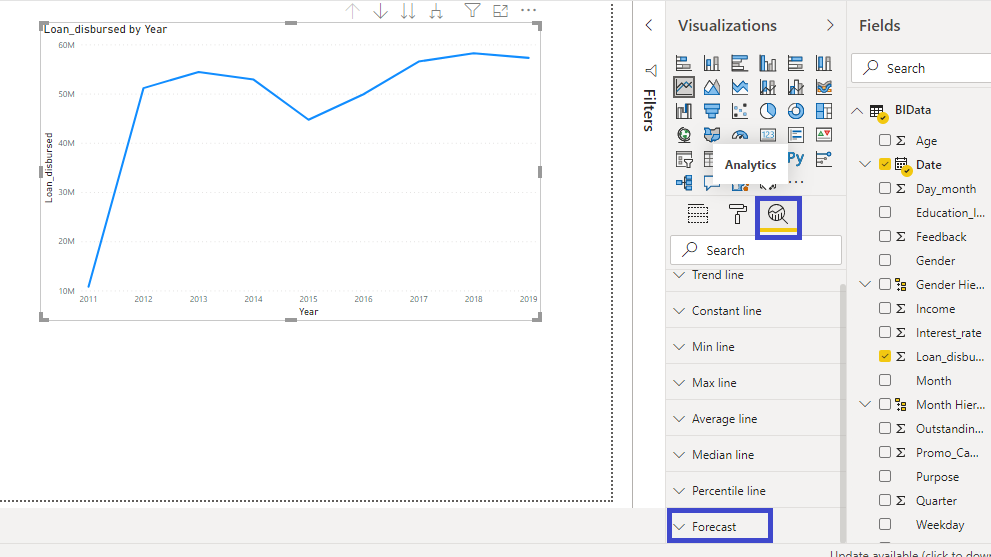
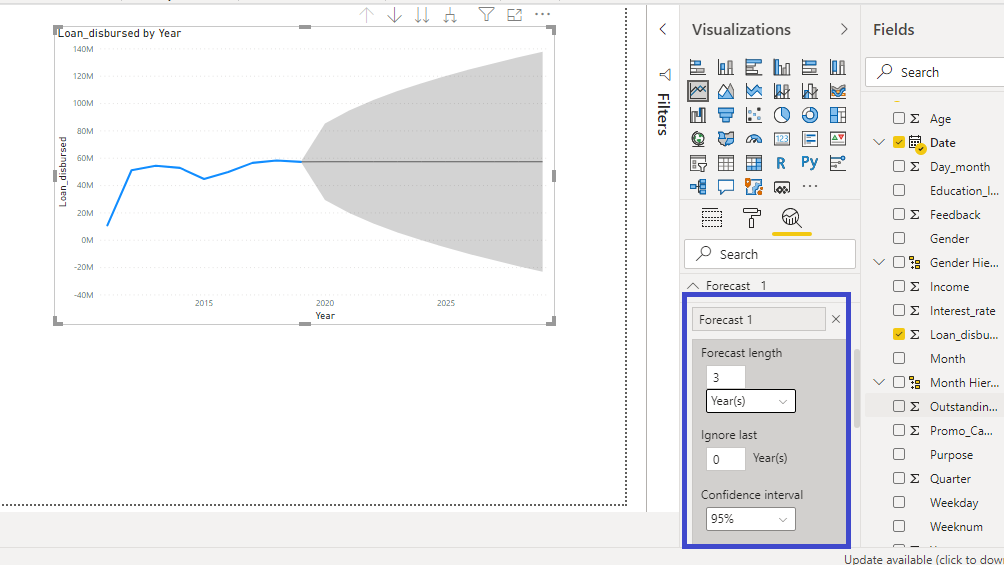
To add a forecast to the data, click on Add under Forecast
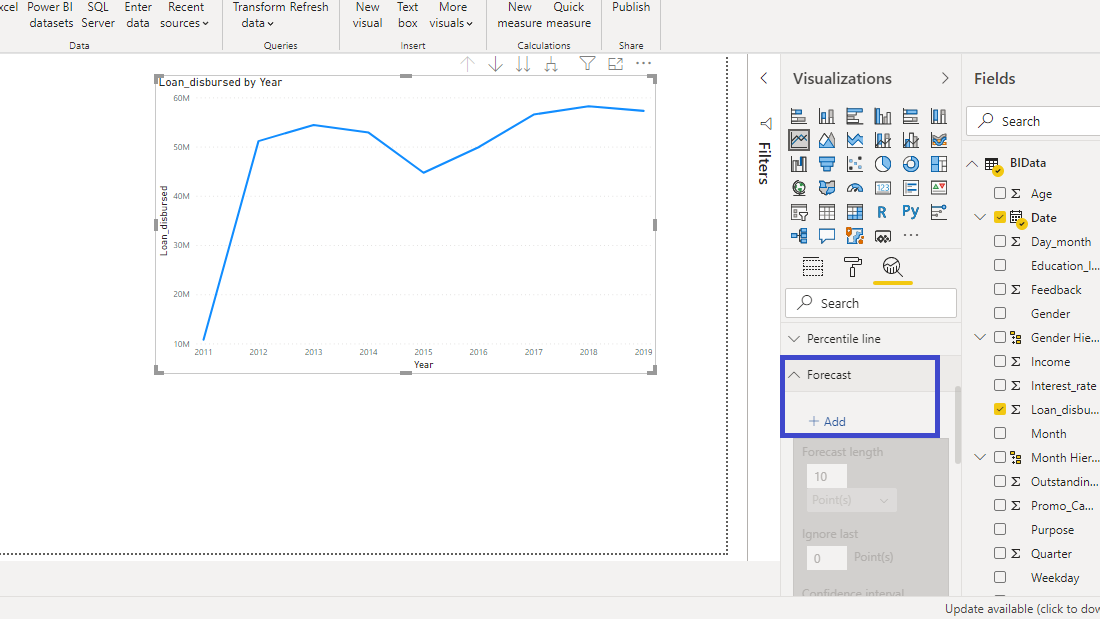
You are required to enter the arguments. Forecast length specifies the length of the forecasting horizon. The Confidence interval specifies the confidence level that the forecast value will fall under the lower and upper bound. The following chart is generated, where the shaded grey region indicates the forecast.
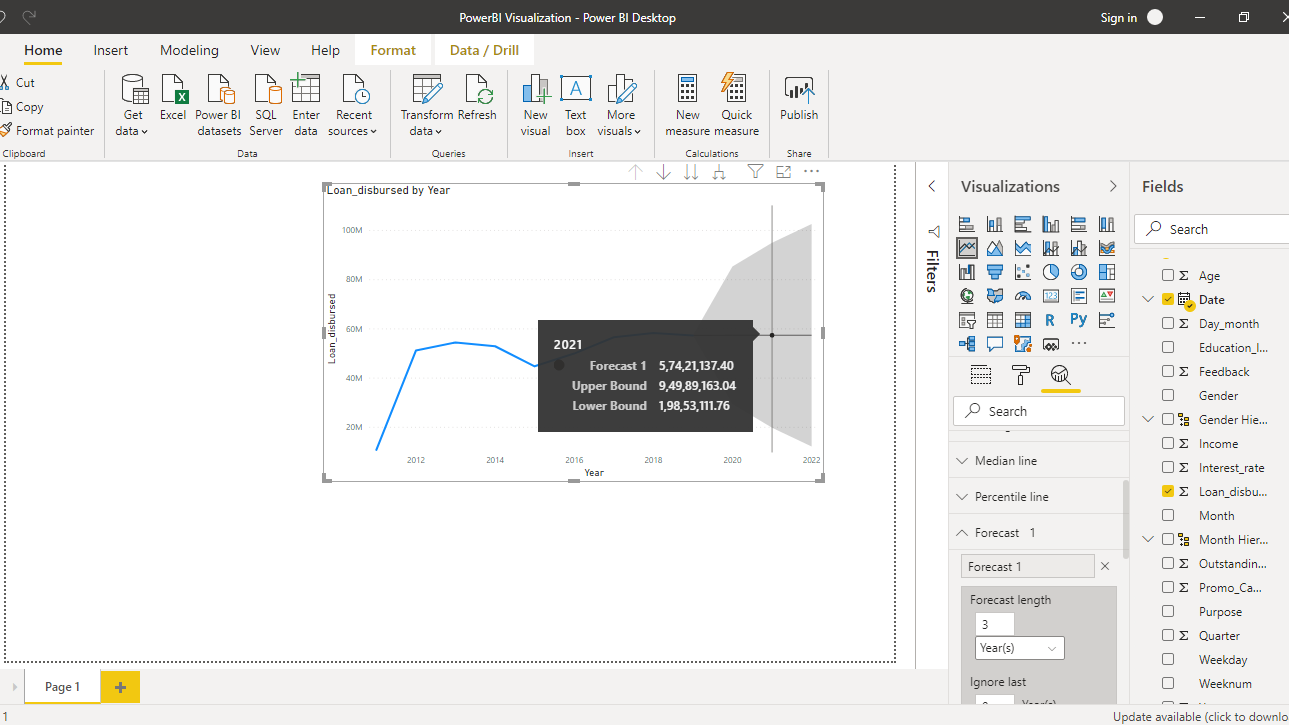
Hover around the shaded region to see the forecasted value. In the chart below, you can see the forecast value for the year 2021, and the lower and upper bound of the forecast at 95 percent confidence interval.
Conclusion
Forecasting is a ubiquitous requirement for every organization, small or big. Business activities require forecasting ranging from sales forecasting to generating price forecasts. It is used in time series forecasting, stock price prediction, inventory forecasting, manpower planning, budgeting, and financial valuation areas. The knowledge of using the forecast capabilities in Power BI will add lots of strength to your analytics and business intelligence capabilities.
To learn more about building powerful visualization in Power BI desktop, please refer to the following guides:
Advance your tech skills today
Access courses on AI, cloud, data, security, and more—all led by industry experts.
