How to Add Images to a Tableau Dashboard Design
Design a dashboard with images that complement your data points and assist stakeholders in understanding your insights.
Nov 25, 2019 • 9 Minute Read
Introduction
There is a lot you can do in Tableau to make your dashboard design visually appealing to your audience. You can change the colors of your charts or experiment with font types and sizes. Adding images or logos can also complement your views and communicate your insights. However, just as a chef uses just a dash of seasoning in a recipe, your images should support your data, not overpower it.
An excellent example of this is Deloitte's North America Technology Fast 500 viz. The dashboard lists 2019's fastest-growing technology companies across multiple verticals.
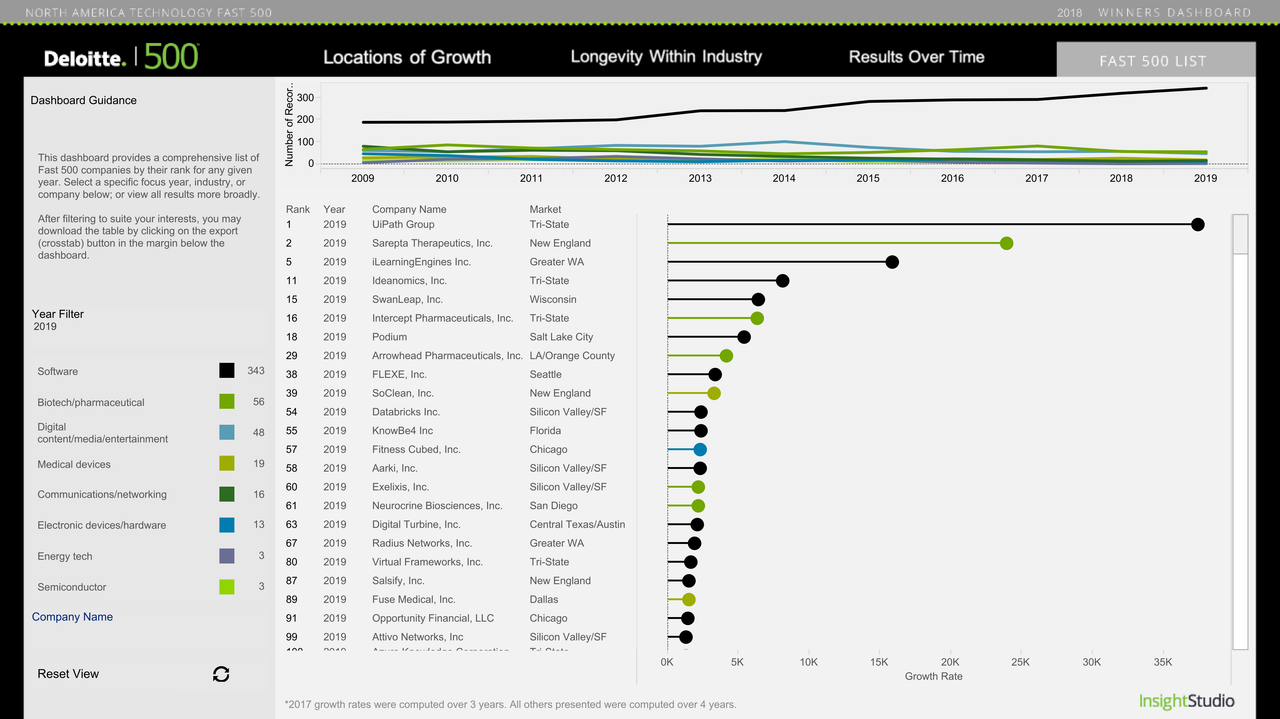
In this guide, we'll build a similar dashboard for Western Representatives University, or WE-REP—a fictional online, for-profit university offering bachelor's, master's, and professional certifications in technology-focused disciplines.
Executives have asked for a dashboard that shows trends in science, technology, engineering, and mathematics (STEM) careers. They plan on using the dashboard, along with other research, to decide if WE-REP should develop a master's degree program in Geographic Information Science and Technology (GIST), which includes collecting, analyzing, and mapping data.
The dashboard will be used to convince investors of the merits of the new curriculum. As such, the dashboard should include WE-REP's logo, along with the company's branding (i.e. font, color, tone).
More specifically, we'll cover the following:
- Importing Images
- Editing Images
- Customizing Images
I'm using the Fastest Growing Occupations, 2018-2028 datasets from the U.S. Bureau of Labor Statistics, Employment Projections program, along with the National Science Foundation's STEM Education Data, which compares the percentage of degrees that are Science and Engineering degrees in each state of the U.S. I'll also use an image from NASA's Jet Propulsion Laboratory's Visions of the Future posters. The version of Tableau I'm using is Tableau Desktop 2019.3.
By the end of this guide, you'll know how to import, edit, and customize images, including logos, to your dashboard design.
Importing Images
In this guide, I'm going to use WE-REP's logo, which I created using Namecheap's Logo Maker.

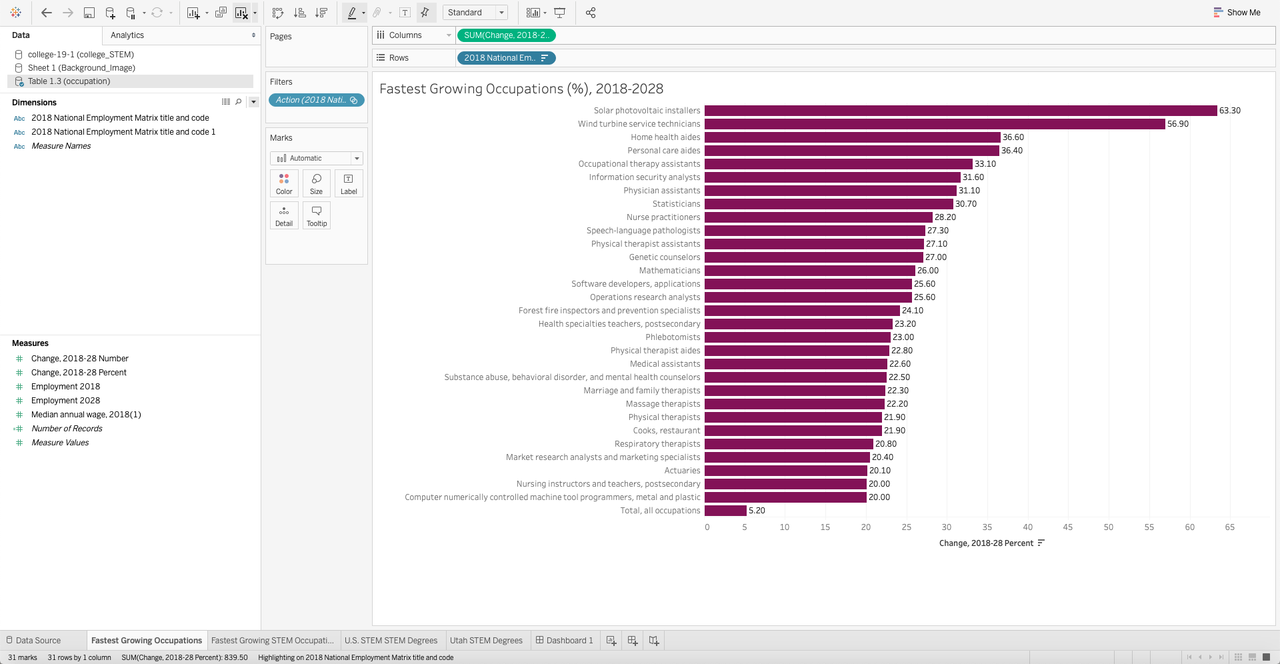
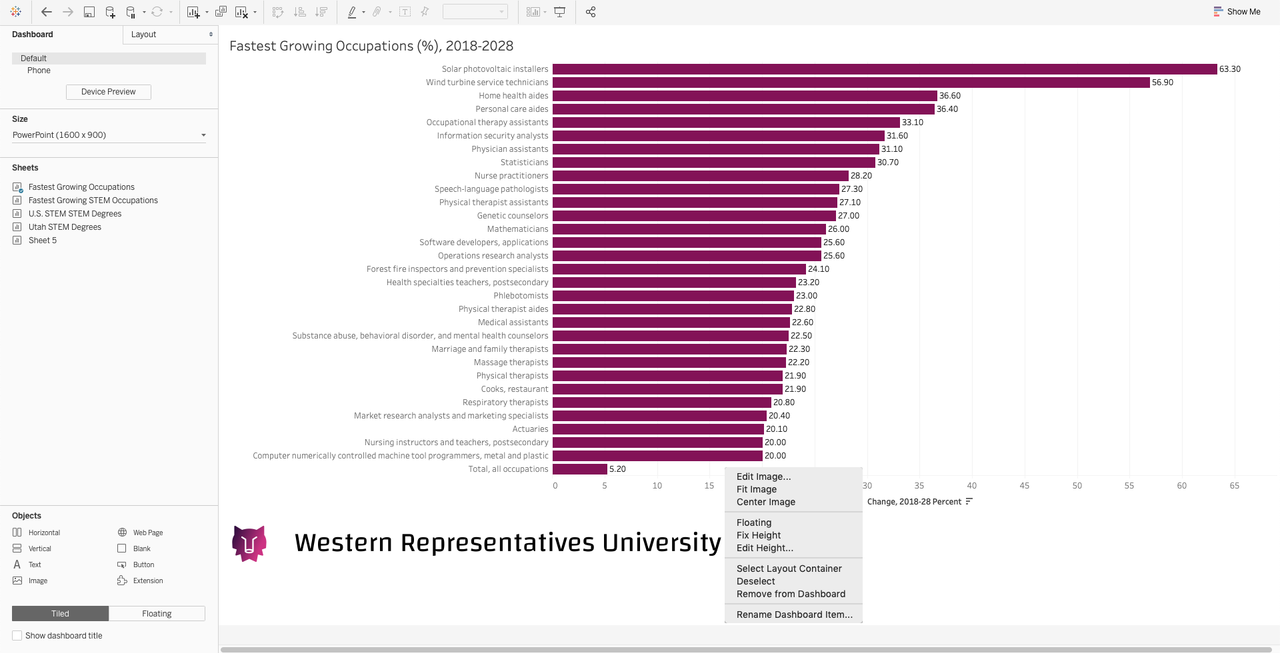
I've downloaded and connected the Fastest Growing Occupations datasets from the Bureau of Labor Statistics website, selecting Table 1.3 to create a bar chart visualization in the dashboard. The occupations have been sorted by growth percentage.
Now add a dashboard by clicking on the icon with four squares to the right of Sheet 1. Since this dashboard will be shown in a presentation to WE-REP executives, I've selected the PowerPoint option for the Size.
Next, drag the vertical object into the canvas and then drag the worksheet with the bar chart onto the bottom container. Now, click and drag Sheet 1 onto the canvas.
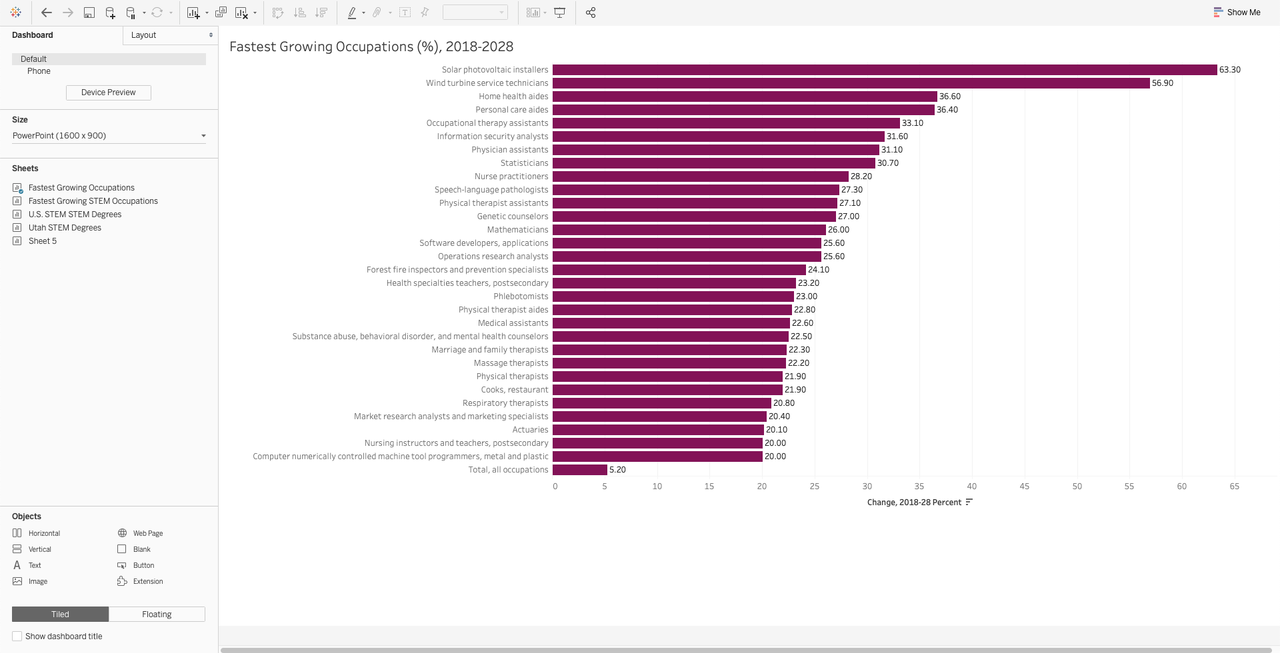
Next, double-click Image in the Objects section of the left panel. I'll click on Choose and select the WE-REP logo.
There's also an option to add a URL to the image so that when a stakeholder clicks or taps on the logo, it will open a website.
Since I've already downloaded the logo, I'm going to select it from my desktop and add it to the dashboard.
Editing Images
There are many options for arranging images once added to a dashboard. One of the easiest ways you can move an image is by simply clicking on it and dragging it to a new location using the tab that appears at the top of the container. When the image is in place, let go of the mouse and the image will snap into place.
Once in place, you have several options for making adjustments to the image. The options are found by right-clicking on the image container and selecting Edit Image, Select Image, Center Image, Floating, Fix Height, or Edit Height.
Let's go through each so you'll know which to use in a given situation.
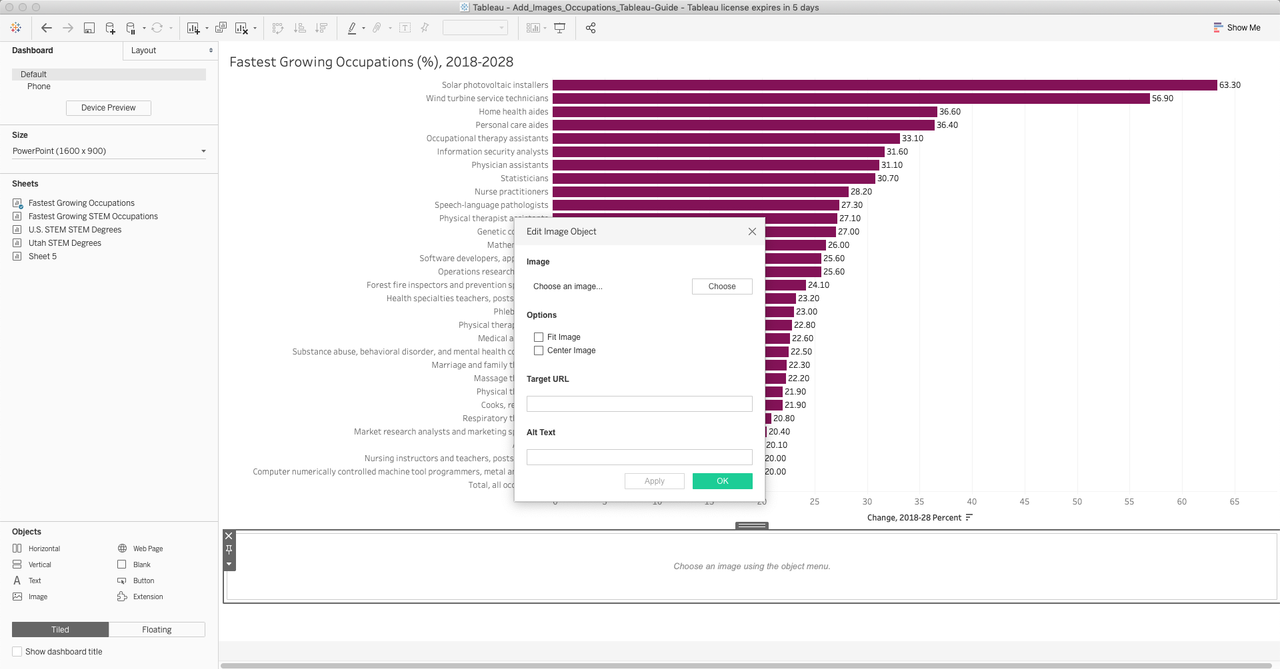
Selecting the Edit Image option brings up the Edit Image Object dialogue box, where you can select Fit Image and Center Image, along with adding the previously mentioned Target URL for the image and the Alt Text, which displays when you hover over an image.
Selecting the Fit Image option after right-clicking on the logo forces the image and container to expand to fill in empty space in the dashboard.
The Center Image option that's available after right-clicking an image container can help center an image.
If you'd like even more control over image placement, you can change the dashboard containers from Tiled to Floating by clicking on the Floating button in the Objects pane or by right-clicking on the image container and selecting Floating. This will allow you to place the image anywhere in the dashboard without restriction.
The Fix Height and Edit Height options provide offer further control of an image's appearance in a dashboard. You can access these options by right-clicking on an image and choosing to either set a fixed height or edit the height of the image.
For the WE-REP dashboard project, I'm going to simply drag the logo from below the bar chart to above it.
Customizing Images
There may be situations where you want to add a background image to your data points for your dashboard view.
For example, you could add a futuristic background image to STEM Education data points in WE-REP's home state of Utah to suggest the institution is a university of the future.
To accomplish this task, switch from the dashboard tab to a worksheet tab. Next, click on the Map menu item, then Background Maps, and then select None. Otherwise, the image will be hidden behind Tableau's map.
Next, make sure the x-axis and y-axis are showing on the canvas. If not, right-click on the measures in the Columns and Rows shelf and check the Show Header option if it's not already checked.
Here's how to add the background image:
- Click on Map in the menu
- Select Background Images
- Select your workbook name
- Once the Background Images dialogue box opens, click Add Image and browse for the asset
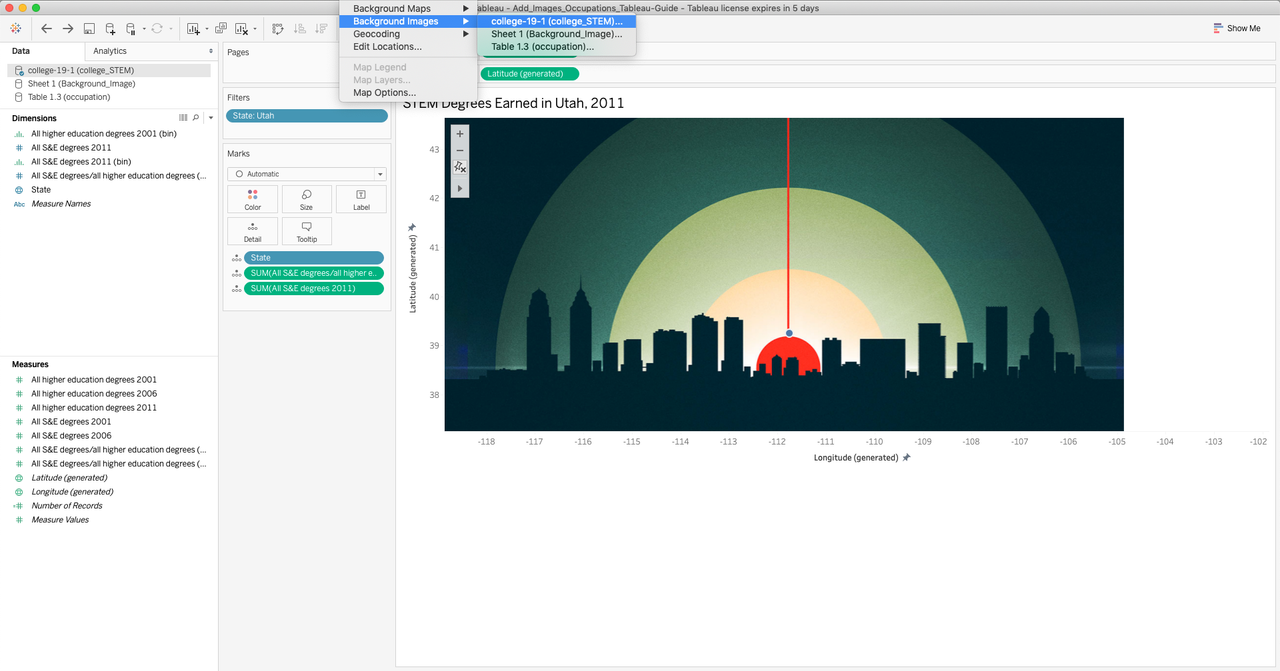
Now fill out the X Field and Y Field. They tell Tableau where to place the image on the canvas. You can find the longitude and latitude of your data points by right-clicking on a data point in the canvas and selecting View Data.
Once you add the coordinates, click on Options, check the Always Show Entire Image option, and click OK. If your image isn't in the right position, adjust the coordinates until the background image aligns with your data points.
Conclusion
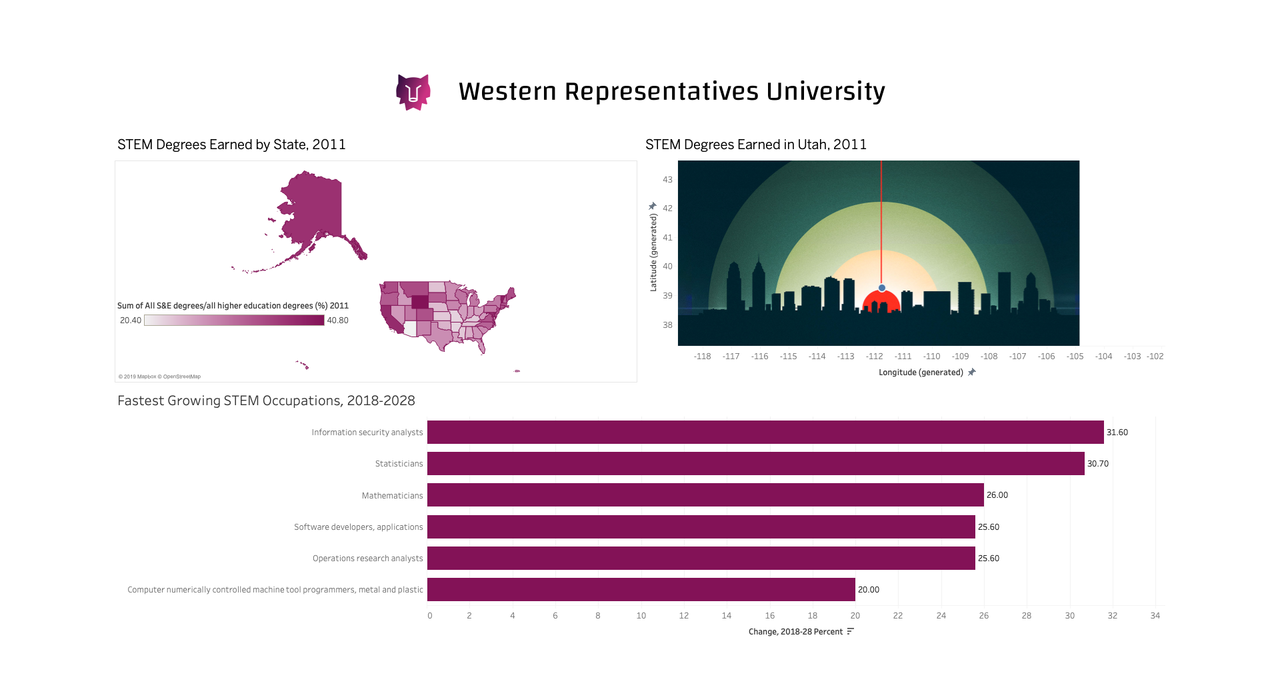
In this guide, we covered how to add images to a dashboard design for Western Representatives University, or WE-REP. Specifically, we looked at options for importing, editing, and customizing images in Tableau. Now you can design a dashboard with images that complement your data points and assist stakeholders in understanding your insights.
Make sure to check out my other Tableau guides, including:
Advance your tech skills today
Access courses on AI, cloud, data, security, and more—all led by industry experts.
