How to Predict if You'll Be Able to Get a Bank Loan, Using Red Sqirl
Want to learn how to predict if you'll be able to get a bank loan? Using Red Sqirl and predictive data analytics, you can! Check out this tutorial today to learn how to build your own prediction tools!
Jan 10, 2019 • 13 Minute Read
Introduction
We'd all love the ability to predict the future, regardless of our life experiences, occupation, and ethics. The idea of knowing something before it happens, and thus knowing something before everyone else, can put us at a major advantage in almost every competitive situation.
That brings us to predictive data analytics.
So, as an example, we'll use bank loans. Through predictive analytics we can build a model to predict whether or not a person will be given a loan if they were to apply for one.
To build our predictive model, we'll be using Red Sqirl.
Red Sqirl is a web-based big data application that simplifies data analysis using a drag-and-drop interface. With Red Sqirl you can simply access the power of the Hadoop eco-system and its packages for different Hadoop technologies.
Using data taken from the Machine Learning Repository (located here, and Red Sqirl, we will build a predictive model using a Spark Decision Tree to predict if an applicant would be "good" = 1 or "bad" = 2 to receive a loan if they were to apply to this bank.
To use Spark in Red Sqirl you'll need the following python libraries on all data nodes:
- python-dateutil
- numpy (used by Spark for machine learning)
More information about this is available here:
[https://spark.apache.org/docs/1.4.1/mllib-guide.html#dependencies][https://www.redsqirl.com/]
Getting started with Red Sqirl
There are tutorials for starting with Red Sqirl here.
Video tutorial:
- [https://www.youtube.com/watch?v=LL6adYq4YL4]
Written tutorials:
Once you're somewhat familiar with the Red Sqirl platform, we can start our Decision Tree Model tutorial.
The Decision Tree Model
Our goal is to predict if a bank will classify a person as “good” (score = 1) or “bad” (score = 2) using their data. Our prediction will help us determine if they should receive a loan.
The data used in the model are related to demographics, credit aim, history, account status, and many other barometers which allow decision makers in the bank to grant or withhold credit.
More info about the dataset can be found at [this UCI archive](https://archive.ics.uci.edu/ml/datasets/Statlog+(German+Credit+Data). (If the link does not work, just enter "UCI German Credit Data" into Google.)
We’ll use the data with categorical variables titled german.data. You can simply download the data and follow along.
Before starting in Red Sqirl, we need to add an extra column to the data with CustId. We add a string starting with GD001.
Start building the model
To start, create a german_credit.mrtxt folder in your Hadoop File System. Then download the data as a .txt file and place them into the german_credit.mrtxt folder.
- At the Red Sqirl home page, create a new canvas by clicking the plus symbol on the canvas tabs bar.
- Drag a Pig Text Source from the footer onto the canvas, double click on it, and name it “credit”.
- Select the “german_credit.mrtxt” path.
- Open the header window, copy and paste the header into the “Change header” field: “CustId STRING,Status CATEGORY,Duration INT,CreditHist CATEGORY,Purpose CATEGORY,Amount FLOAT,SavingAccount CATEGORY,Employment CATEGORY,InstalmentRate INT,Personal CATEGORY,Debtors CATEGORY,Residence INT,Property CATEGORY,Age INT,OtherInstalments CATEGORY,Housing CATEGORY,NumberExistCred INT,Job CATEGORY,CredMaintainance INT,Telephone CATEGORY,ForeignWorker CATEGORY,Cost CATEGORY ”
- Click ok.
By leaving the mouse cursor on the source action you'll be able to see some of the configuration details.
Next, drop a new Pig Select action icon onto the canvas.
- Create a link from “credit” to the new Pig Select action.
- Double click on the new Pig Select action to open it.
- Name the action “prep“ double click to configure it. You'll now see the configuration pages for this action.
- On the first page just click on copy to get all the data.
- Add a new line by clicking the plus sign in the top corner of the window and write function RANDOM() and give it a name “Mixing” and type Double.
- You can also use the little pen symbol to open the editor and choose utilis -> RANDOM().
- Click next.
- Click next.
- Click OK.
Now we will save our model. Go to File -> Save as -> call it “ourmodel” -> click OK.
Then drop another Pig Select action icon onto the canvas.
- Create a link from “prep” to the new Pig Select action.
- Double click to open this new action.
- And name this new action “training“.
- On the first page, click on copy.
- Uncheck the boxes by clicking the box below the bin icon. Select only the “Mixing” field. Remove it by clicking the bin icon.
- Click next.
- Click next.
- In the condition window add “Mixing >= 0.3” formula to get 70% of your data as a training set.
- Scroll down on the same page and change the output type to “Text Map-reduce directory”.
- Click OK.
Now drop another Pig Select action icon onto the canvas.
- Create a link from “prep” to the new Pig Select action.
- Double click to open this new action.
- And name this new action “prediction“.
- On the first page just click on copy.
- Uncheck the boxes by clicking the box below the bin icon and select only the “Mixing” filed and remove it by clicking bin icon.
- Click next.
- Click next.
- In the condition window add a “Mixing < 0.3” formula to get 30% of your data as the prediction set.
- Scroll down on the same page and change the output type to “Text Map-reduce directory”.
- Click OK.
- Select both training and prediction, go to Edit -> Output state -> Buffered.
We are changing the output type to buffered to see intermediate results here. The arcs will change colour to blue.
An alternative way of creating training and prediction datasets
You can also use Sample Pig to create training and prediction datasets instead of creating the “prep” action with RANDOM() and following the Pig Select action.
- Create a link from the source “credit” to the new Pig Sample action.
- Double click on the new Pig Select action to open it.
- Name the action “training“. Double click to configure it.
- Set the training sample size to 0.7.
- Click next.
- Change the output type to "Text Map-reduce directory".
- Click OK.
- Drag a second Sample Pig onto the canvas and do steps from 2 to 7 with the name “prediction” and sample size 0.3.
You can link these actions to Spark Decision Tree as described in next step.
Dropping a Decision Tree onto the canvas
- Create a link from “training” and another from "prediction" to the new Spark Decision Tree action icon.
- Double-click on it to open it.
- Name the action “spark_dt“.
- On the first configuration page, choose ID as the “CustId” and “Cost” as the target.
- Click next.
- Put 10 as max tree depth on the Algorithm Prediction and Settings page .
- If you are using Spark, change the partition to be 1.
- Click OK.
Drop a Pig Join Action onto the canvas
- Create a link from “prediction” to the new pig join action.
- Create a link from “spark_dt” to the new pig join action.
- Double-click the Pig Join and call it “model_outp”.
- The first configuration page for the Pig Join action will show you a list of the tables and aliases. Click next.
- On the following page, just add 3 new lines by clicking +:
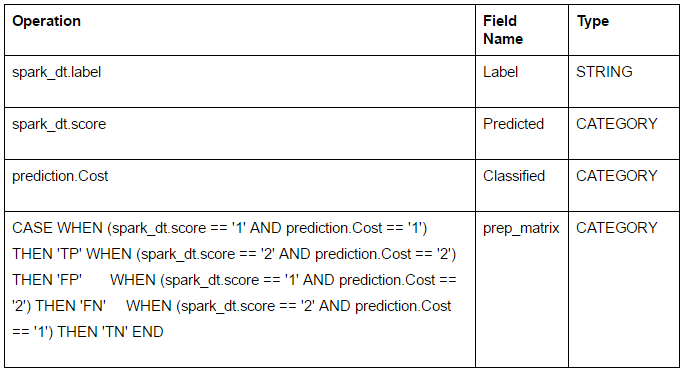
- “Classified” is the field with the class label already given in the German credit dataset and “Predicted” is our new predicted class from the decision tree model we will run.
- Click OK and Click next.
- The next page has two interactions that specify the join type and the fields to join on.
- We will use the default join type which is “Join”.
- In the “Join Field” column, open the editor by clicking the pen and choosing “prediction. CustId” for the prediction table and “sparkdt.label” for the spark_dt table specified in Relation. This condition will join these two tables together.
- Click next , next and OK.
Calculating model accuracy, precision and recall
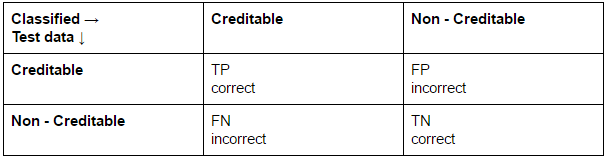
In this confusion matrix, the "correct" cells are the following:
- TN: The number of true negatives, i.e., customers who did not get credit whom we correctly classified as not-creditable (not receiving credit).
- TP: The number of true positives, i.e., customers who got credit and we correctly classified as creditable.
The "error" cells are:
- FN: The number of false negatives, i.e., customers who did receive credit whom we incorrectly classified as non-creditable (not receiving credit).
- FP: The number of false positives, i.e., customers who did not receive credit whom we incorrectly classified as creditable (receiving credit).
Drop a Pig Aggregate action icon onto the canvas.
- Create a link from “model_outp”, name it new pig “final_outp”
- Leave the “Group by” page (located in the configuration window) empty.
- Click Next.
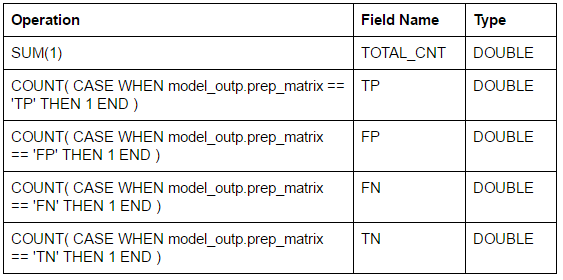
- Add 5 new fields by clicking the “+” sign. New fields are presented in the table below. You can use the editor window to create them or copy and paste following formula.
- Click next.
- Click next.
- Click OK.
Drop a Pig Select action icon onto the canvas.
- Create a link from “final_outp” to the new pig action. Name the pig action “performance_measure”
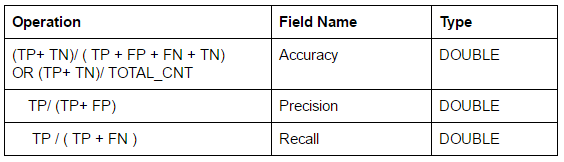
- Add 3 new fields by clicking the “+” sign.
- The new fields are presented in table below. You can use the editor to create them or copy and paste following formula.
- Click next again click next.
- Click OK.
Now we’ll run our decision tree model by going to Project -> Save and run.
We’ve counted the cases classified correctly and incorrectly in the last Aggregate Pig Action and we got performance measures from the Select Pig action to evaluate the models performance:
- Accuracy = TP+TN / TP+FP+FN+TN = 0.72 = 72% of instances classified correctly
- Precision = TP/TP+FP = 0.76
- Recall = TP/TP+FN = 0.80
You may have different values here. It depends on your prediction and training datasets sizes. As we are using RANDOM(), the number of cases in training and prediction obtained by the condition >= 0.3 and < 0.3 may vary.
Analyzing model performance
To determine how well this model performs, ask and answer these questions:
- Accuracy - How many of the instances are classified correctly in our model?
- Precision - What fraction is correct out of all cases classified with the label “positive”? This tells us what proportion of the customers we predicted are creditable (will receive credit).
- Recall - This is showing us what proportion of customers actually did not receive credit (not-creditable) that we classified as not receiving credit.
Now, when the model is done and you took a look at its output and performance, you can try to predict if you would get a loan from the bank based on the decision tree model as a way of evaluating you as a “good” or “bad” customer.
All you need to do now is add new lines into the prediction set with your data (or data from your family, friends, colleagues) and run a model to get the answer to the question, would you (or your loved ones) get a loan in the given circumstances.
When you fill in your data, leave the Cost field empty as this is the field value you are trying to predict.
You can also build a Decision Tree Model with numerical versions of these data, or a logistic regression model, or SVM in Red Sqirl to predict if you will get a loan, and compare the performance between the different models and input types.
Enjoy!
Advance your tech skills today
Access courses on AI, cloud, data, security, and more—all led by industry experts.
