Hypothesis Testing using T-test in Azure Machine Learning Studio
Data science and machine learning often require formulating hypotheses and testing them with statistical tests, such as a t-test to compare whether two groups have different means.
Oct 21, 2020 • 11 Minute Read
Introduction
Data science and machine learning often require formulating hypotheses and testing them with statistical tests. One such common hypothesis testing process is performing a t-test to compare whether two groups have different means. In this guide, you will learn how to compute and analyze t-test statistics with Azure Machine Learning Studio.
Data
In this guide, you will work with a fictitious dataset of loan applicants that includes 600 observations and nine variables, as described below.
-
Is_graduate: Whether the applicant is a graduate or not.
-
Income: Annual Income of the applicant (in US dollars).
-
Loan_amount: Loan amount (in US dollars) for which the application was submitted.
-
Credit_score: Whether the applicant's credit score was good ("Satisfactory") or not ("Not_satisfactory").
-
Age: The applicant’s age in years.
-
approval_status: Whether the loan application was approved ("Yes") or not ("No"). This is the dependent variable.
-
Sex: Gender of the applicant.
-
Investment: Investment amount (in US dollars) in stocks and mutual funds, as declared by the applicant.
-
Purpose: Purpose for applying for the loan.
Start by loading the data.
Loading Data
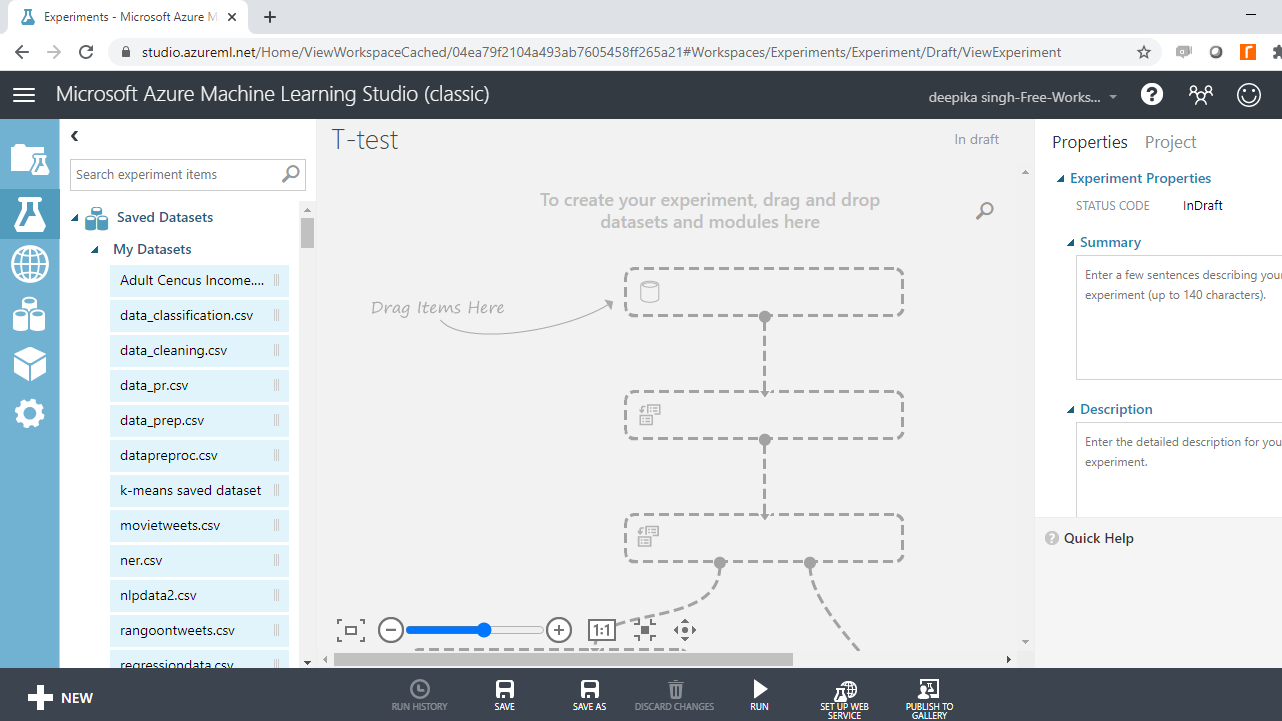
Once you have logged into your Azure Machine Learning Studio account, click on the EXPERIMENTS option, listed on the left sidebar, followed by the NEW button. Next, click on the blank experiment and give the name T-test to the workspace. The following screen will be displayed.
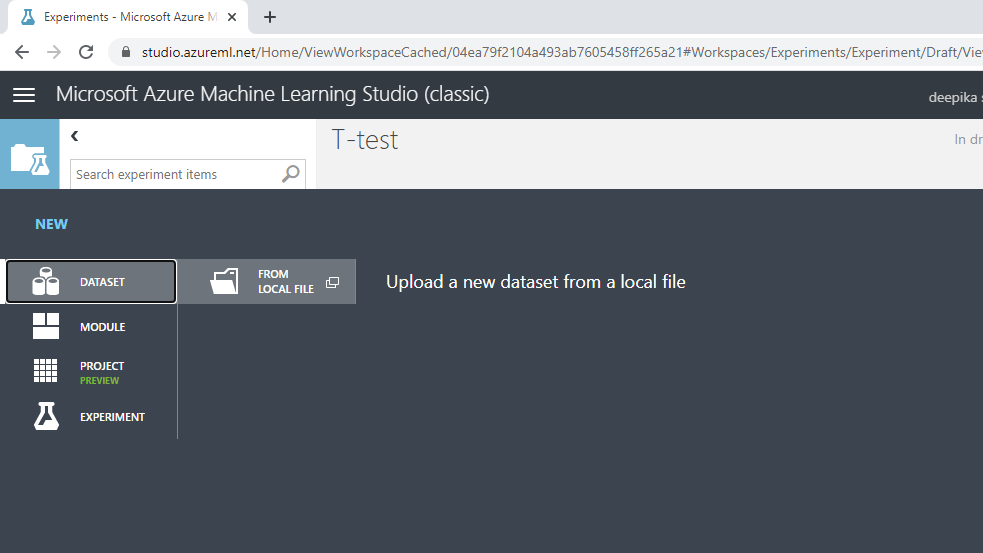
Next, load the data into the workspace. Click NEW, and select the DATASET option shown below.
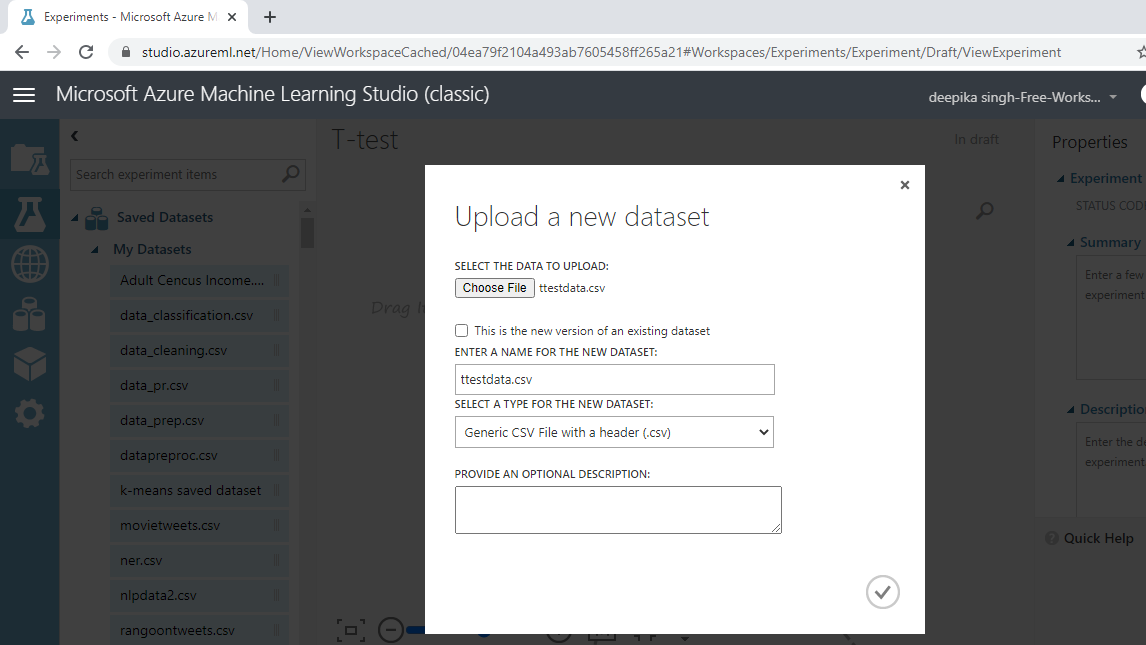
The selection above will open a window, shown below, which can be used to upload the dataset from the local system.
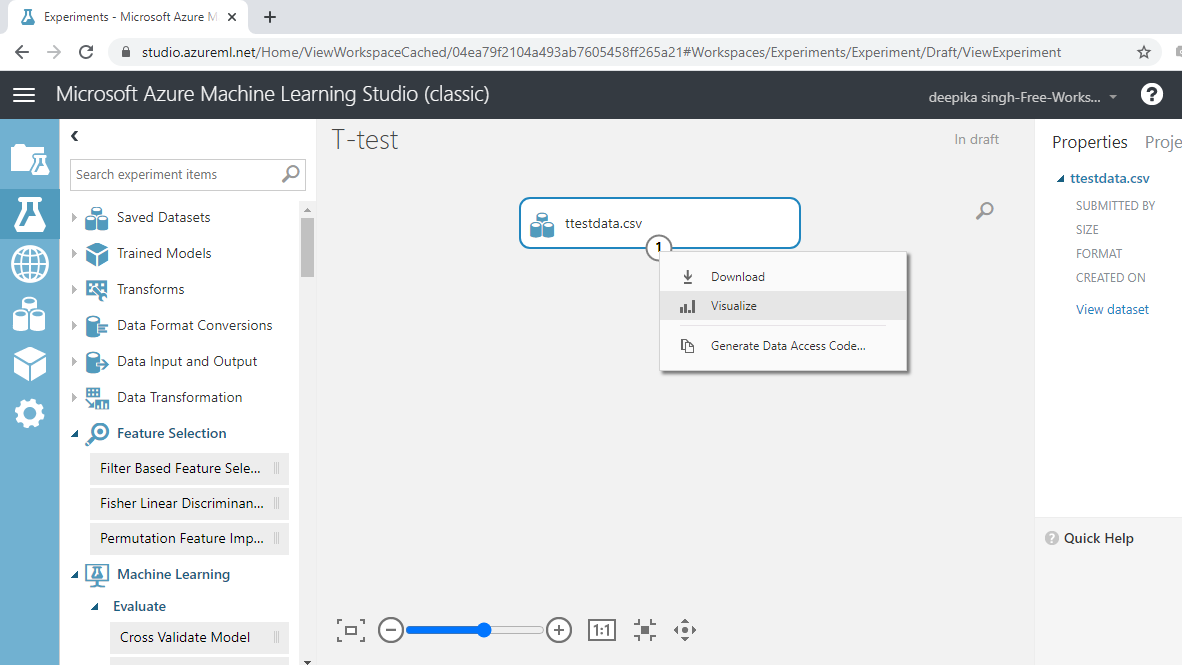
Once the data is loaded, you can see it in the Saved Datasets option. The file name is ttestdata.csv. The next step is to drag it from the Saved Datasets list into the workspace. To explore this data, right-click and select the Visualize option as shown below.
The data contains 600 rows and nine columns. Selecting any variable will display its statistics, as shown below.
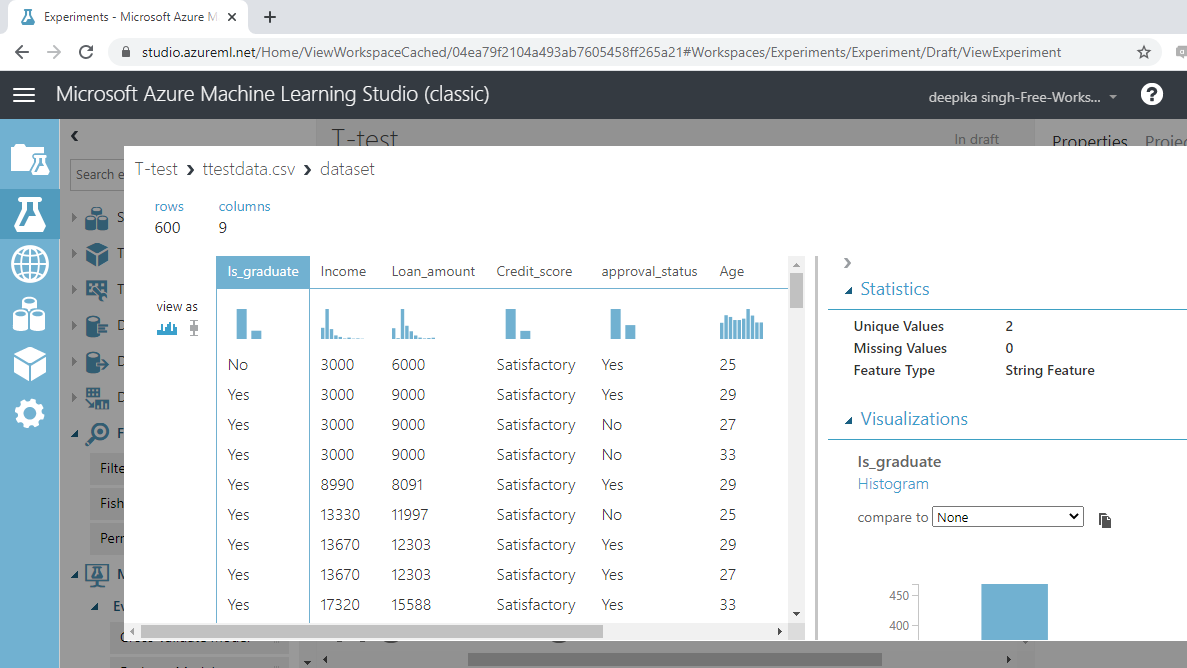
The data is loaded into the workspace and ready for statistical tests.
Key Terms
Before moving ahead to the statistical tests, you should understand a few important terms.
-
Mean: Mean represents the arithmetic average of the data. It is calculated by taking the sum of the values and dividing by the number of observations.
-
Null and Alternative Hypotheses : The statistical tests rely on testing a null hypothesis, which is specific for each case. The null hypothesis assumes the absence of a relationship between two or more variables. For example, for two groups, the null hypothesis assumes that there is no correlation or association between the two variables. The alternative hypothesis is simply the opposite of the null hypothesis.
-
t-test: In general, a t-test helps you compare whether two groups have the same or different means. It is also used to test if a single group mean is comparable to a hypothesized mean.
-
P-value: For any statistical test, the p-value is a statistic used to decide whether to reject or fail to reject the null hypothesis. The decision rule is that if the p-value for the test is less than 0.05, we reject the null hypothesis. If the p-value is greater than or equal to 0.05, we fail to reject the null hypothesis.
The following sections outline the implementation of a t-test in Azure Machine Learning Studio.
One-Sample T-test
The idea behind the one-sample t-test is to compare the mean of a vector against a theoretical mean. In our data, you will consider the Income variable and test the null hypothesis that the mean income of the applicants is USD $72,500. This can be any number based on your research.
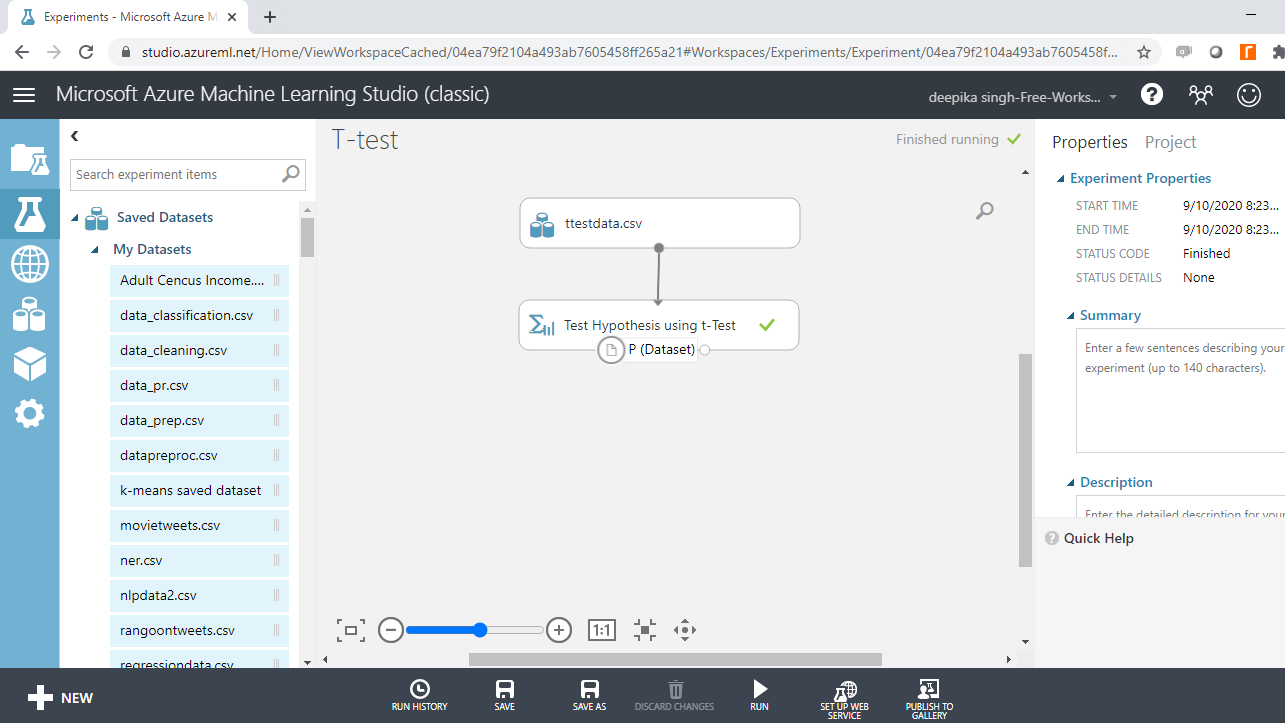
Drag and drop the Test Hypothesis using t-Test module into the workspace.
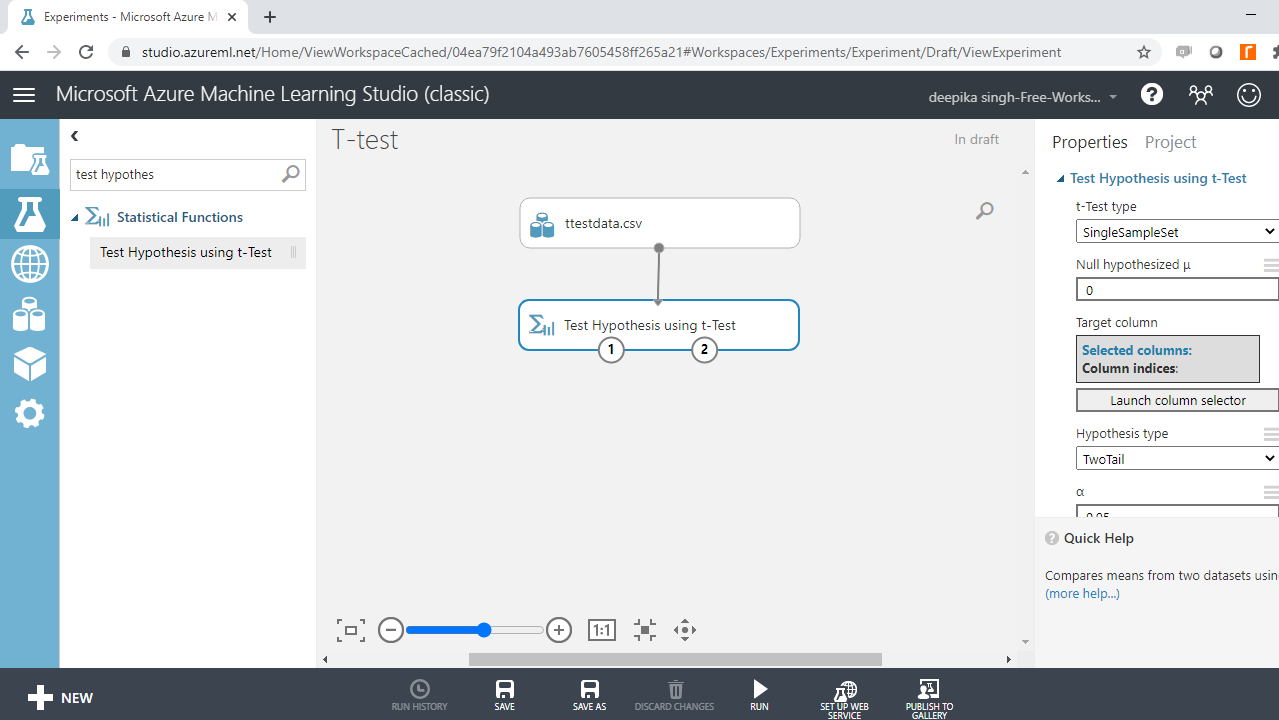
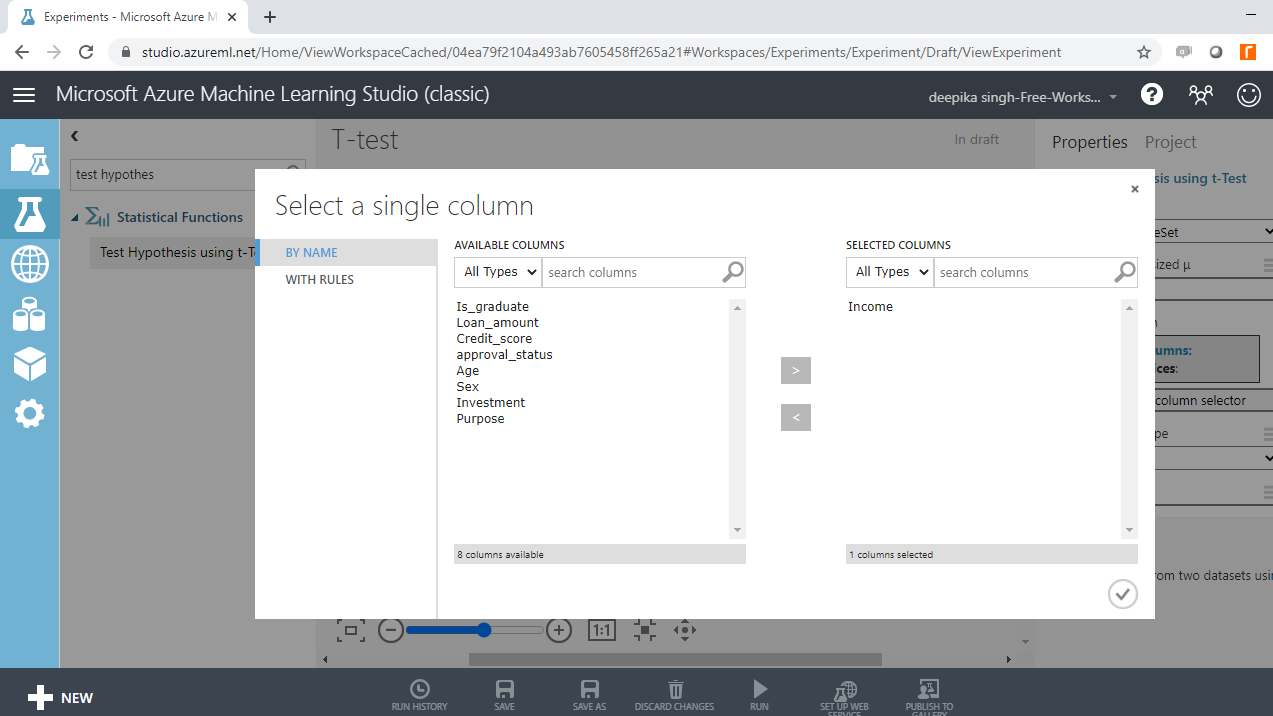
Click on the Launch column selector option and select the Income variable.
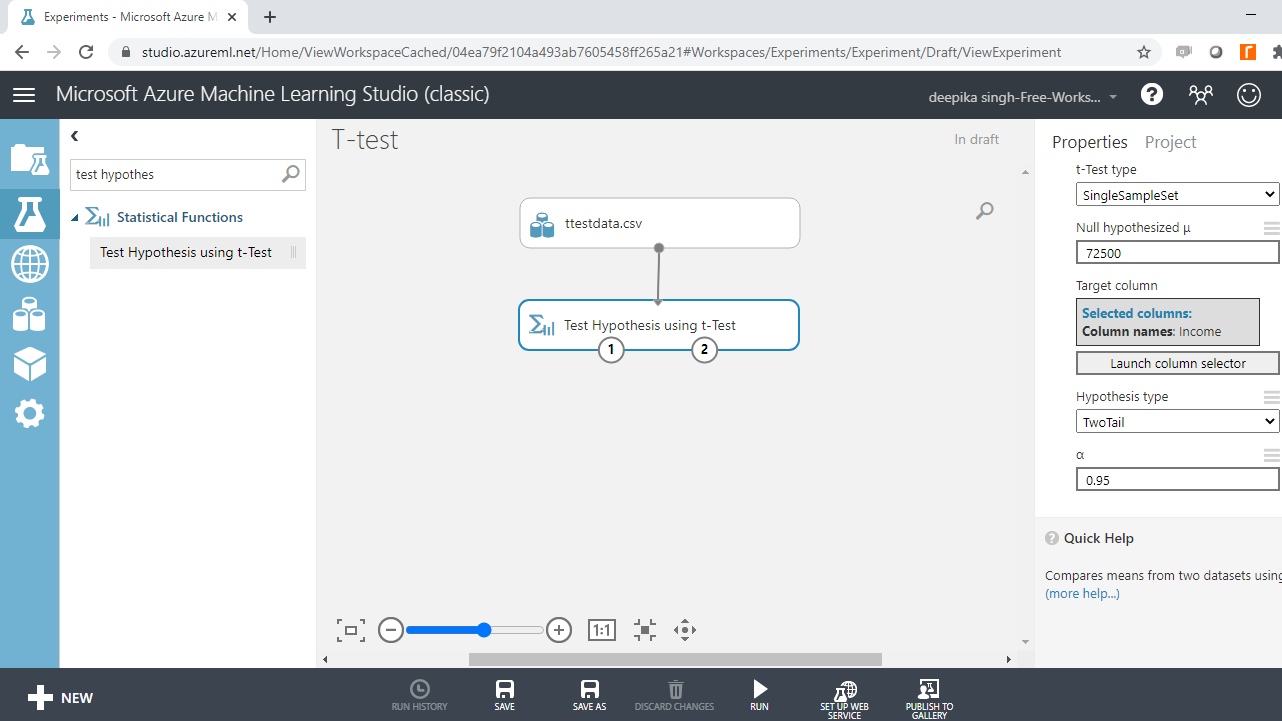
Next, complete the other arguments to configure the module. For t-Test type, select SingleSampleSet because you are considering one variable. For the option Null hypothesized µ, type the value of 72500. This specifies the expected mean income value against which the variable mean will be tested. Next, under Hypothesis type, select the default option of TwoTail. This is the most common type of test that assumes the distribution to be symmetric around zero. Alpha value, denoted by α, specifies the confidence factor. Set this value to 0.95.
Run the experiment. Once the module run is complete, the left output port of Test Hypothesis using t-Test module gives the probability score.
Right-click and select ** Visualize**.
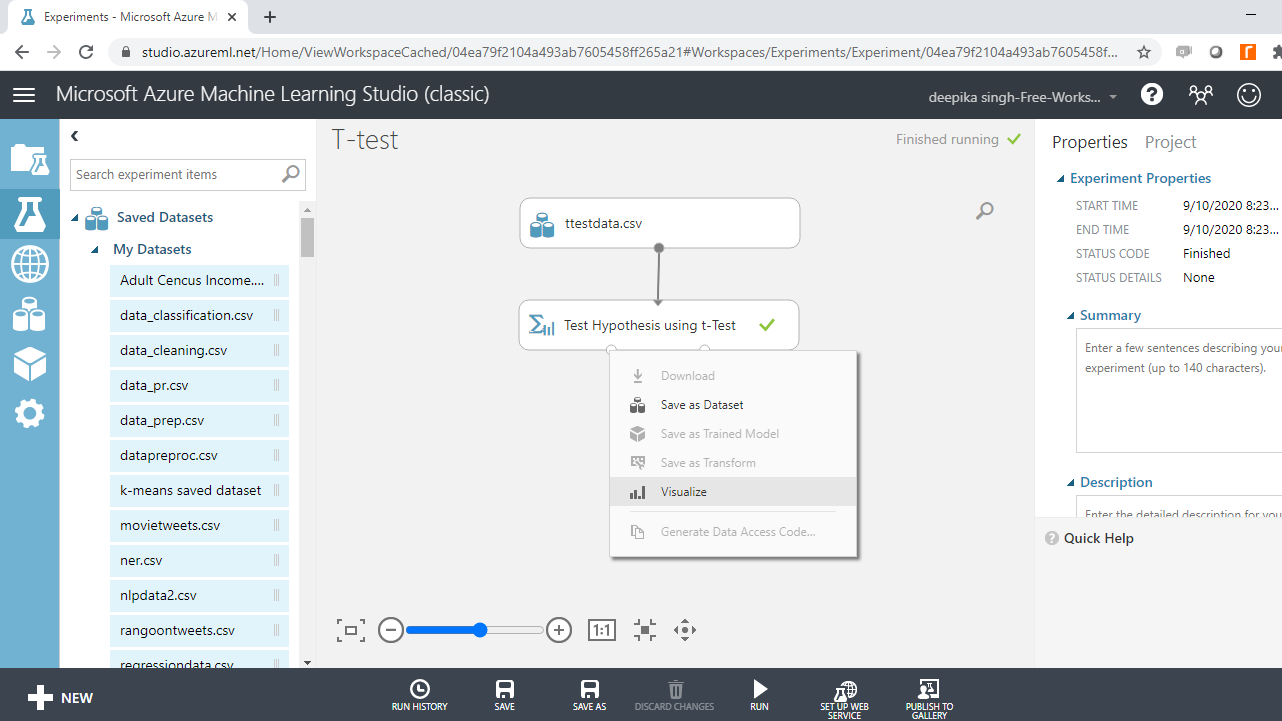
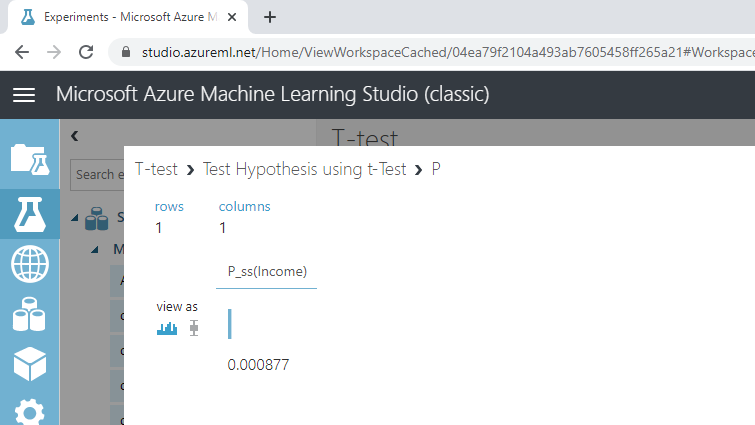
The output shows that the p-value is lower than 0.05, which means that the null hypothesis is rejected.
You can confirm this with the right output port of Test Hypothesis using t-Test module. Right-click and select Visualize.
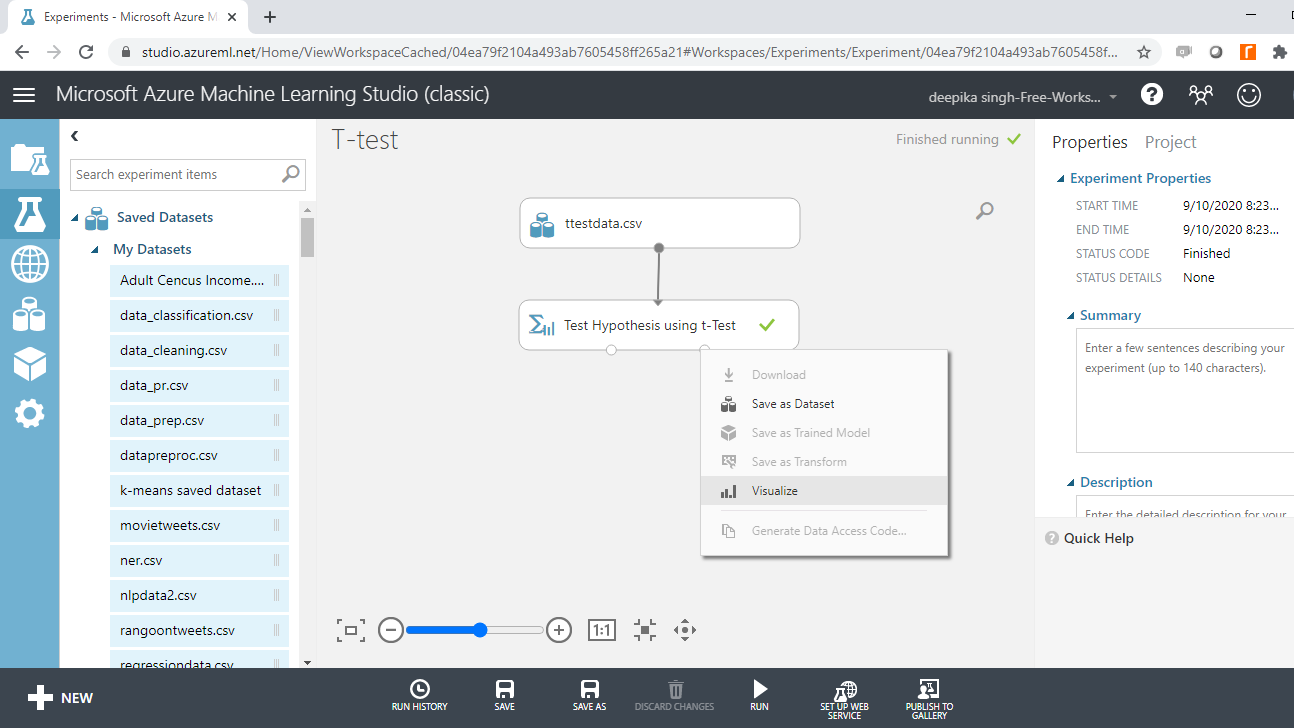
The output below shows that null hypothesis is to be rejected.
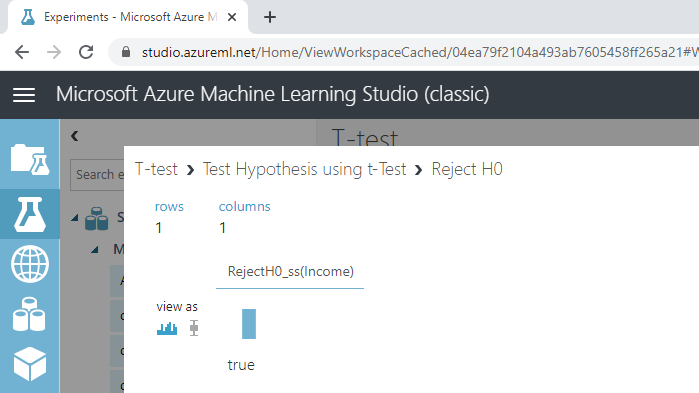
Based on the results of t-Test, you reject the null hypothesis that the mean income of the applicants is USD $72,500.
Paired-Sample T-test
The idea behind the paired-sample t-test is to compare the mean of two sets of samples from the same population. In this data, you will consider the variables Income and Loan_amount. The null hypothesis to be tested is that the difference between the expected means of the two variables is zero.
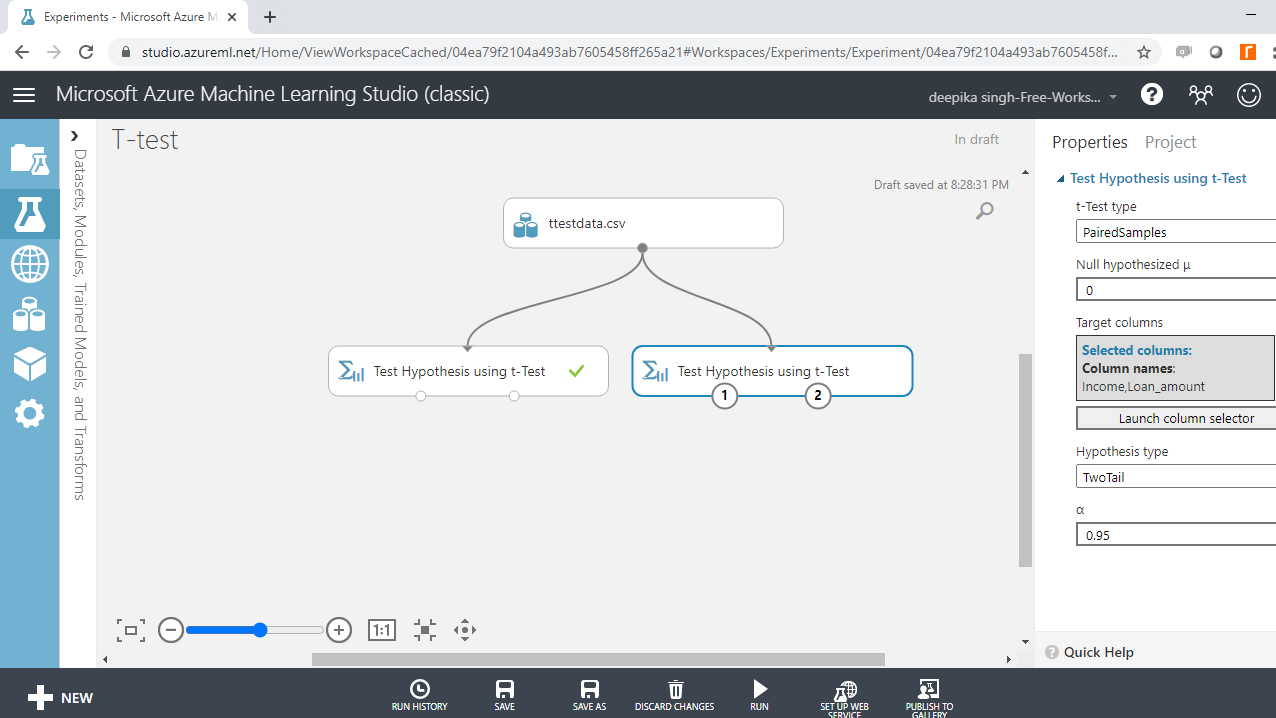
Drag and drop the Test Hypothesis using t-Test module into the workspace. To configure the module, click on the Launch column selector option and select the Income and Loan_amount variables.
Next, complete the other arguments. For t-Test type, select PairedSamples because you are considering two variables. For the option, Null hypothesized µ, type the value of zero. This specifies that the expected difference in the means of the two variables is zero. Set the other option as shown below.
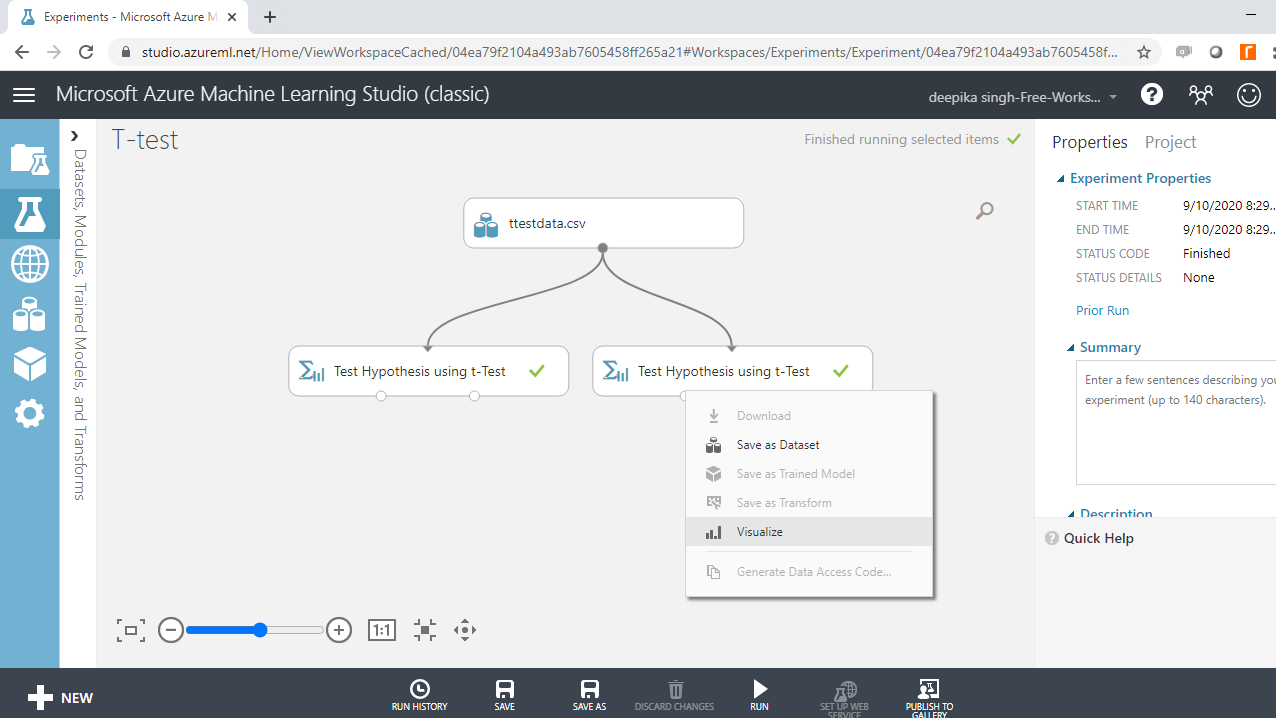
Run the experiment, and right-click on the left-input port to select Visualize.
The output shows that the p-value is lower than 0.05, which means that the null hypothesis is rejected.
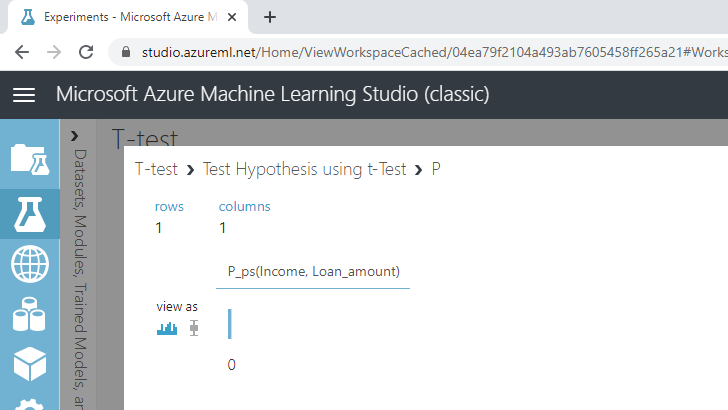
Next, right-click on the right-input port of the Test Hypothesis using t-Test module, and select Visualize. The output shows that the null hypothesis is to be rejected.
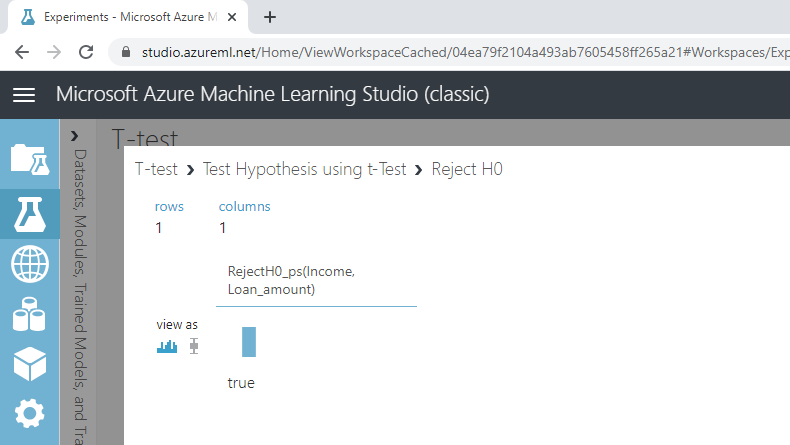
Based on the results of the t-test, you can reject the null hypothesis that the difference between the expected means of the variables Income and Loan_amount is zero.
Conclusion
Hypothesis testing has several applications in the areas of market research, quality testing, and inferential statistics. It is used in the pharmaceutical industry in new drug discovery. It is also used in the manufacturing industry to compare two processes or machines. Hypothesis testing using t-tests is also used in diagnostic analytics, an important area of machine learning.
In this guide, you learned how to perform hypothesis testing using t-tests in Azure Machine Learning Studio. You can learn more about this concept with this guide on R.
To learn more about data science and machine learning using Azure Machine Learning Studio, please refer to the following guides:
Advance your tech skills today
Access courses on AI, cloud, data, security, and more—all led by industry experts.
