Implementing Hierarchical Axis and Concatenation in Power BI
Nov 19, 2020 • 6 Minute Read
Introduction
When you are working with data that has hierarchy, you will be required to add the hierarchical dimension to your business intelligence reports. For example, time series data will have hierarchy of year, quarter, month, day etc. In such cases, you will either concatenate the x-axis or drill down at different hierarchical levels, depending on the business requirement and visualization impact. This is also required in exploratory data analysis. This guide will demonstrate how to implement hierarchical axis and concatenation in Power BI Desktop.
Data
In this guide, you will work with a fictitious data set of bank loan disbursal across years. The data contains 3,000 observations and 17 variables. You can download the dataset from here. The variables to be used in this guide are described below:
-
Loan_disbursed: Loan amount (in US dollars) disbursed by the bank.
-
Date: Date of loan disbursal.
Start by loading the data.
Loading Data
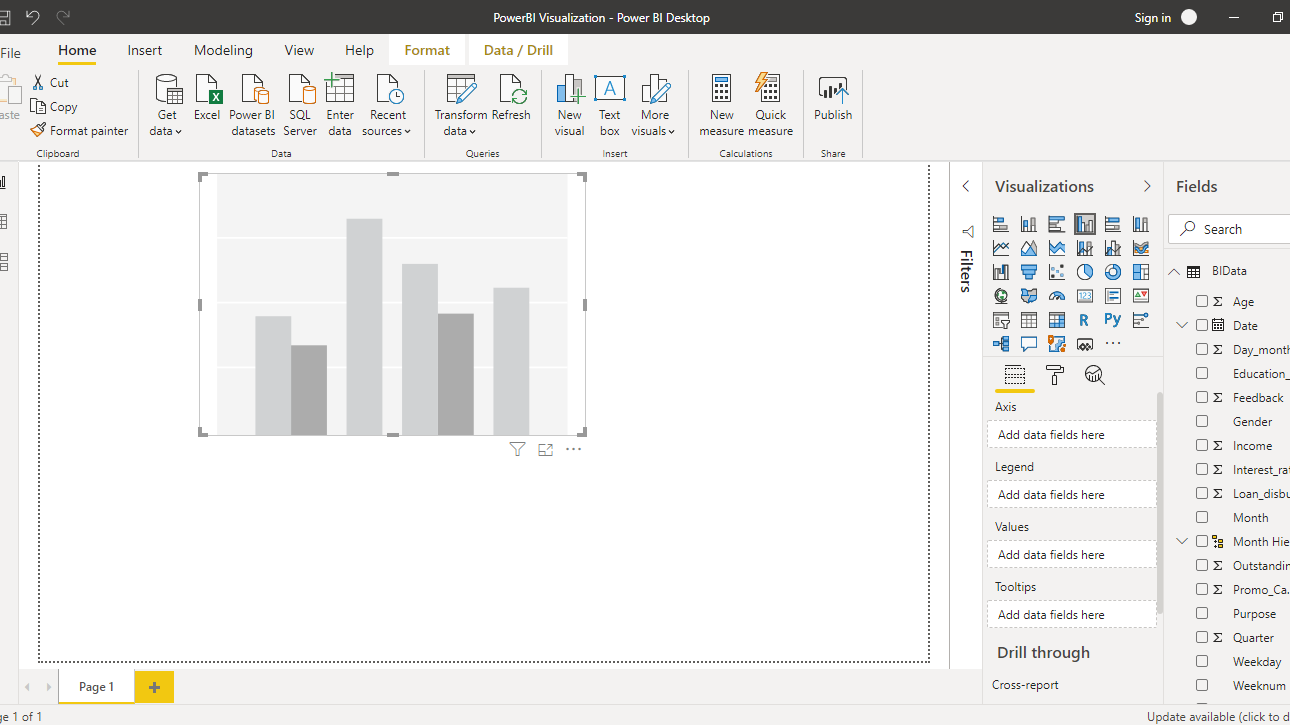
Once you open the Power BI Desktop, the following output is displayed.
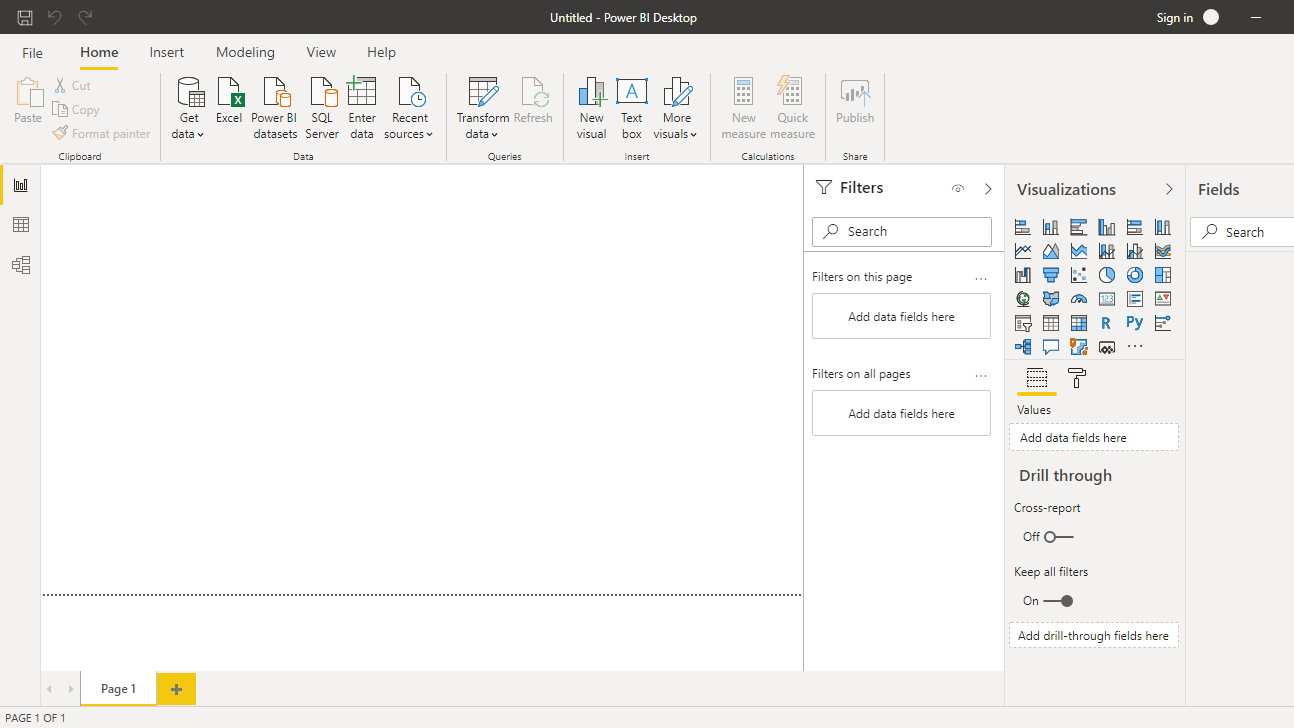
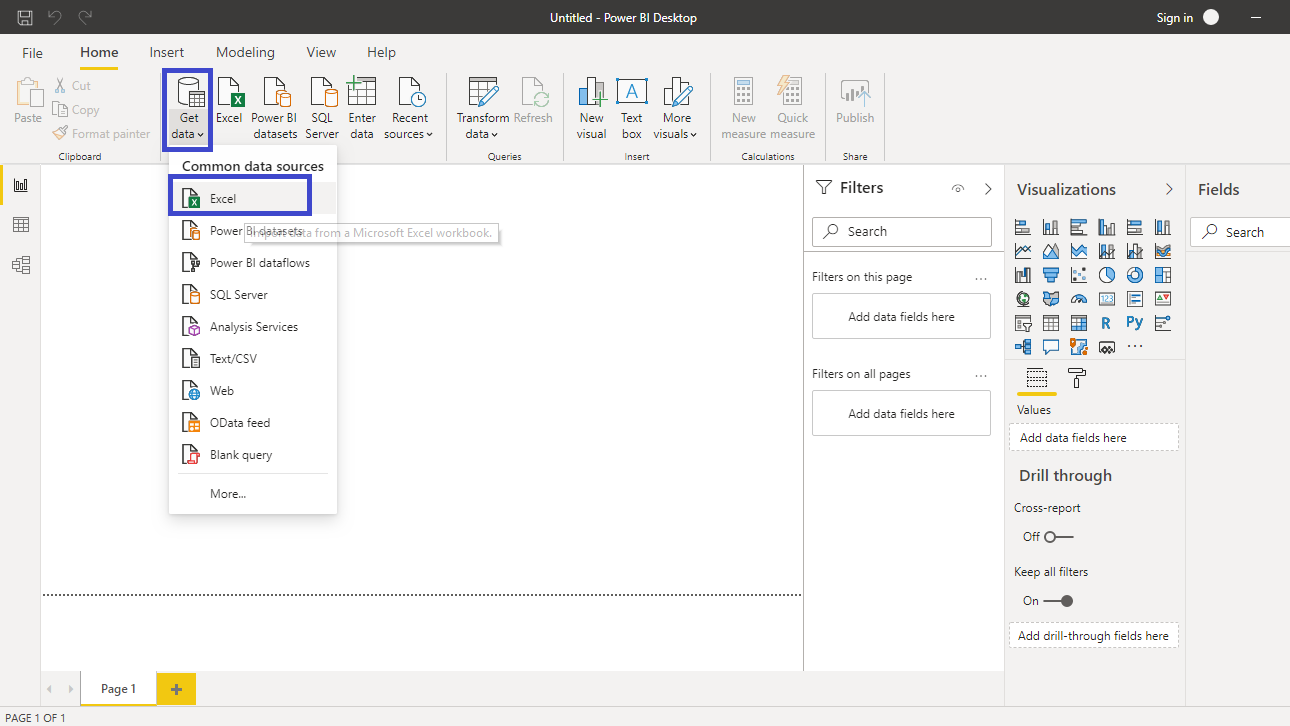
Click on Get data option and select Excel from the options.
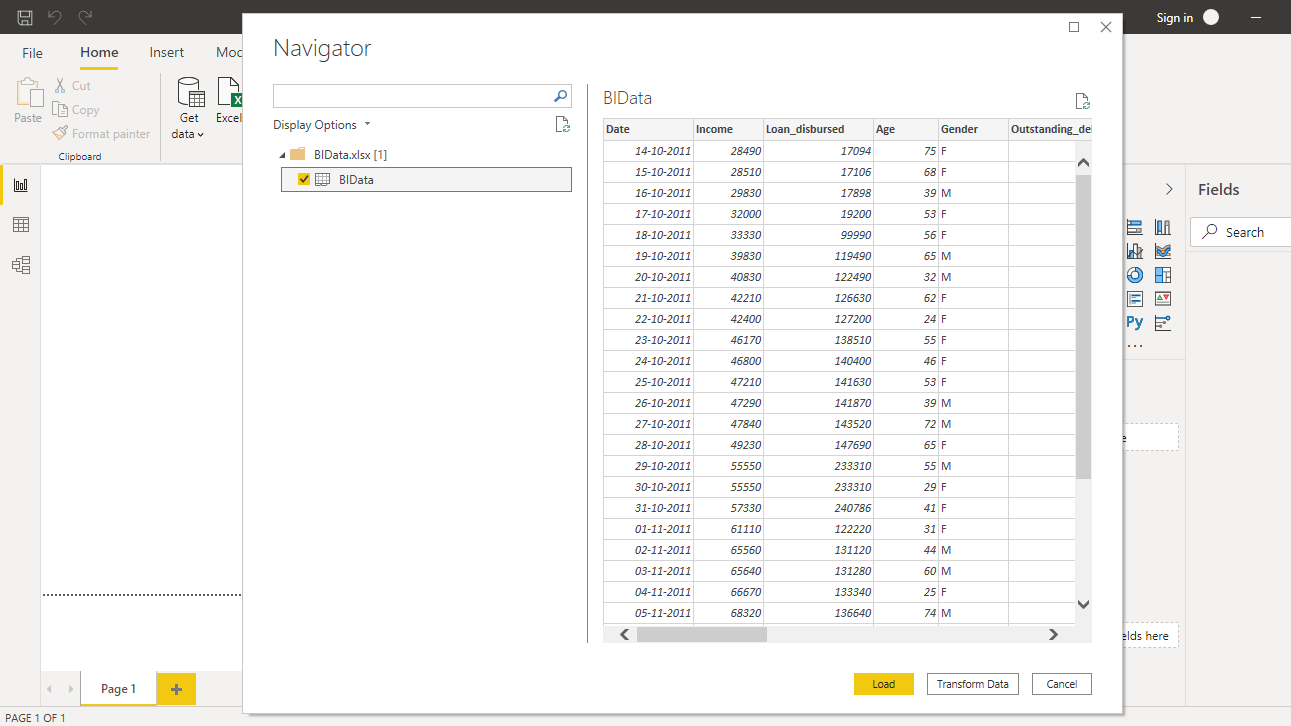
Browse to the location of the file and select it. The name of the file is BIdata.xlsx, and the sheet you will load is BIData sheet. The preview of the data is shown, and once you are satisfied that you are loading the right file, click Load.
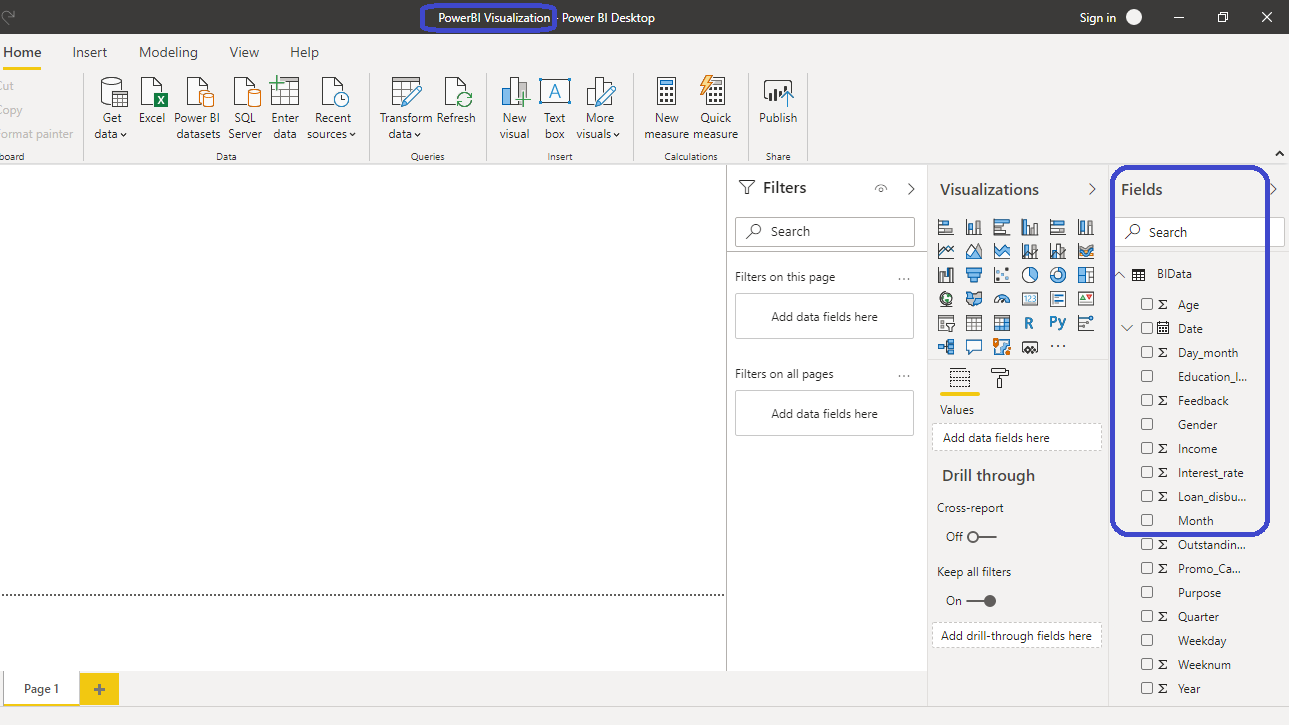
Once you have loaded the file, you can save the dashboard. It is named PowerBI Visualization. The Fields pane contains the variables of the data.
Adding Visualization
To begin, you will need a chart, table, or matrix. You will create a clustered column chart in this guide. You can locate it in the Visualizations pane.

Click on the chart shown above, and it will create a chart box in the canvas. Nothing is displayed because you haven't yet added the required visualization arguments.
You can resize the chart on the canvas. The next step is to fill the visualization arguments under the Fields option as shown below. Drag the variable Date into the Axis field, and Loan_disbursed in the Values field.
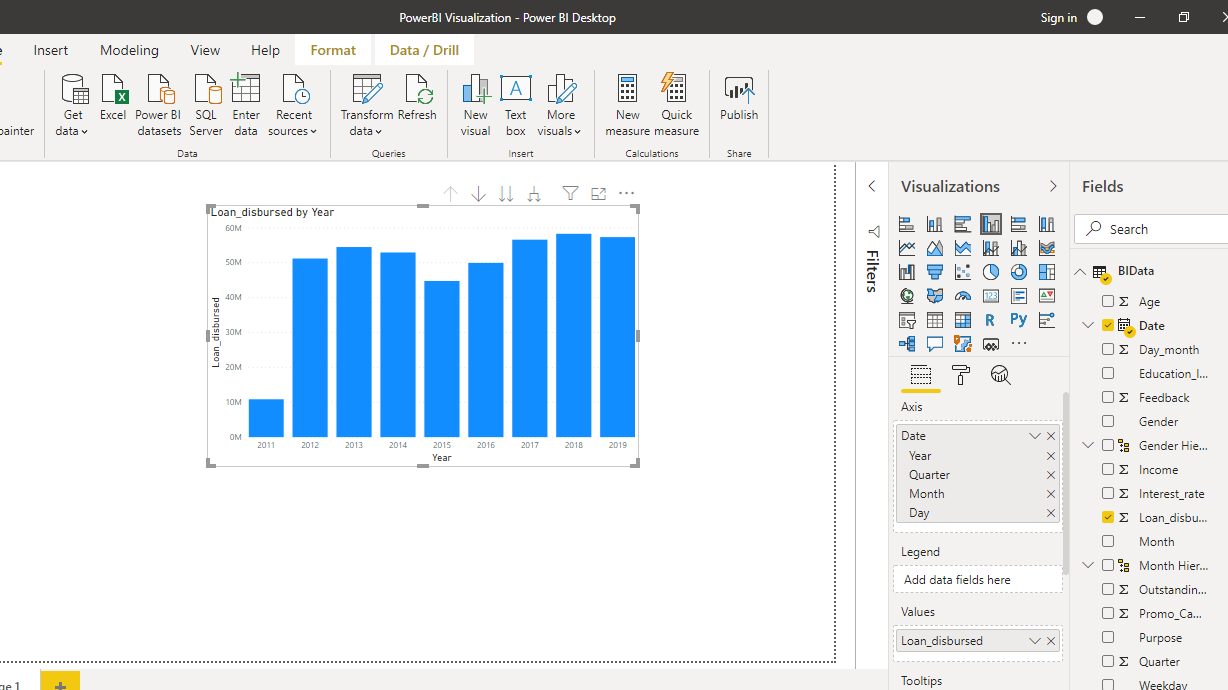
The output above shows that the required chart is created, and the next step is to explore the concatenation and hierarchical axis options in Power BI.
Concatenation
Once you have a chart selected, start drilling down using the Expand all down one level.. option present at top of the chart, as shown below. If you click it once, the visual that was displayed in years will now be displayed in a quarter/year combination.
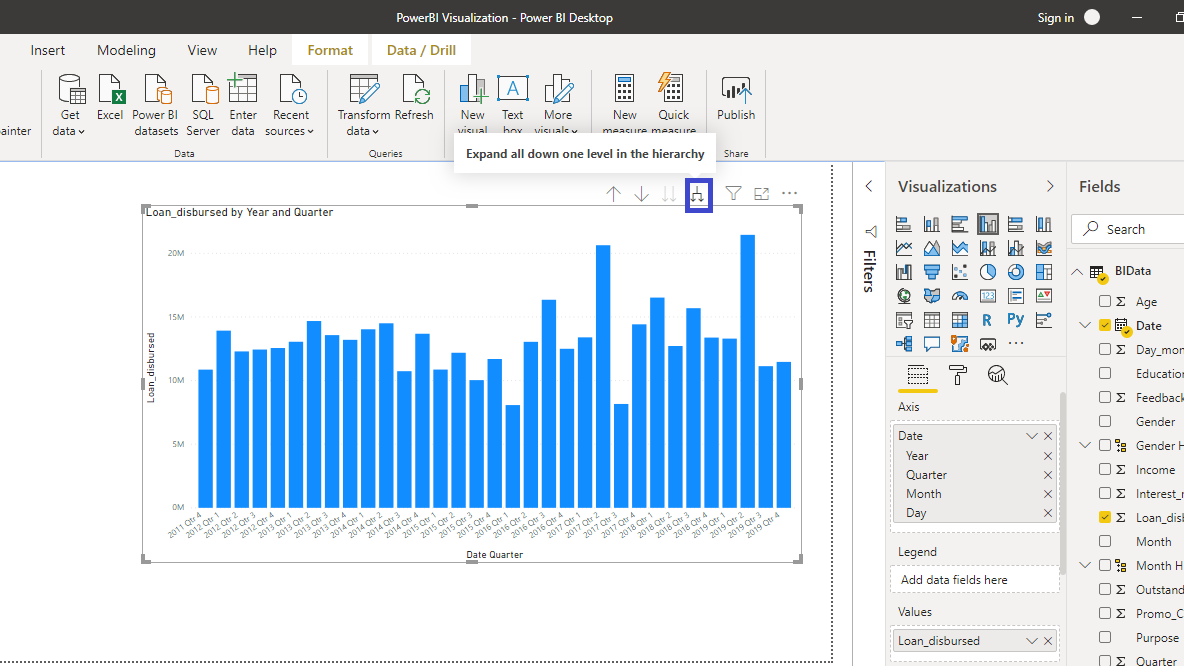
You can see that the title of the chart is automatically updated to Loan_disbursed by Year and Quarter. You can drill down further to the month level.

The output above represents the column chart of Loan_disbursed by Year, Quarter and Month. It becomes difficult to interpret the chart as you start to drill down and concatenate the levels together. To overcome this limitation, you can access the hierarchy view to your chart instead of this concatenation effect .
Hierarchical Axis
To begin, go into the Format pane, and then to the X axis option.

Under the X axis option, you will see the option called Concatenate labels.
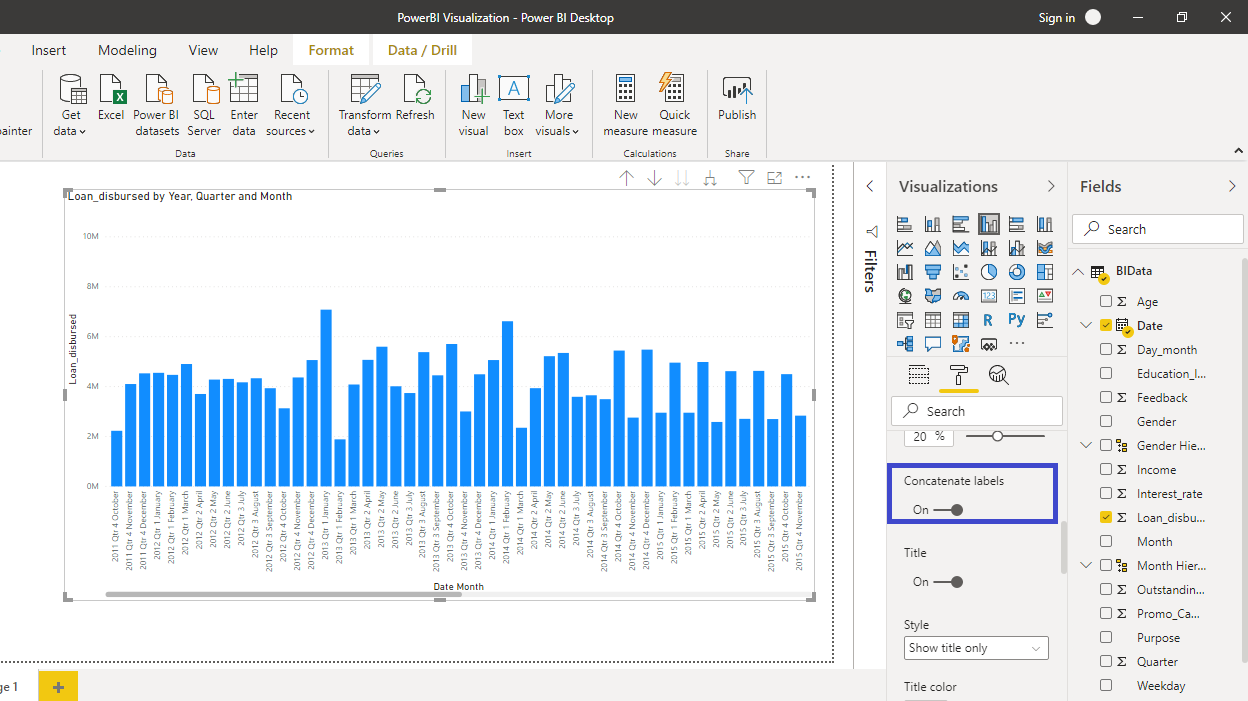
Turn off the Concatenate labels option. Once you complete this step, you will see a nice hierarchy that is created. The year, quarter, and month are now properly arranged.

You can improve the view further by increasing the Text size. Set the value to 12.

The output is now more interpretable than before. You can use the hover tool as shown below to scroll from left to right.

Conclusion
Business intelligence reporting often deals with hierarchical data. It can be a date-level hierarchy as you saw in this data or it can be a location, product, or inventory-level hierarchy. In such circumstances, concatenated labels and hierarchical axis representation becomes useful to drill down at the desired hierarchy. This also helps in descriptive and diagnostic analytics. This a common task in sectors like retail and domain like time series where you have hierarchies across category and time stamps. This skill will improve your analytics and business intelligence capabilities.
To learn more about building powerful visualization in Power BI desktop, please refer to the following guides:
Advance your tech skills today
Access courses on AI, cloud, data, security, and more—all led by industry experts.
