Maps Made Easy with D3
May 27, 2020 • 8 Minute Read
Introduction
D3 is a powerful and flexible visualization library for JavaScript, and its visualizations are not limited to bar charts and pie graphs. Geospatial data is usually represented on a map. D3 provides a complete API for generating, displaying, and interacting with geospatial data in online visualizations. This guide will explain how to render online maps using D3.
The Ingredients
To work with maps in D3, you need to learn about three ideas:
- GeoJSON
- Projections
- Generators
If you've been working with D3, you've come across generators to make shapes. It turns out that the generators used by D3 are shape generators. They are a special kind of shape generator that coverts GeoJSON data into SVG shapes. But what is GeoJSON?
GeoJSON
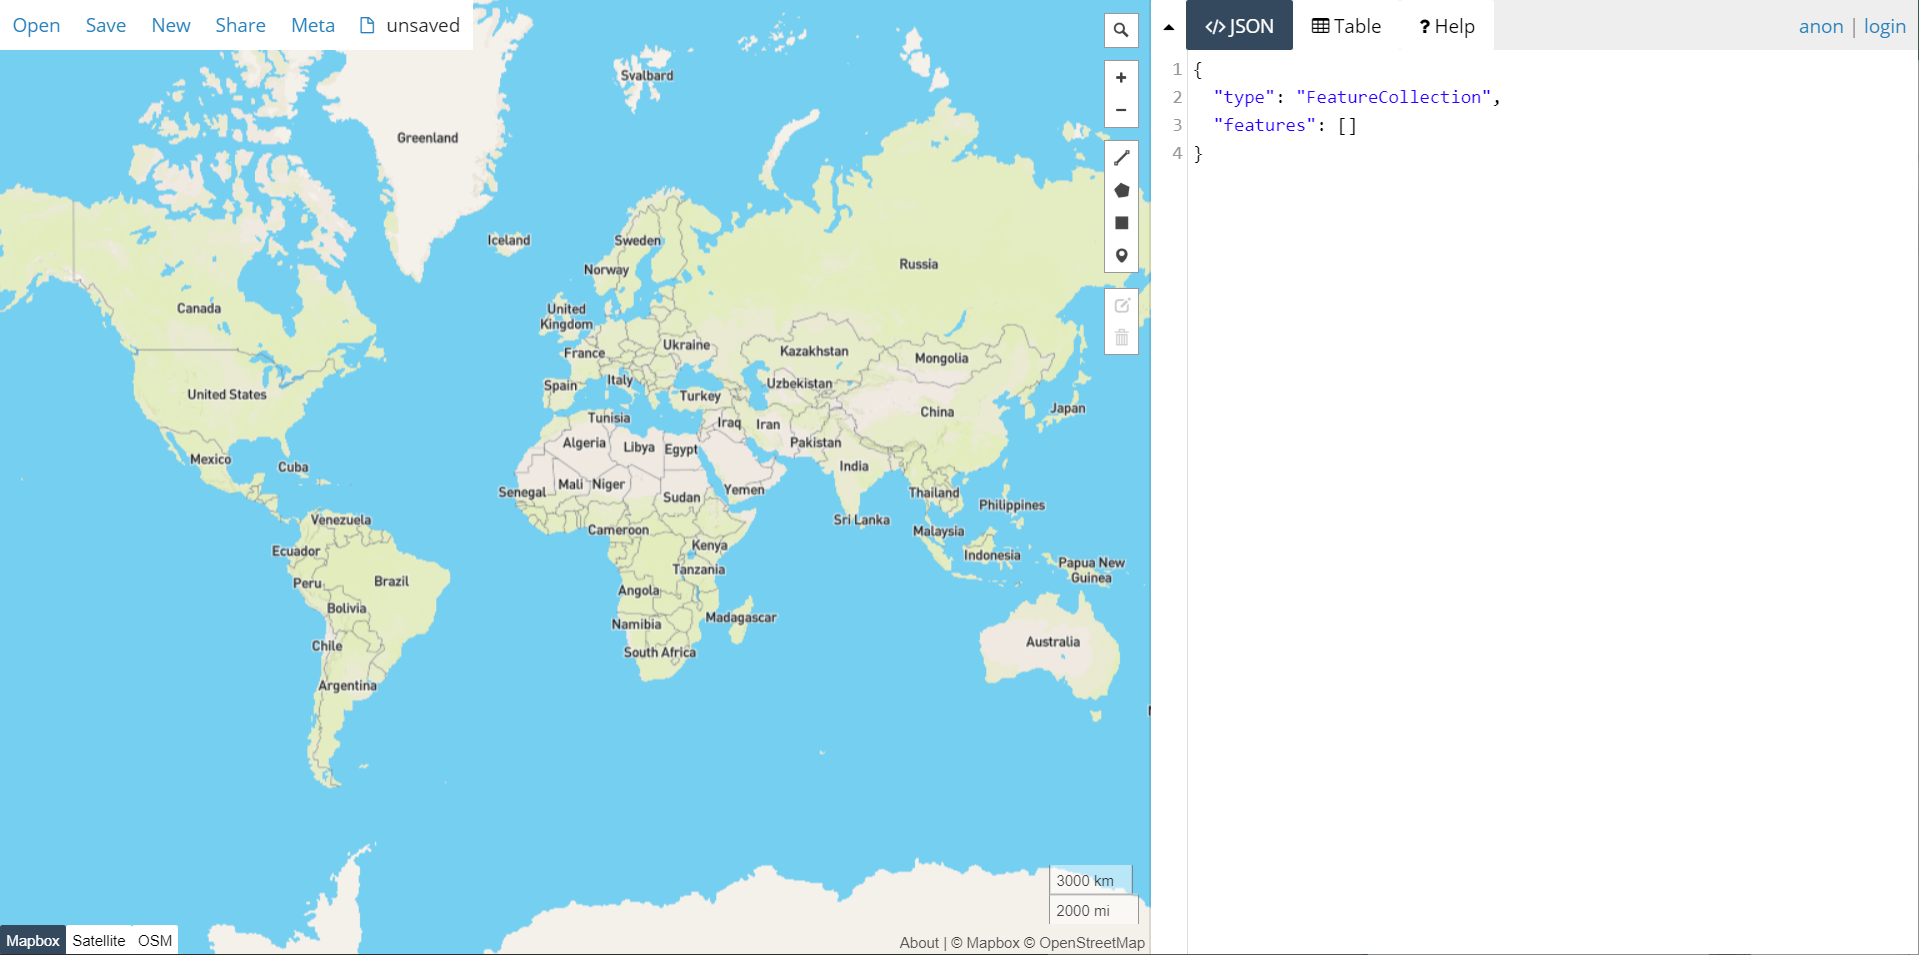
You probably know what JSON is. And you probably have an idea about what 'Geo' implies. So it should come as no surprise that GeoJSON is a standard for representing geographical data in JSON. And from GeoJSON, D3 can create shapes that represent maps. There are lots of places to get GeoJSON data. One of the simplest is to generate it yourself at https://geojson.io.
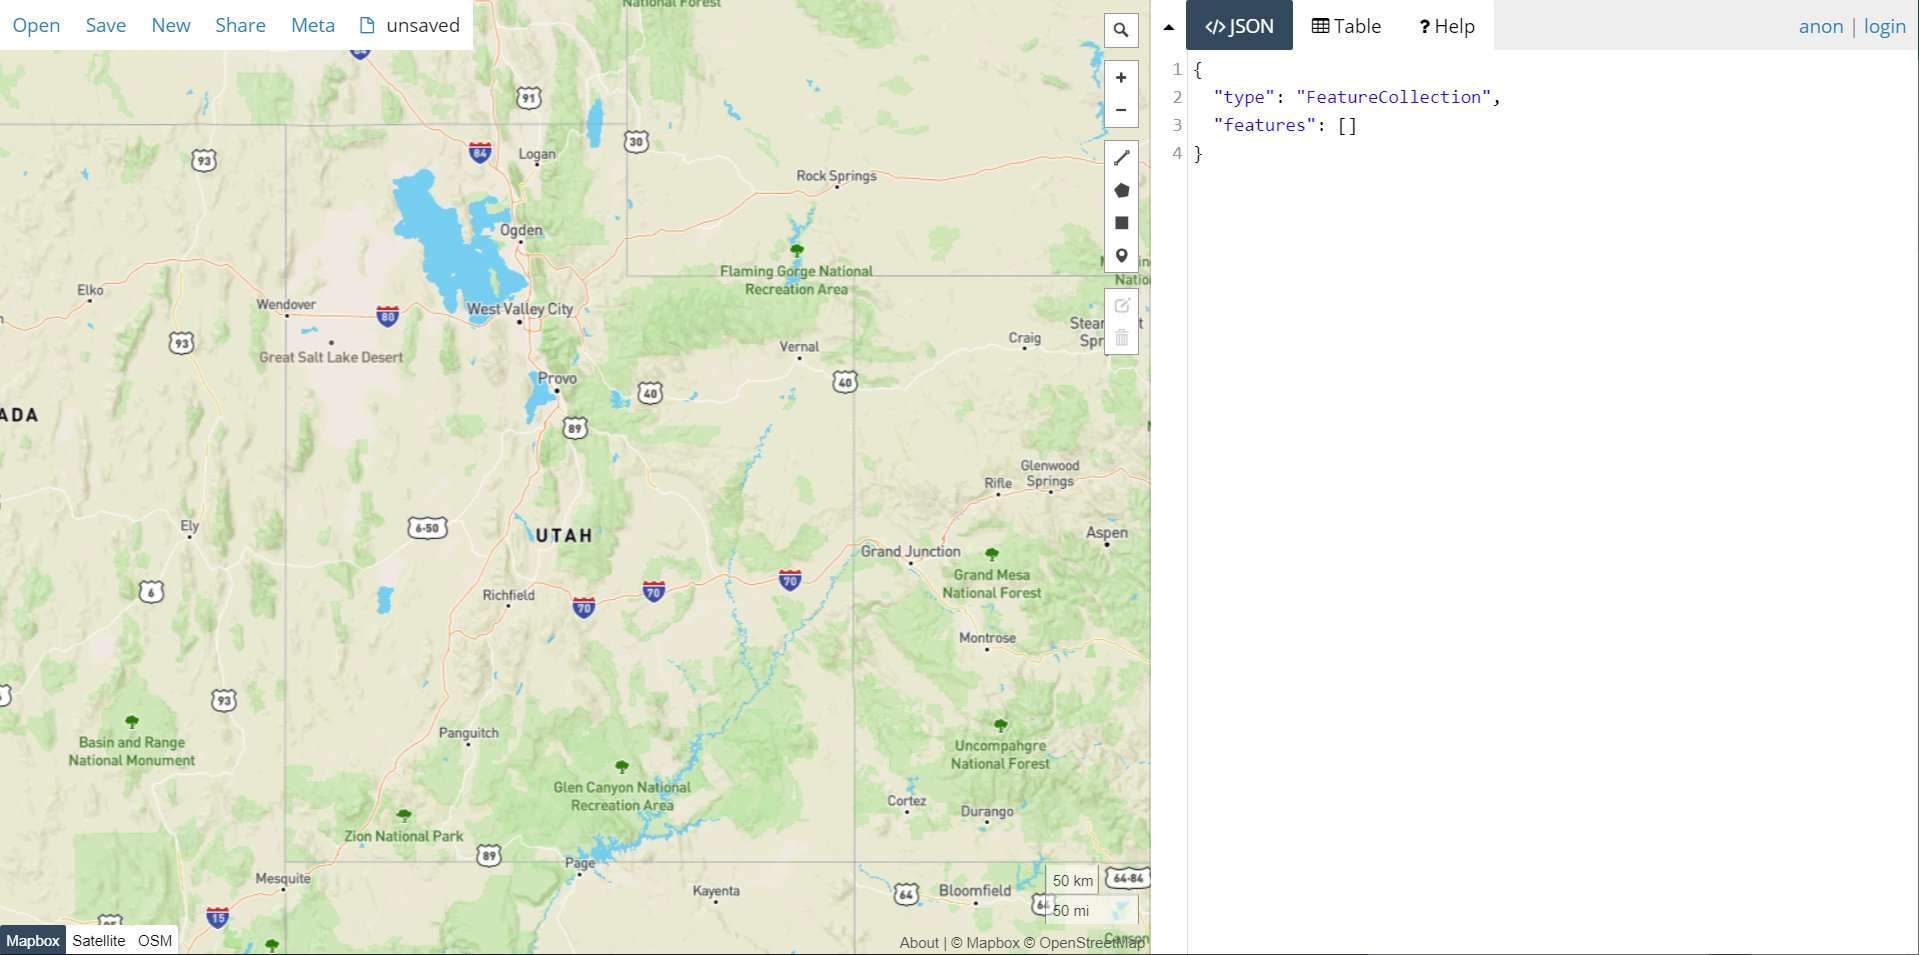
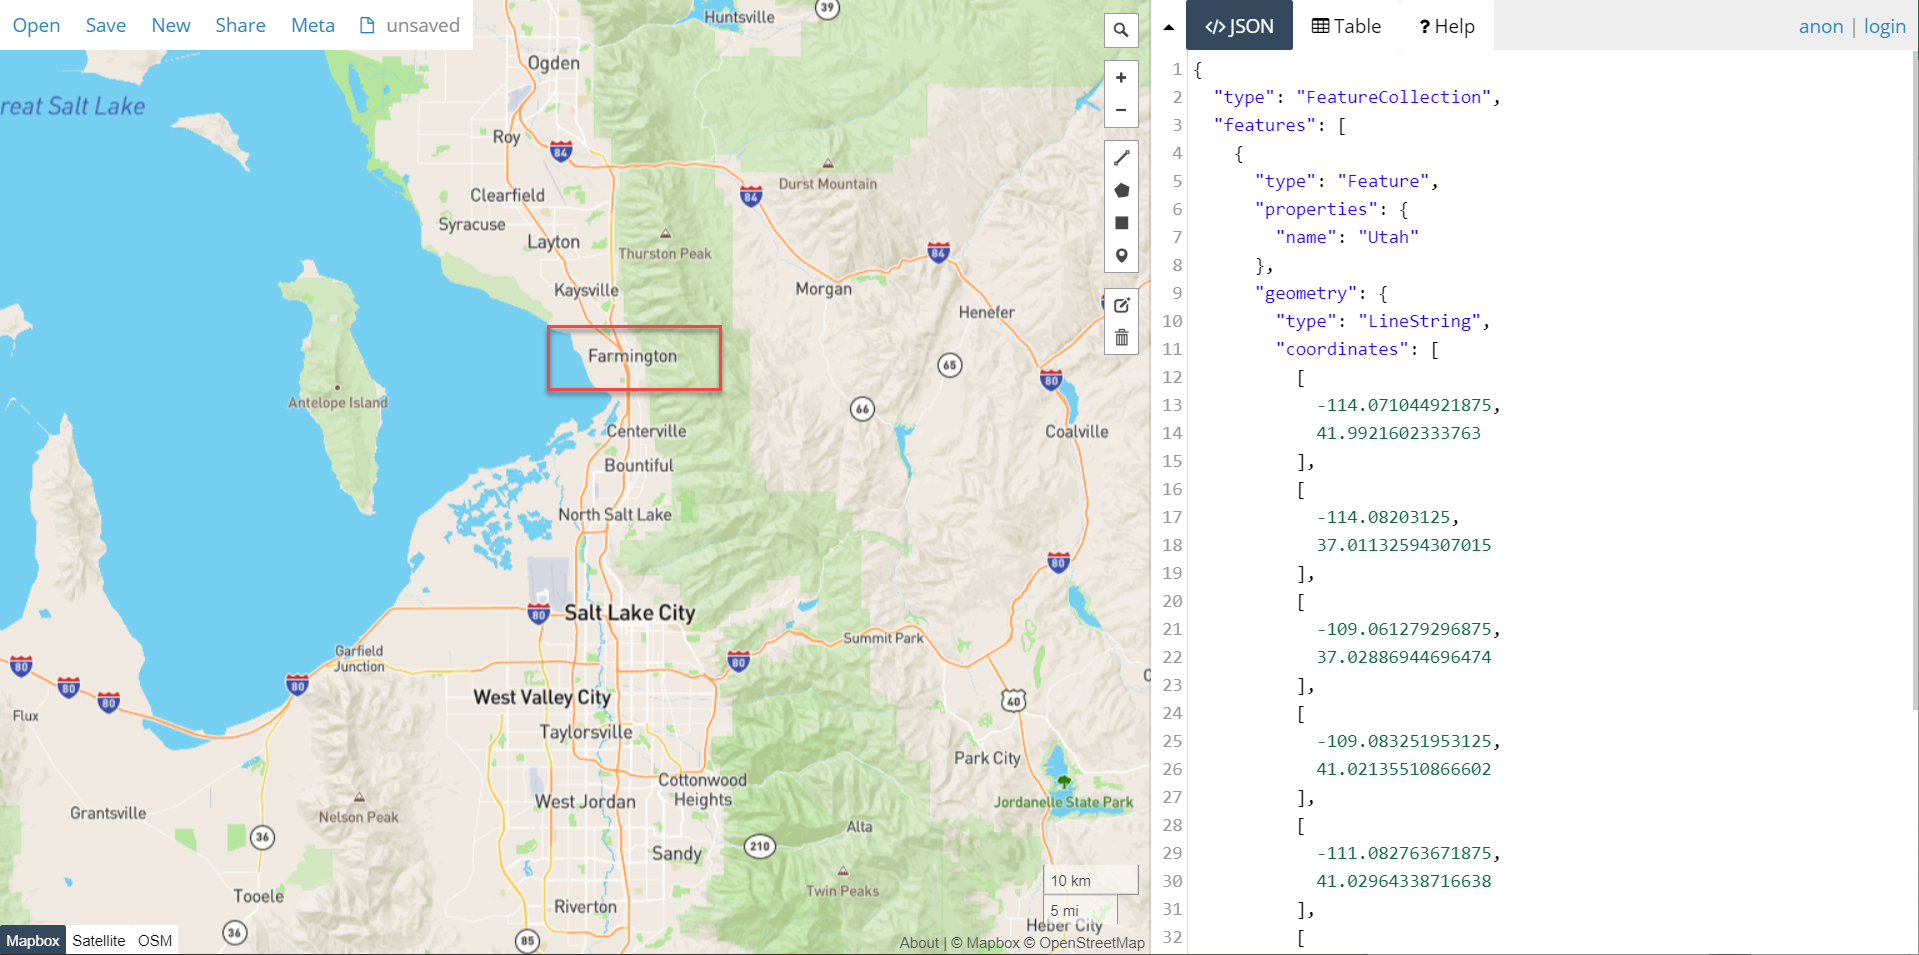
This straightforward interface lets you generate GeoJSON data from shapes drawn on top of a map. To demonstrate, zoom in on the state of Utah in the United States.
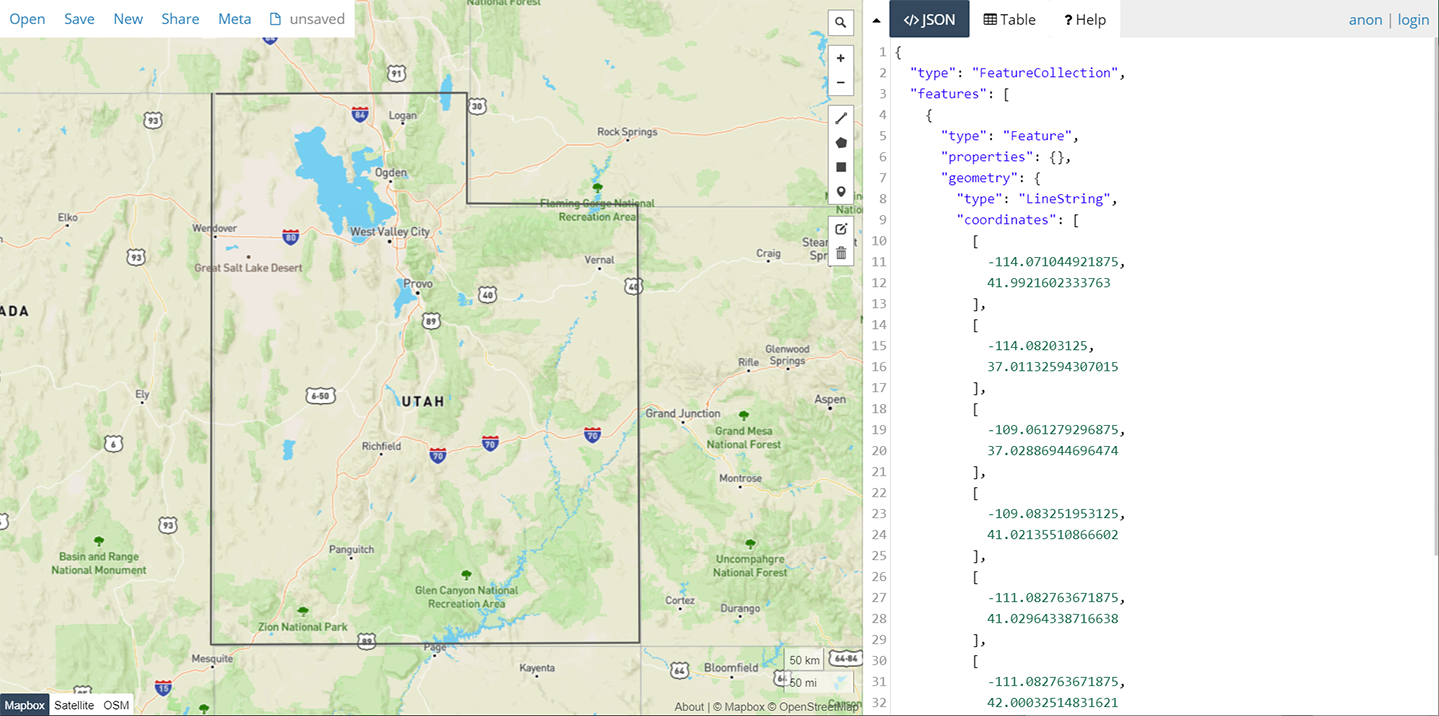
I picked Utah for two reasons. First, it is the home state of Pluralsight, and second, its borders are straight lines, making it easy to draw. Now, using the line tool, draw the outline of the state. To complete the shape, click again on the first point. In the image below, I started on the top left corner and went counter-clockwise.
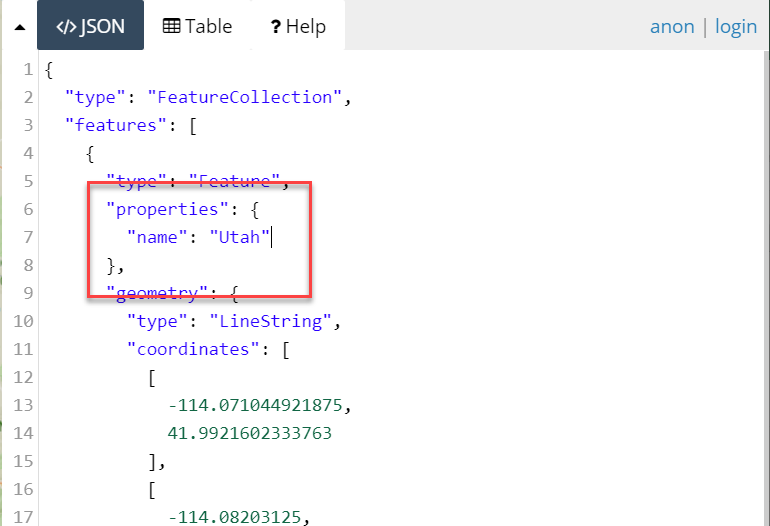
The completed line in called a feature and is stored in the features array in the GeoJSON. As you draw the lines, the coordinates are stored in the GeoJSON in the coordinates key for the feature. In the properties key, you can add metadata for the feature, such as a name.
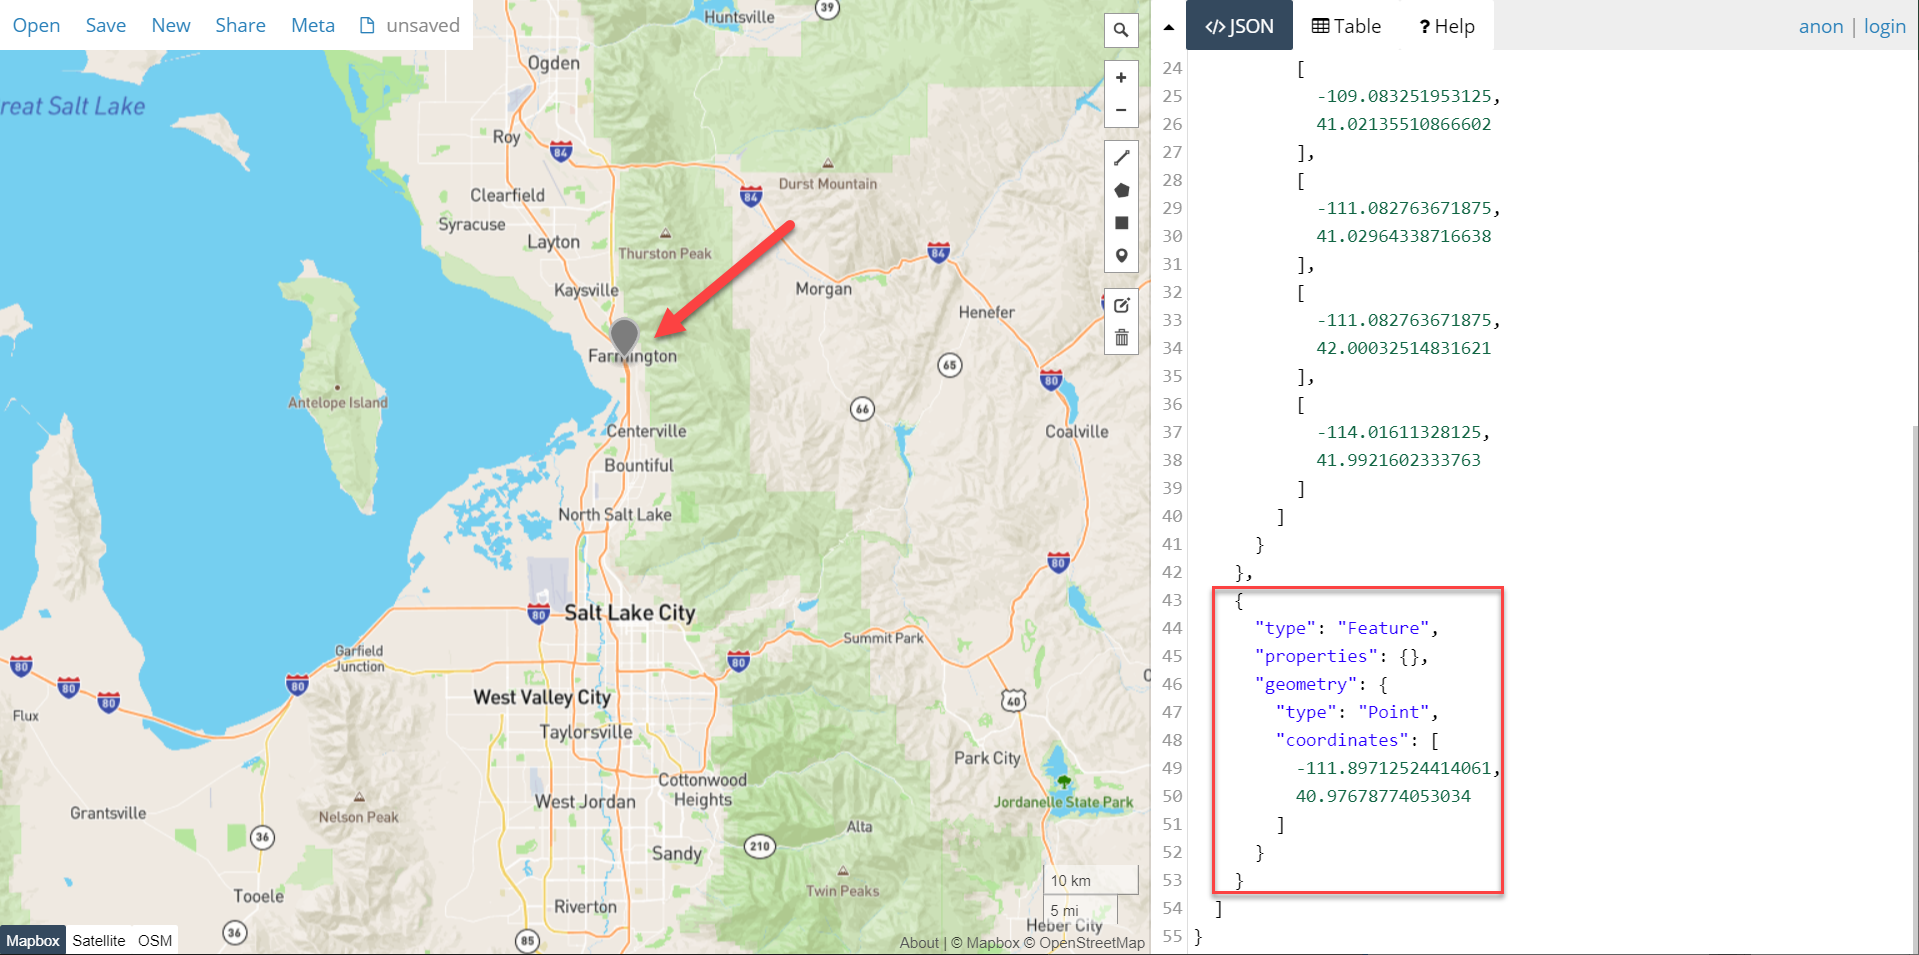
Pluralsight is located in Farmington, Utah, just north of Salt Lake City. Zoom in to Salt Lake City (just southeast of the Great Salt Lake). You'll see Farmington on Interstate 15.
Use the marker tool to place a marker on Farmington and add another feature to the GeoJSON.
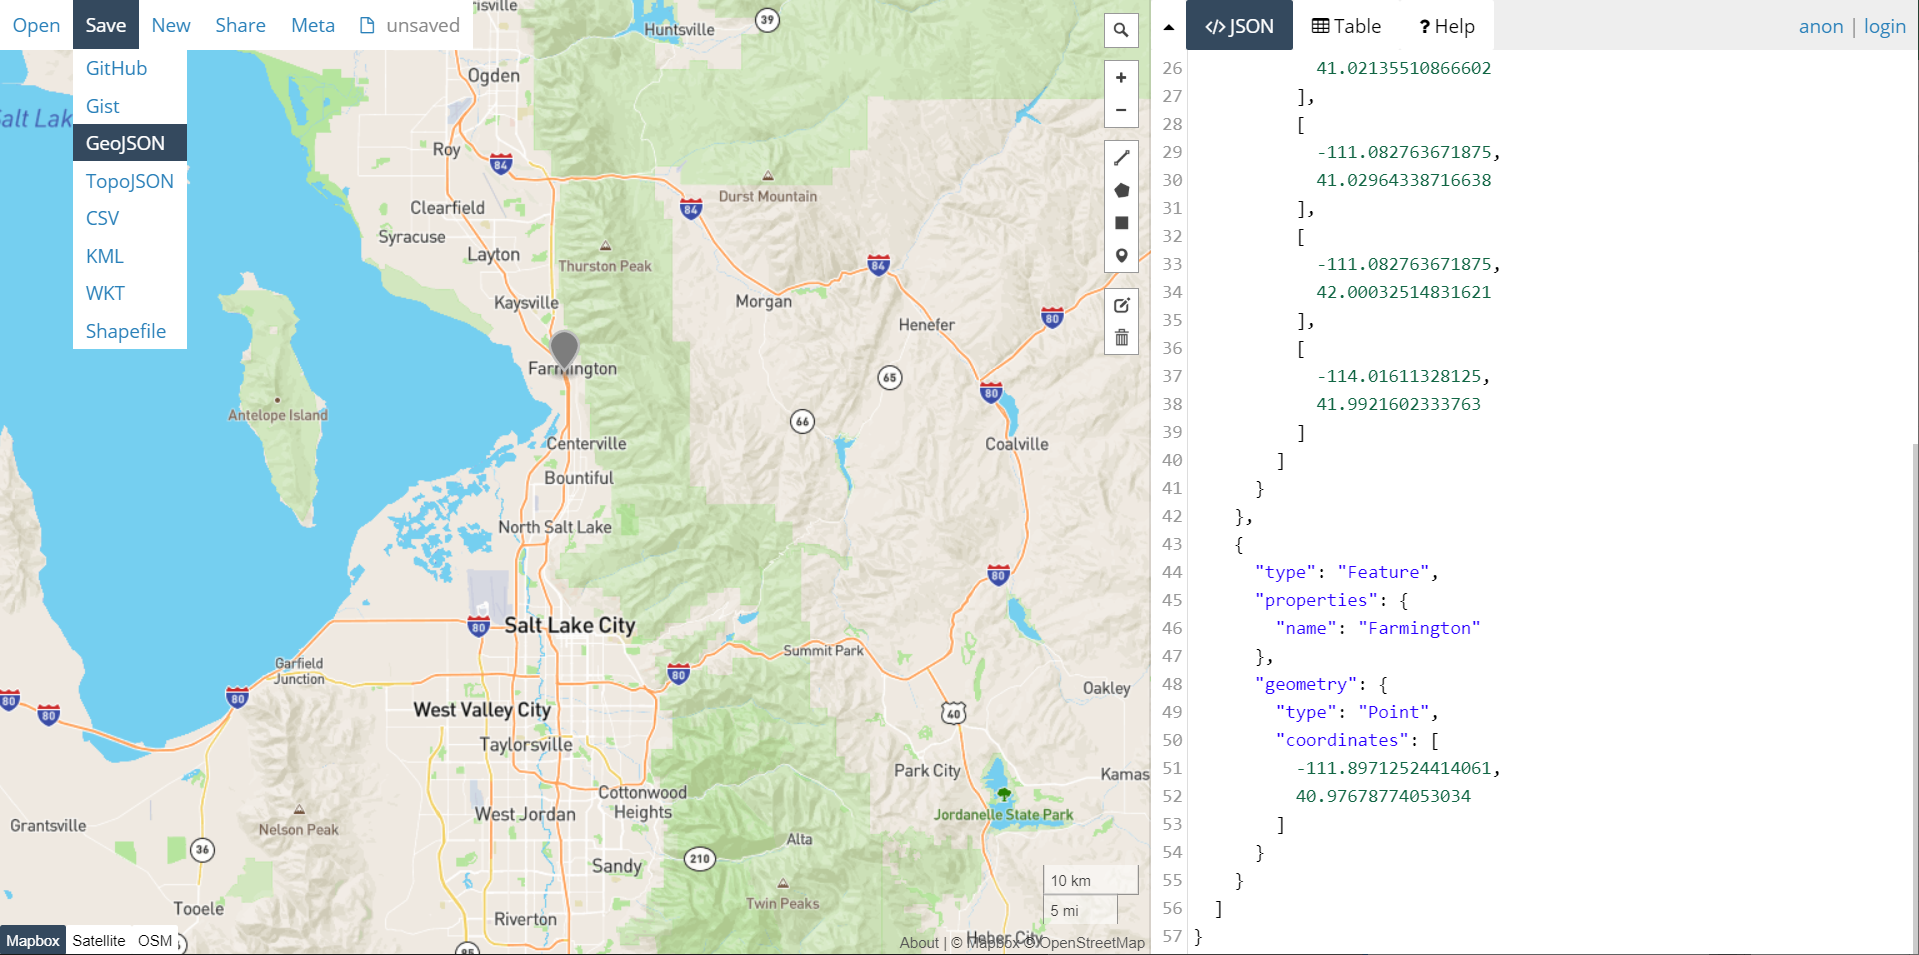
After adding a name indentifying the new feature, save the GeoJSON to a file.
Projections
A projection is a function that takes the latitude and longitude coordinates in the GeoJSON file and converts them into x-y coordinates that D3 can use to draw shapes. If this sounds difficult, that's because it is, but D3 provides a number of functions to do the projections for you.
For example, the Mercator projection is often used for maps because a constant path is always a straight line. Here is what the GeoJSON for Utah looks like with a Mercator projection.
The projection function is available in the d3 npm package.
      import * as d3 from 'd3';

let projection = d3.geoMercator();
If you switch to the equal conic projection, the shape is distorted. But the relative area between features is constant.
The code to create it is similar to the previous sample.
let projection = d3.geoConicEqualArea();
There are a large number of projections in D3. A complete list is available from the documentation online.
Generators
The generator will use the features in the GeoJSON to create shapes based on the projection.
      d3.json("../data/utah.geojson").then(geodata => {
  let projection = d3.geoConicEqualArea()
    .fitSize([360, 480], geodata);
  let generator = d3.geoPath().projection(projection);
  d3.select("g.map")
    .selectAll("path")
    .data(geodata.features)
    .join("path")
    .attr("d", generator)
    .attr('stroke', '#000')
    .attr('fill', '#fff')
});
This code generates the previous sample. The GeoJSON data is read with the json function. It is also used to adjust the the geometry of a projection so that it will fit in a certain area. The generator is created with the geoPath method and the projection is applied to it. Then you can have D3 create the map by selecting an element, passing the features from the GeoJSON, and using the generator to supply the coordinates of the point to the d attribute. The fill and stroke attributes are cosmetic.
Hit Testing
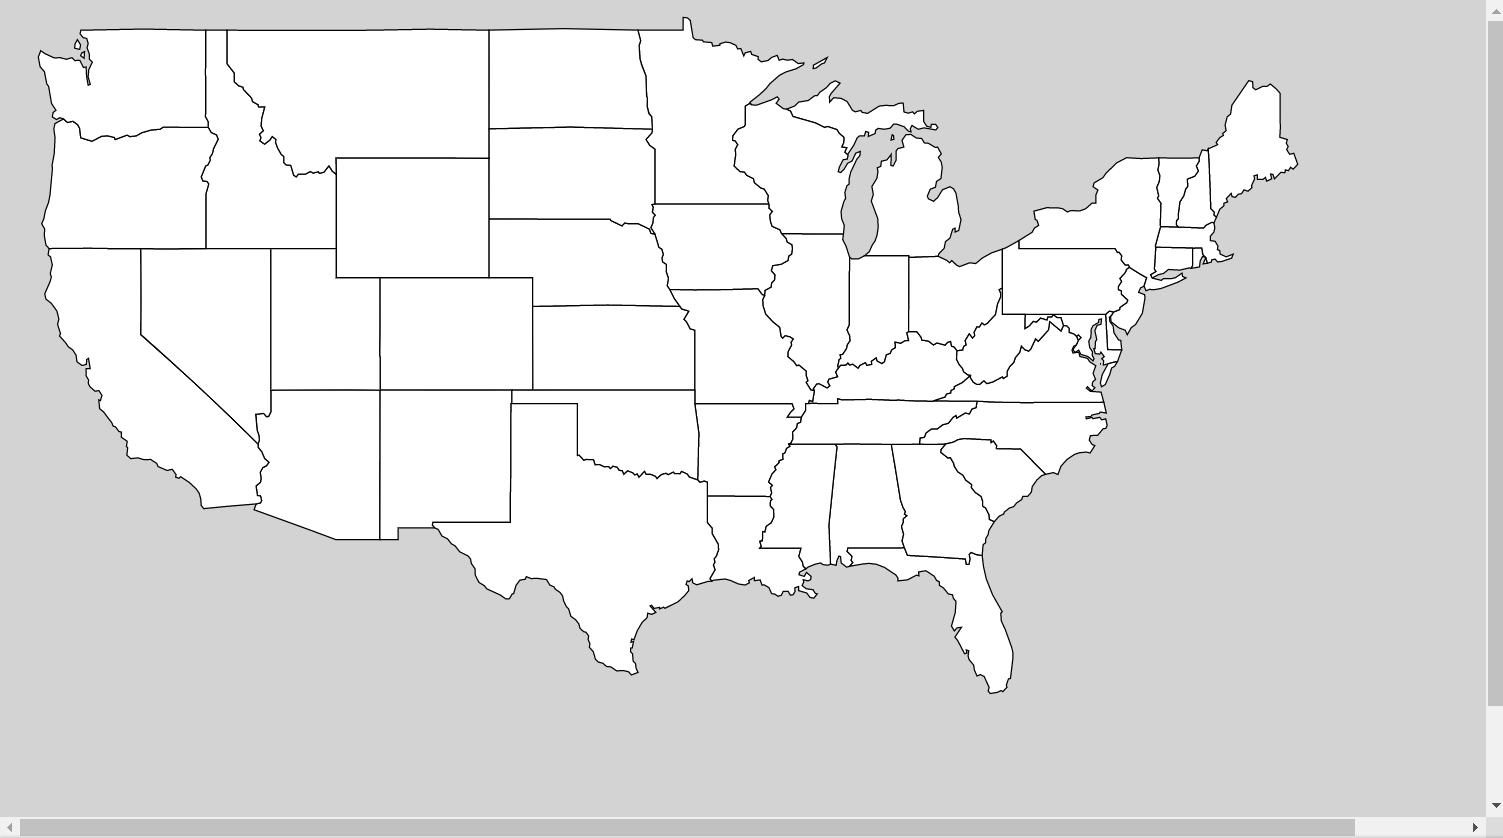
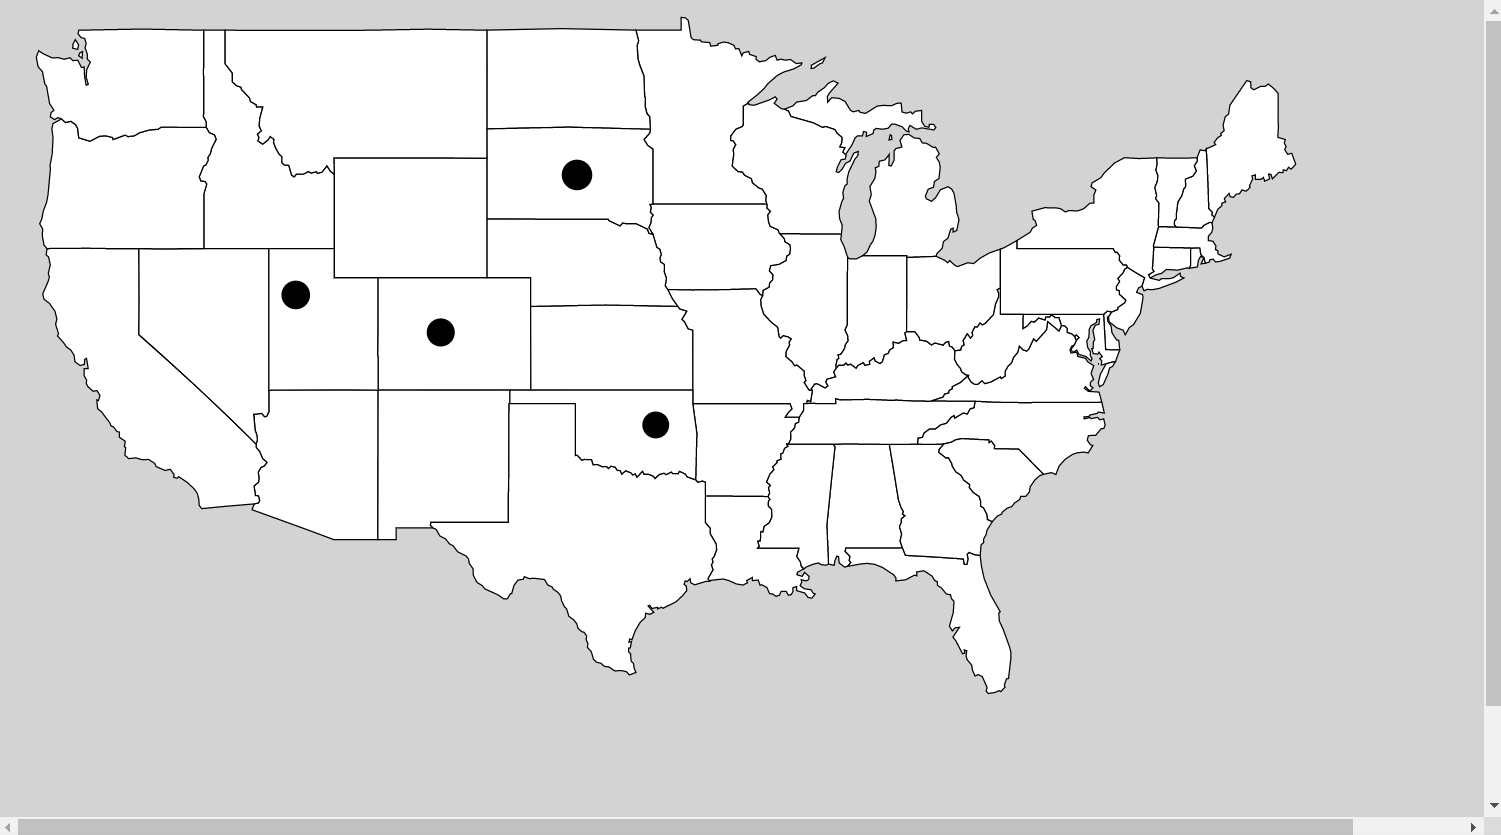
To get a more accurate map, there are many sources of GeoJSON online. Here is a map of the United States generated from a GeoJSON file from the PublicaMundi repository on Github.
Maps can be interactive. Say you want to check if the mouse is clicked inside of state boundaries. It is easy to get the coordinate of a mouse click.
      d3.select('g.map')
  .on('mousedown', function() {
    console.log(d3.mouse(this));
  });
The d3.mouse method will return the x-y coordinates relative to the map element. The problem is that you will likely need the latitude and longitude. The projection function will convert the x-y coordinate to latitude and longitude. Calling invert on the projection will reverse the process.
      d3.select('g.map')
  .on('mousedown', function() {
    console.log(projection.invert(d3.mouse(this)));
  });
With the latitude and longitude of the mouse click, you now need to get the boundaries of a state and check if the mouse coordinates are inside of it. Like many tasks in geospatial analysis, this is difficult. But D3 gives you an API to make it simple. First you need to get the feature itself. The features are just objects, and each has a name property corresponding to the state name.
      var feature_utah = geodata.features.find(
	f => f.properties.name === 'Utah'
);
To perform the hit test, use the geoContains function and pass it the features and the coordinates. It will return a Boolean true if the coordinates are in the feature.
console.log(d3.geoContains(feature_utah, coords));
It's also easy to generate a circle at the point the mouse was clicked. The geoCircle method will generate a circle shape at the specified coordinates.
      var circle = d3.geoCircle()
	.center(coords)
	.radius(0.5);
The circle represents a GeoJSON object, which will be converted to an SVG path string when passed to the generator. That SVG can be appended to the path of the map.
      d3.select('g.map')
	.append('path')
	.attr('d', generator(circle()));
Conclusion
This guide showed you how to work with GeoJSON to render online maps in JavaScript with D3. The D3 API provides objects and methods to handle the complex work of geospatial analysis. As you saw, part of the challenge of creating a geospatial visualization is getting the accurate map data. There are lots of repositories and databases online where you can get GeoJSON data. You can also convert other formats, including shapefiles, to GeoJSON.
You also saw how projections allow you convert between 2d coordinates and latitude and longitude. This makes it possible to create interactive geospatial visualizations. You learned how to check if a point is contained within a GeoJSON feature and how to add shapes to a map by generating GeoJSON objects and adding them to an SVG path.
Advance your tech skills today
Access courses on AI, cloud, data, security, and more—all led by industry experts.

