Publish and Share a Dashboard/Workbook in Tableau
Aug 14, 2020 • 9 Minute Read
Introduction
To create a good visualization dashboard on Tableau is great, but you might also be required to publish or share it with your colleagues. This will enable collaboration within your team members. This also allows you to show your work to a larger audience. In this guide, you will learn how to publish and share a dashboard in Tableau.
Data
This guide will use the Sample Superstore data source available in the Tableau repository.
Building Blocks
To make a dashboard, you will create different sheets before adding them into a dashboard. To begin, the first chart you will create will be a geographical map that displays the granular details for different states or region. To start, drag the State variable into the Details card of the Marks shelf.
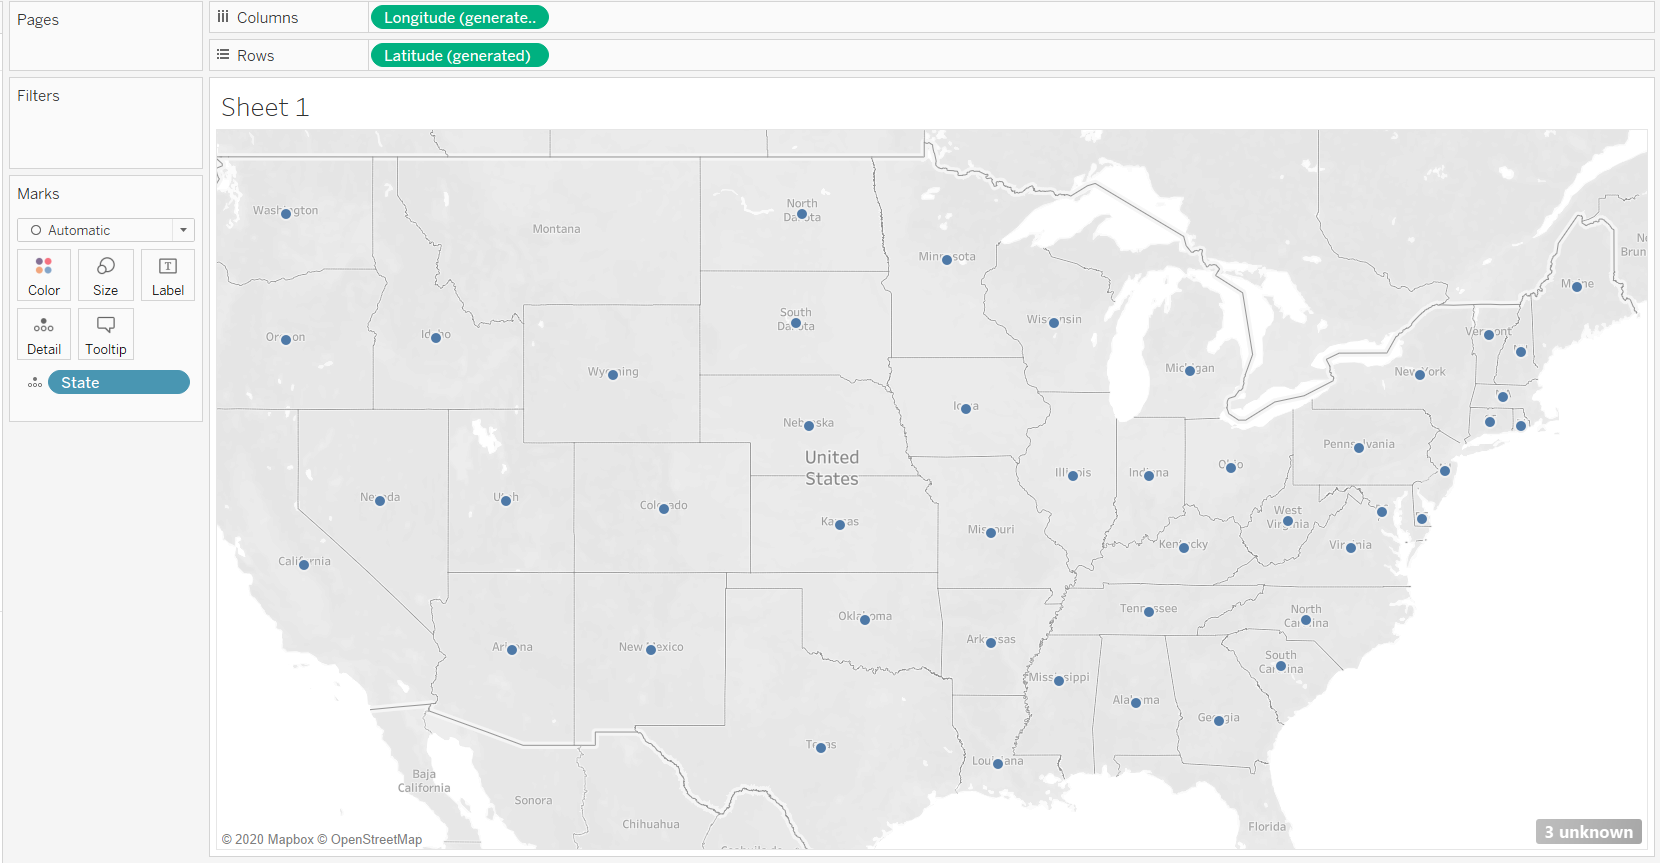
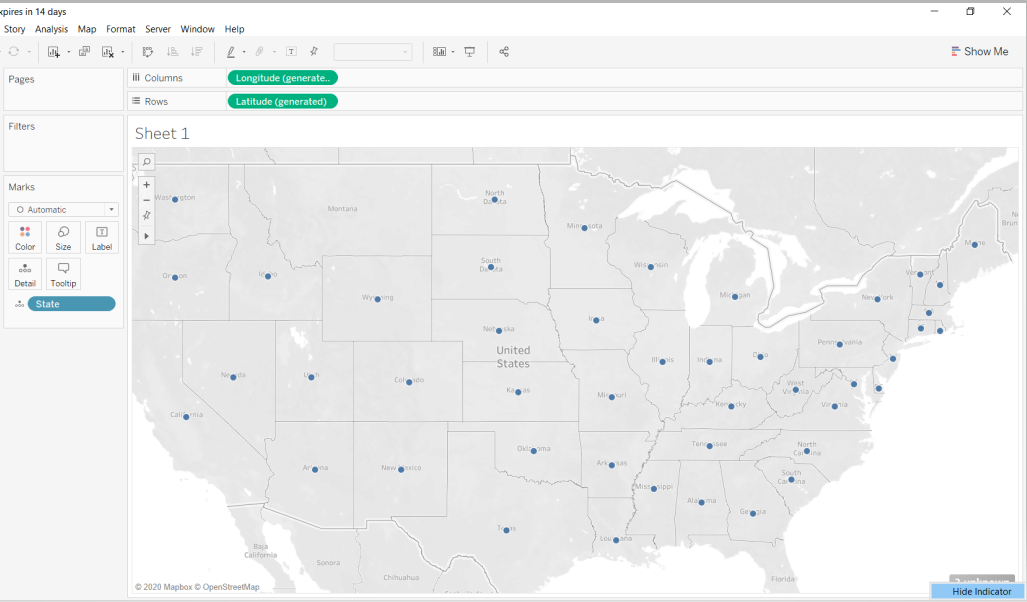
Right click on the “3 unknowns” message at the bottom right corner of the view and select Hide Indicator.
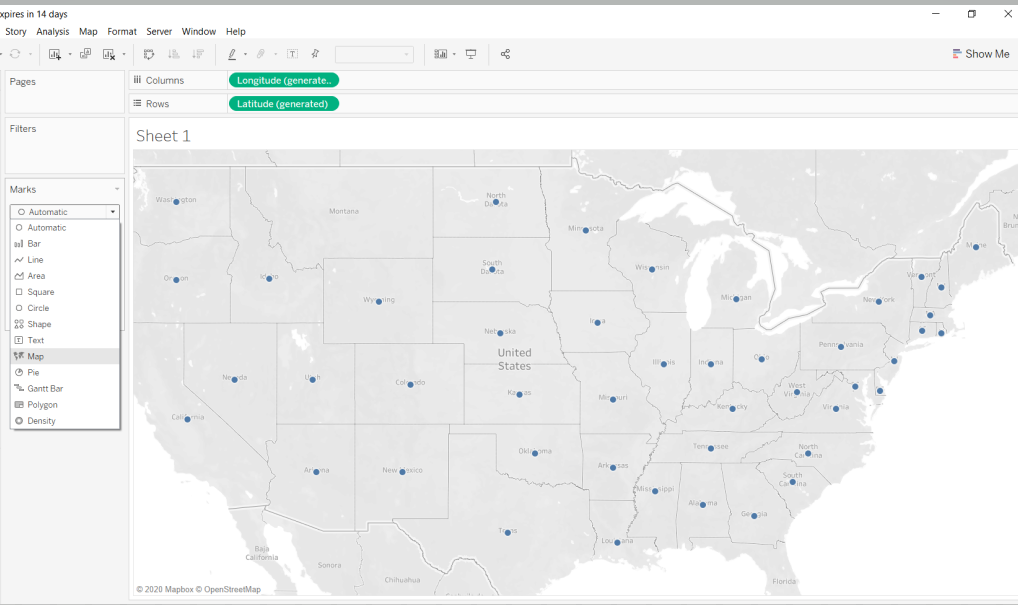
Next, you will change the look of the chart. To do this, go to the Marks card, and select Map as shown below.
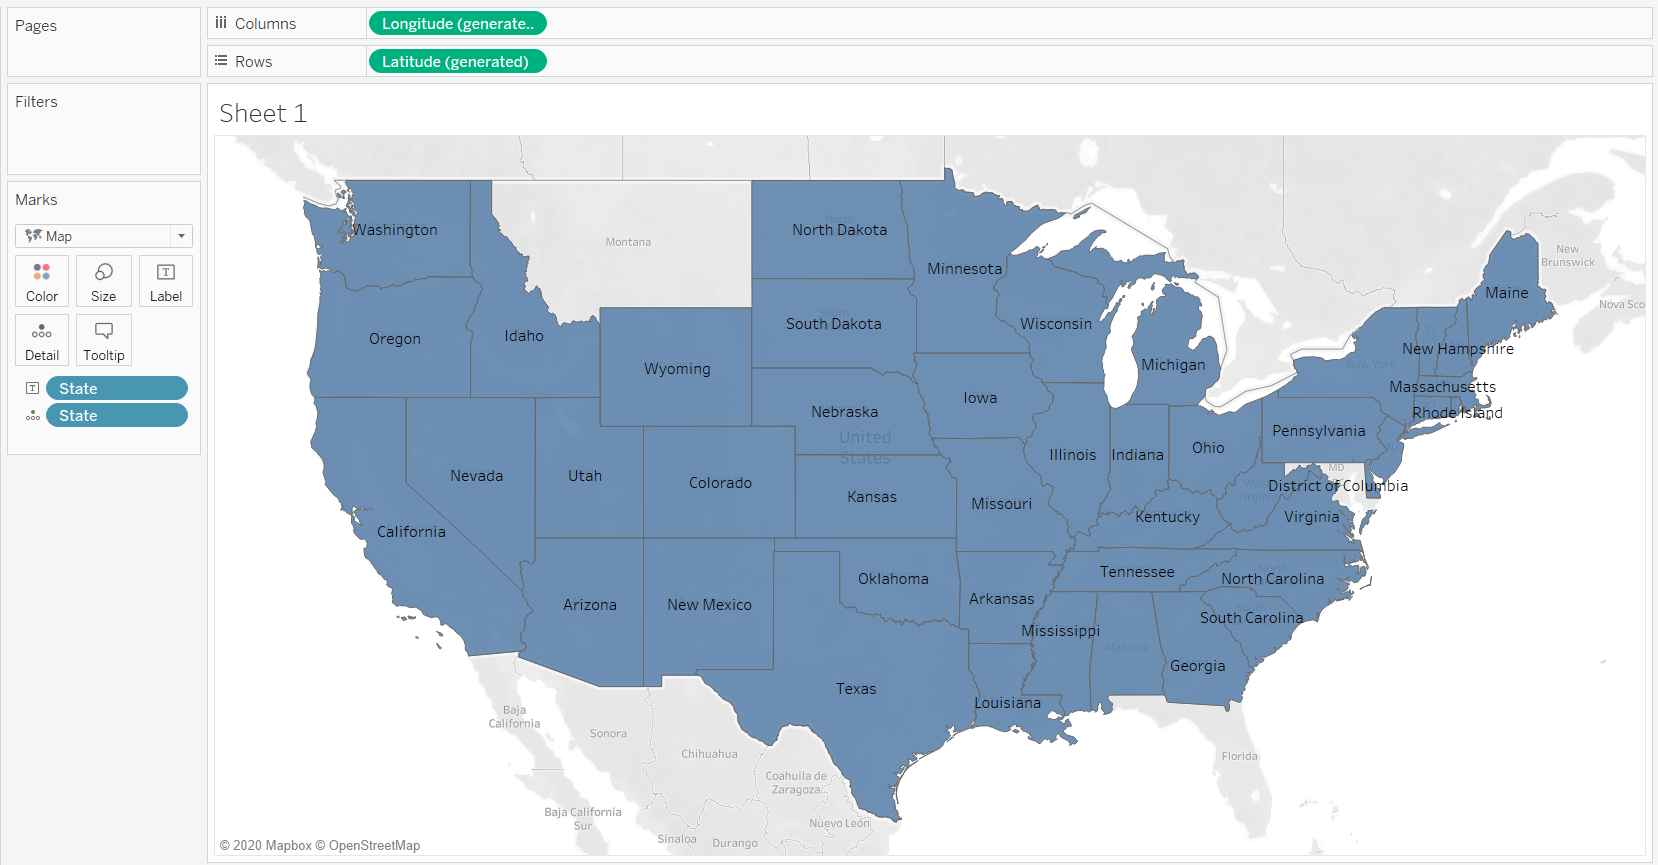
Drag State field into the Label option of the Marks card.
Next, drag the Region field to the Color card of the Marks shelf.
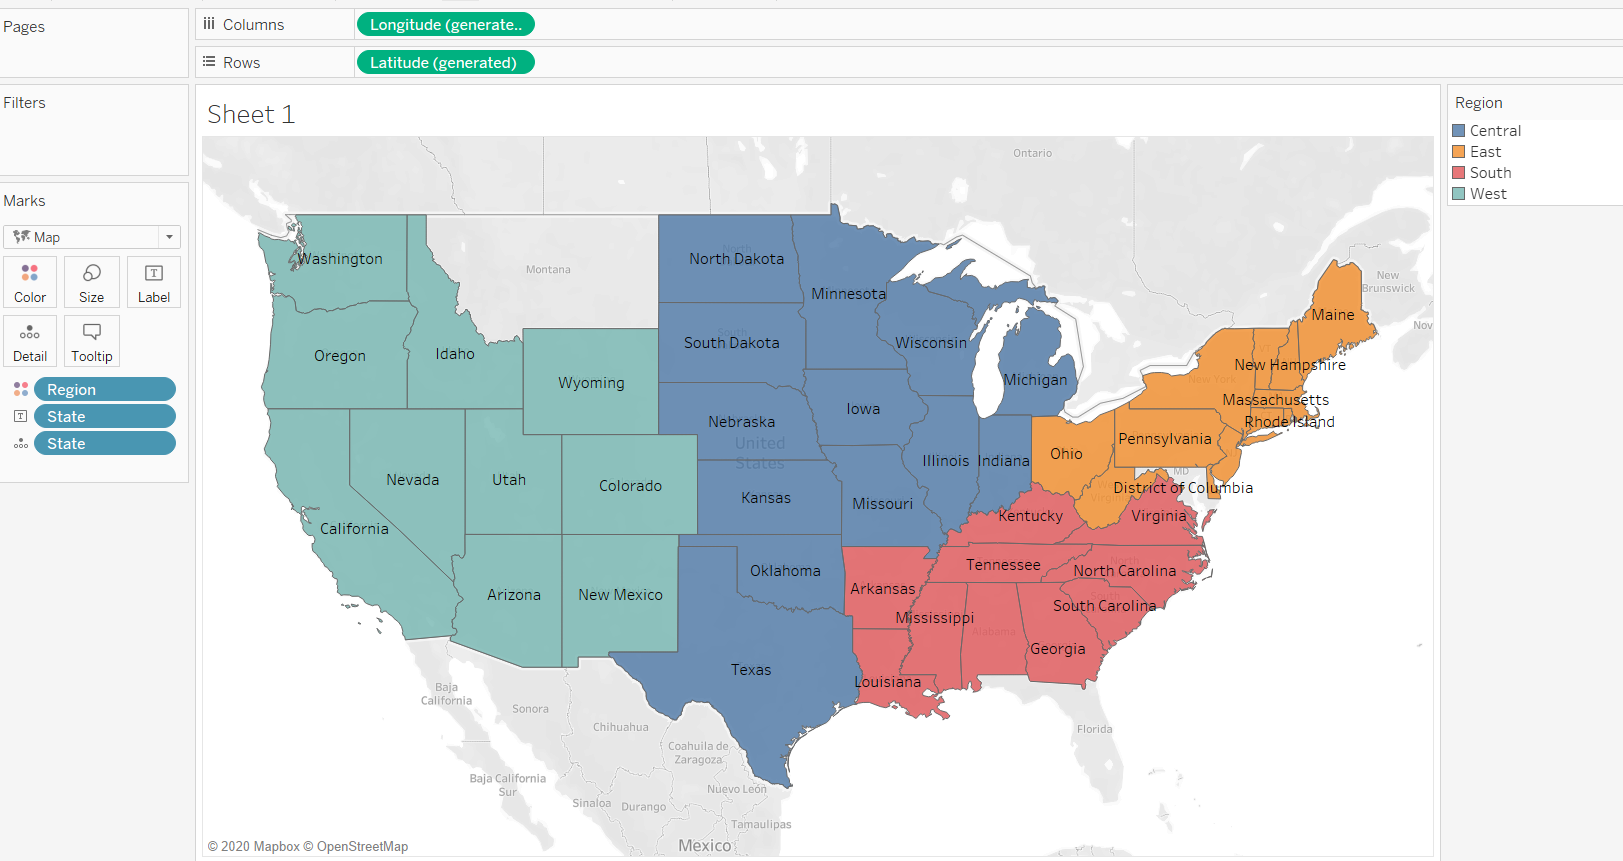
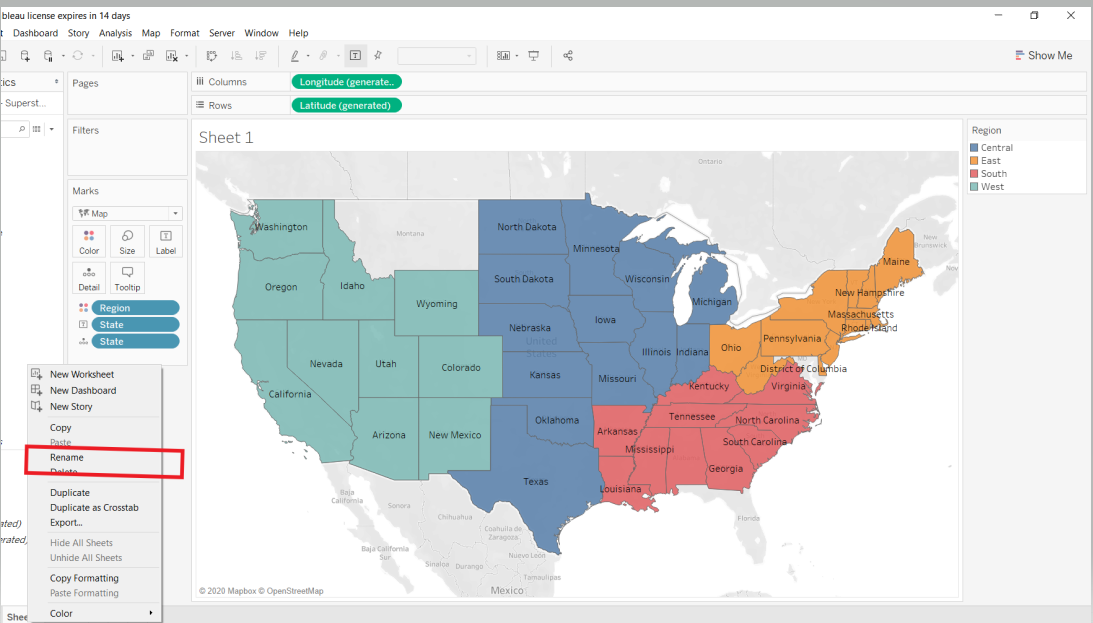
Rename the sheet as State By Region. To do this, right click on the sheet tab and select Rename.
The above steps will produce the output below.
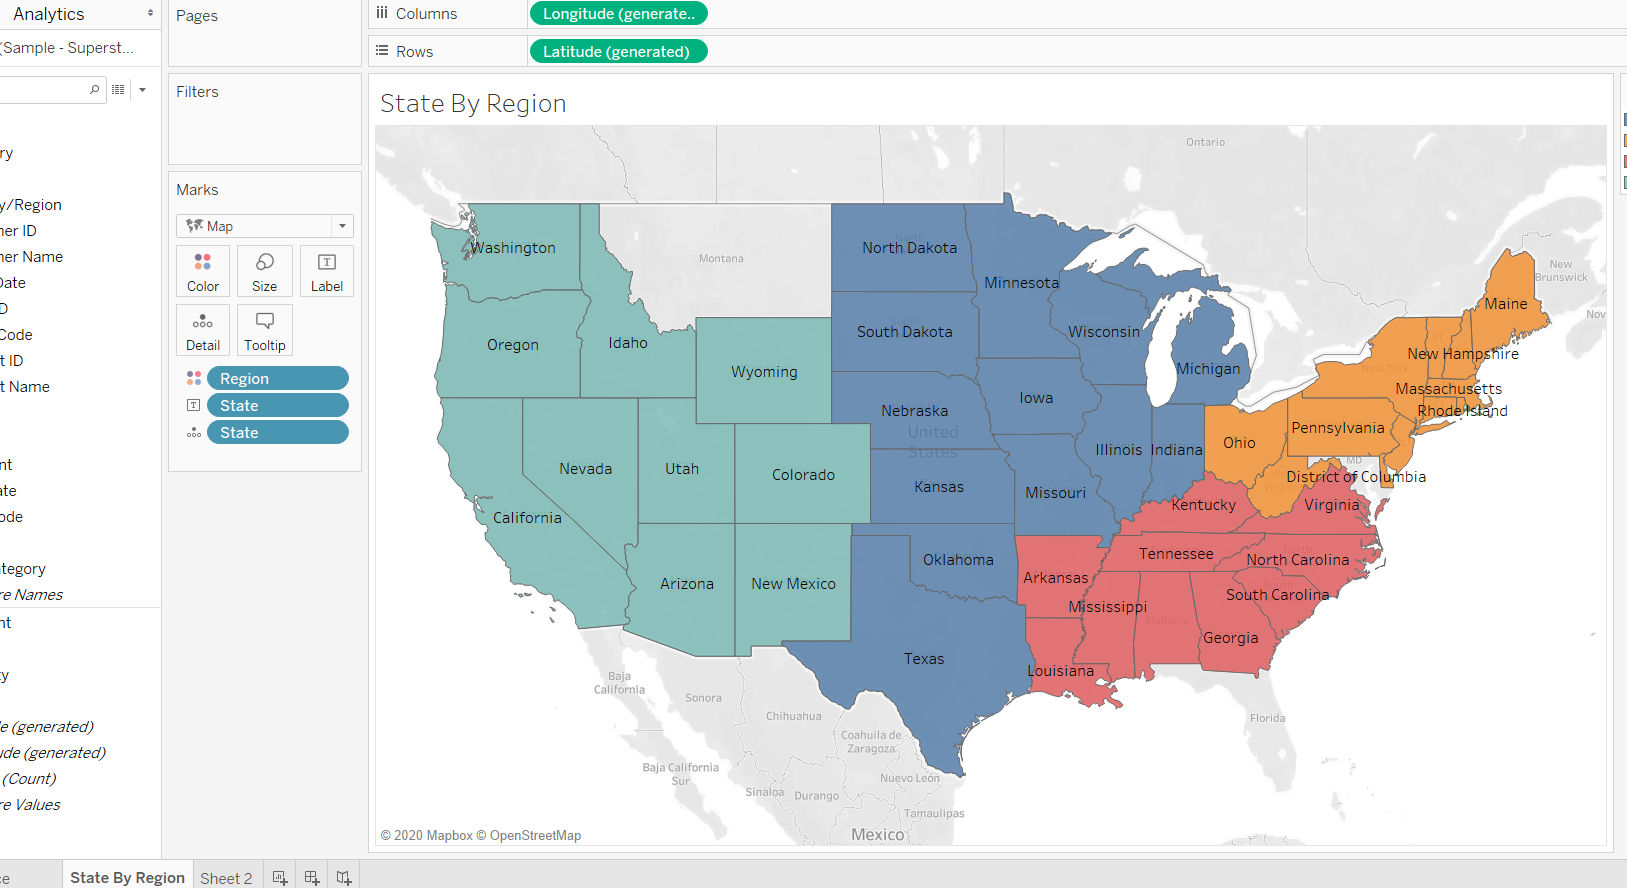
The output above shows that the first sheet of the dashboard is ready.
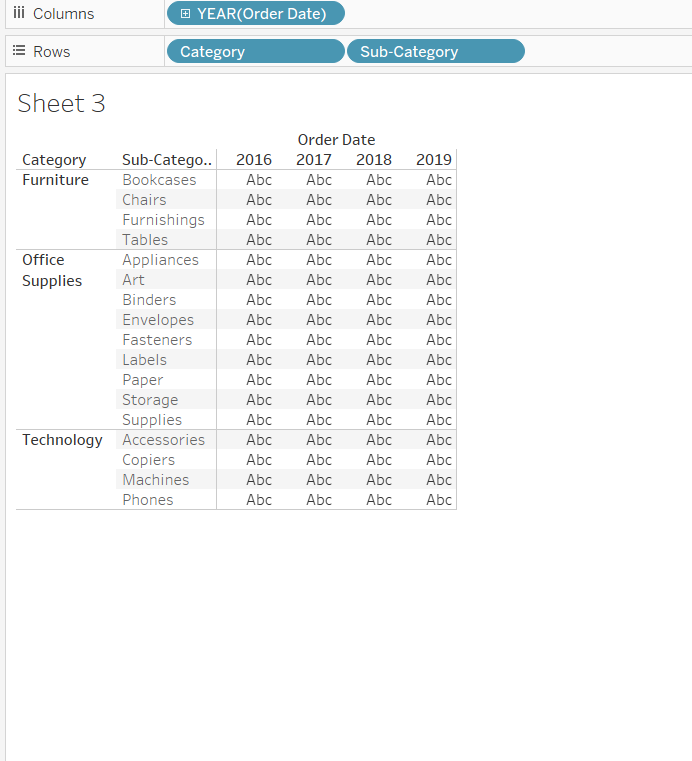
Next, you will build a chart that contains the transaction level detail by Category and Subcategory across YEAR.
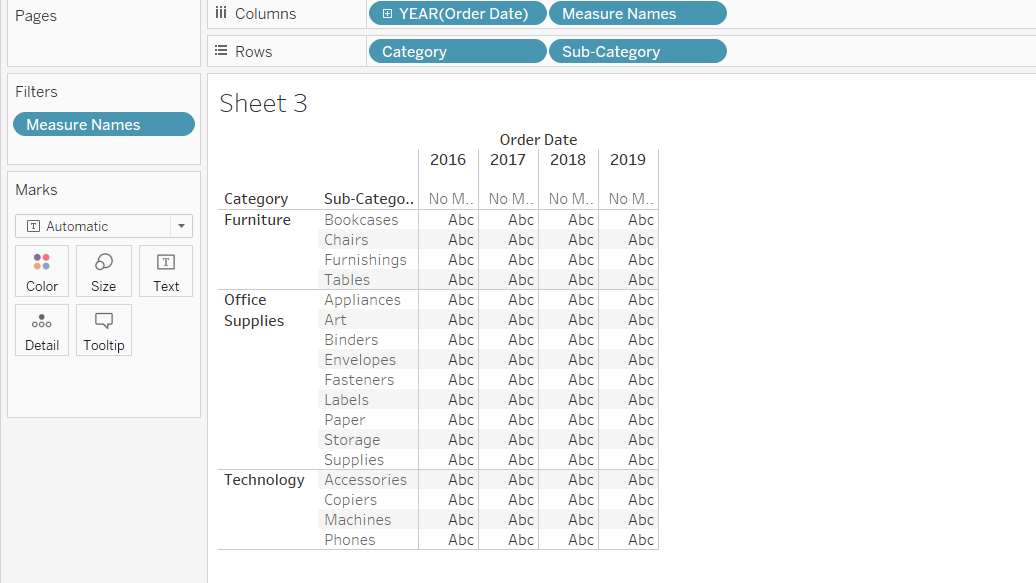
To begin, drag Category and Sub-Category into the Rows shelf, and Order Date into the Columns shelf.
Next, drag Measure Names from the dimensions pane to the Filters pane, and select the variables Sales and Profit.
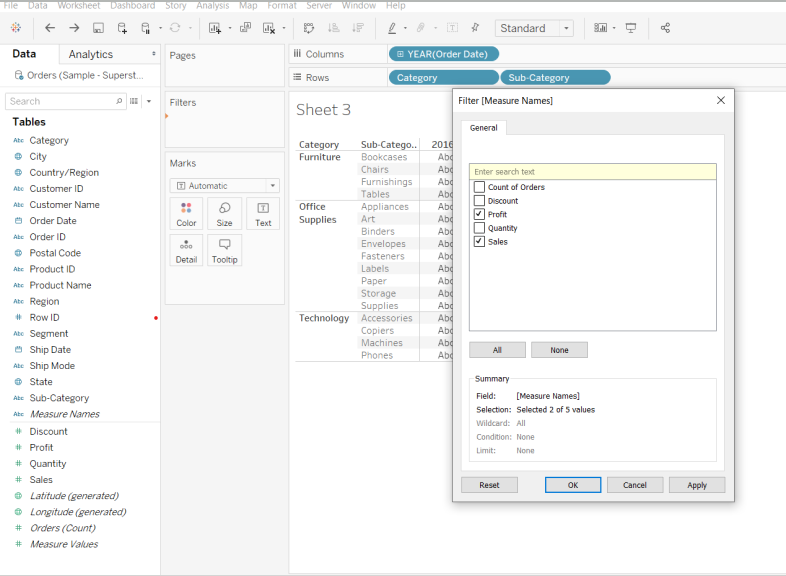
Click OK after the above selection. Next, press the ctrl key and drag the Measure Names from the Filters pane to Columns shelf.
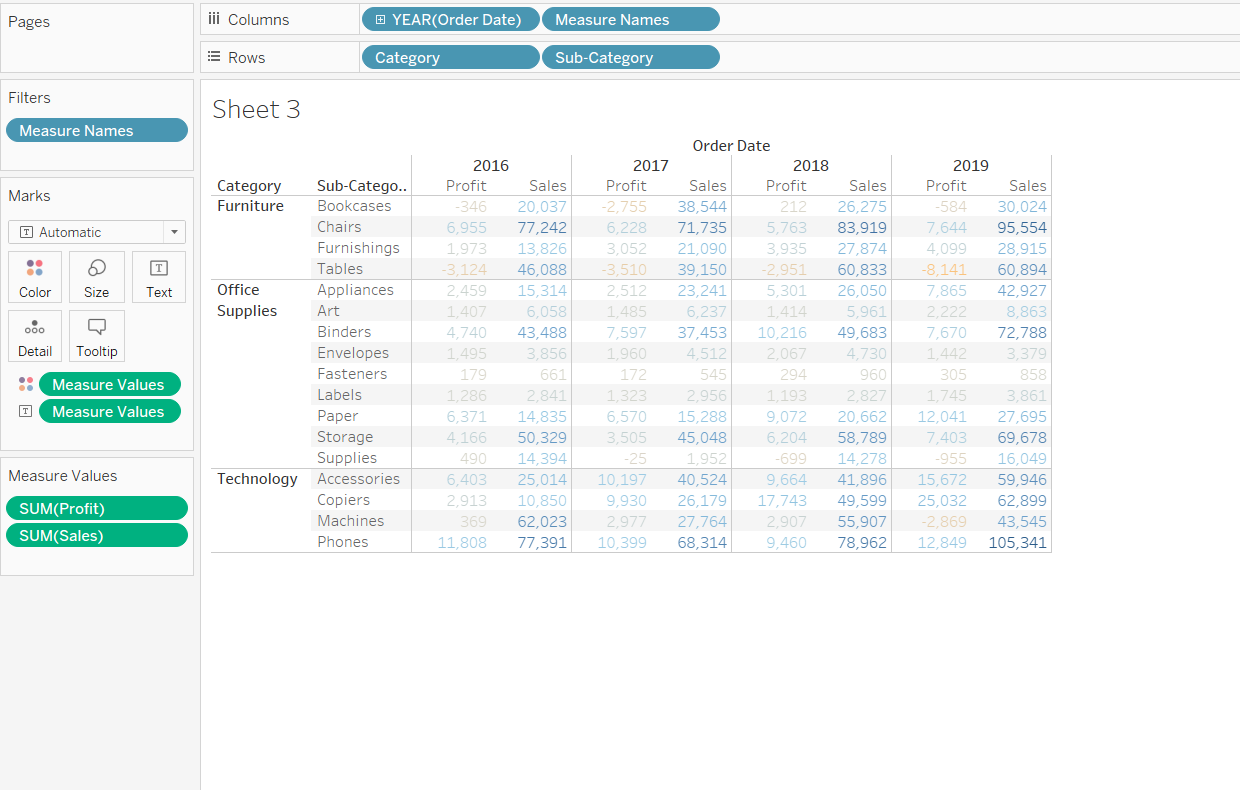
Drag the Measure Values twice to the Marks card. Once into the Label pane, and second time into the Color pane.
Select Square option from the Marks card instead of the default selection.
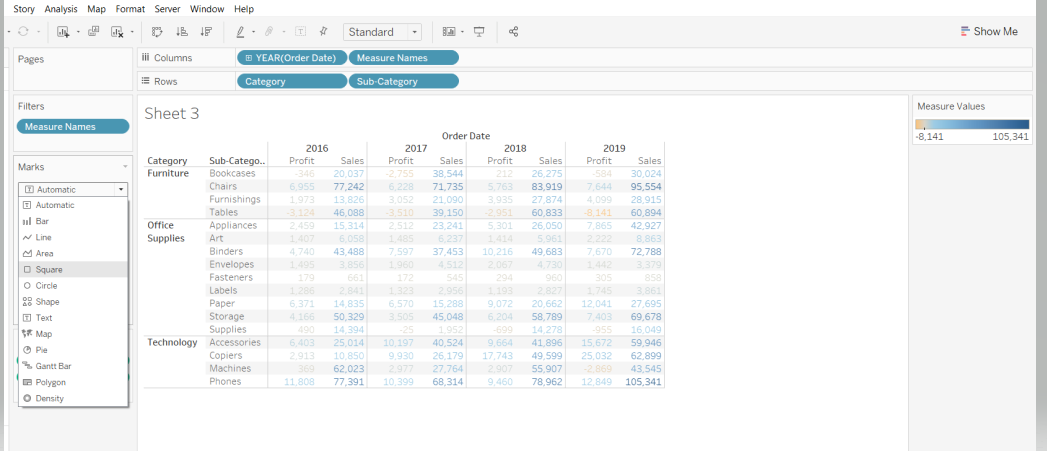
The above selection will make the view more appealing.
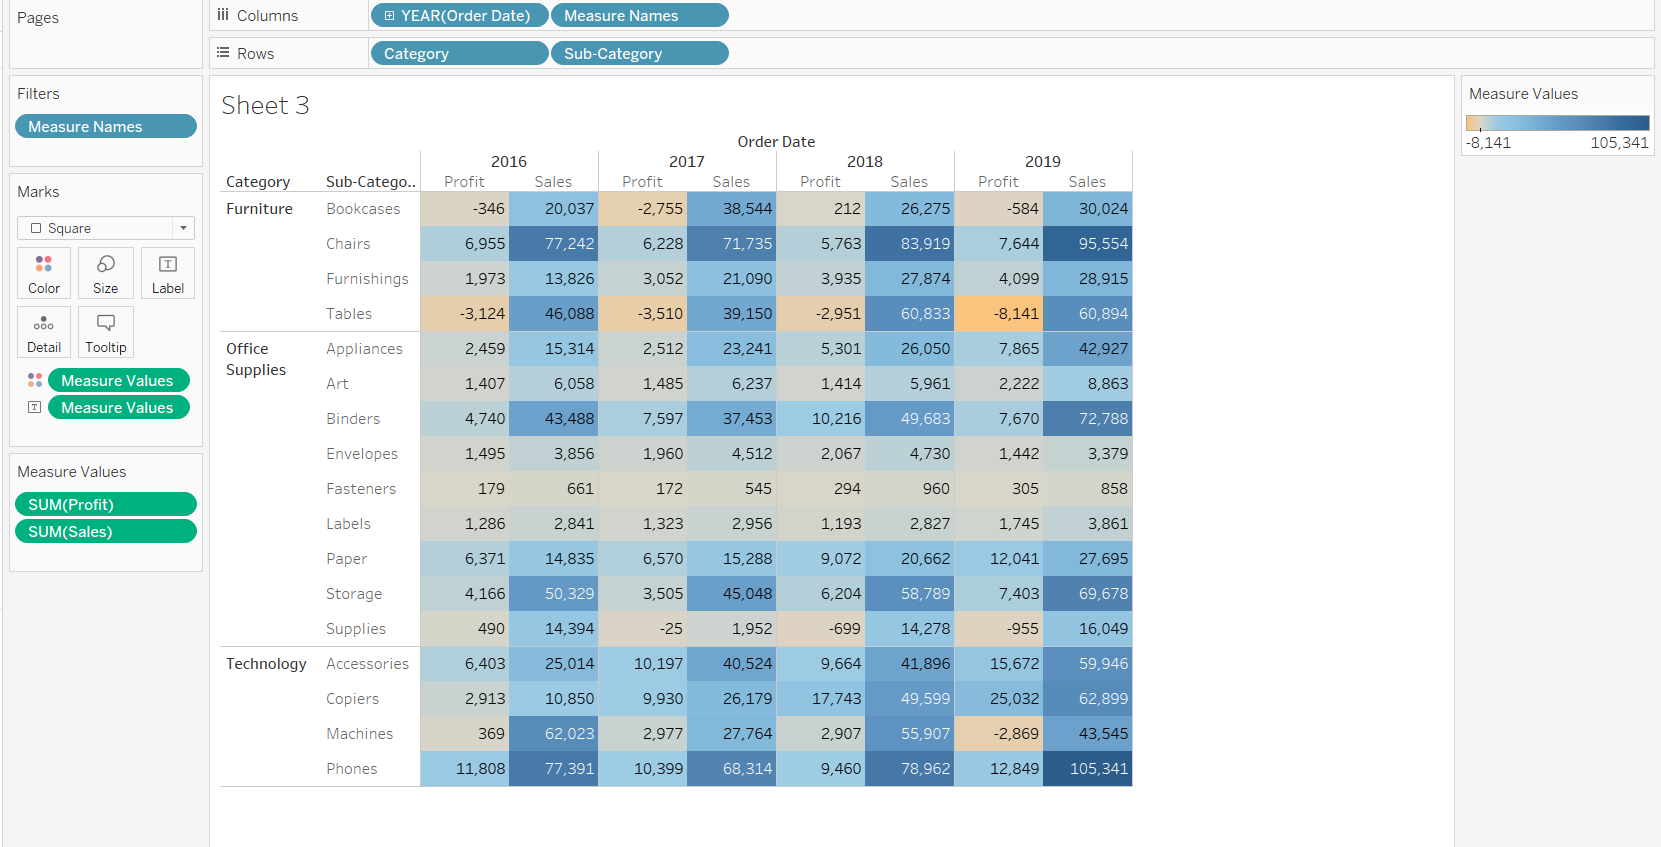
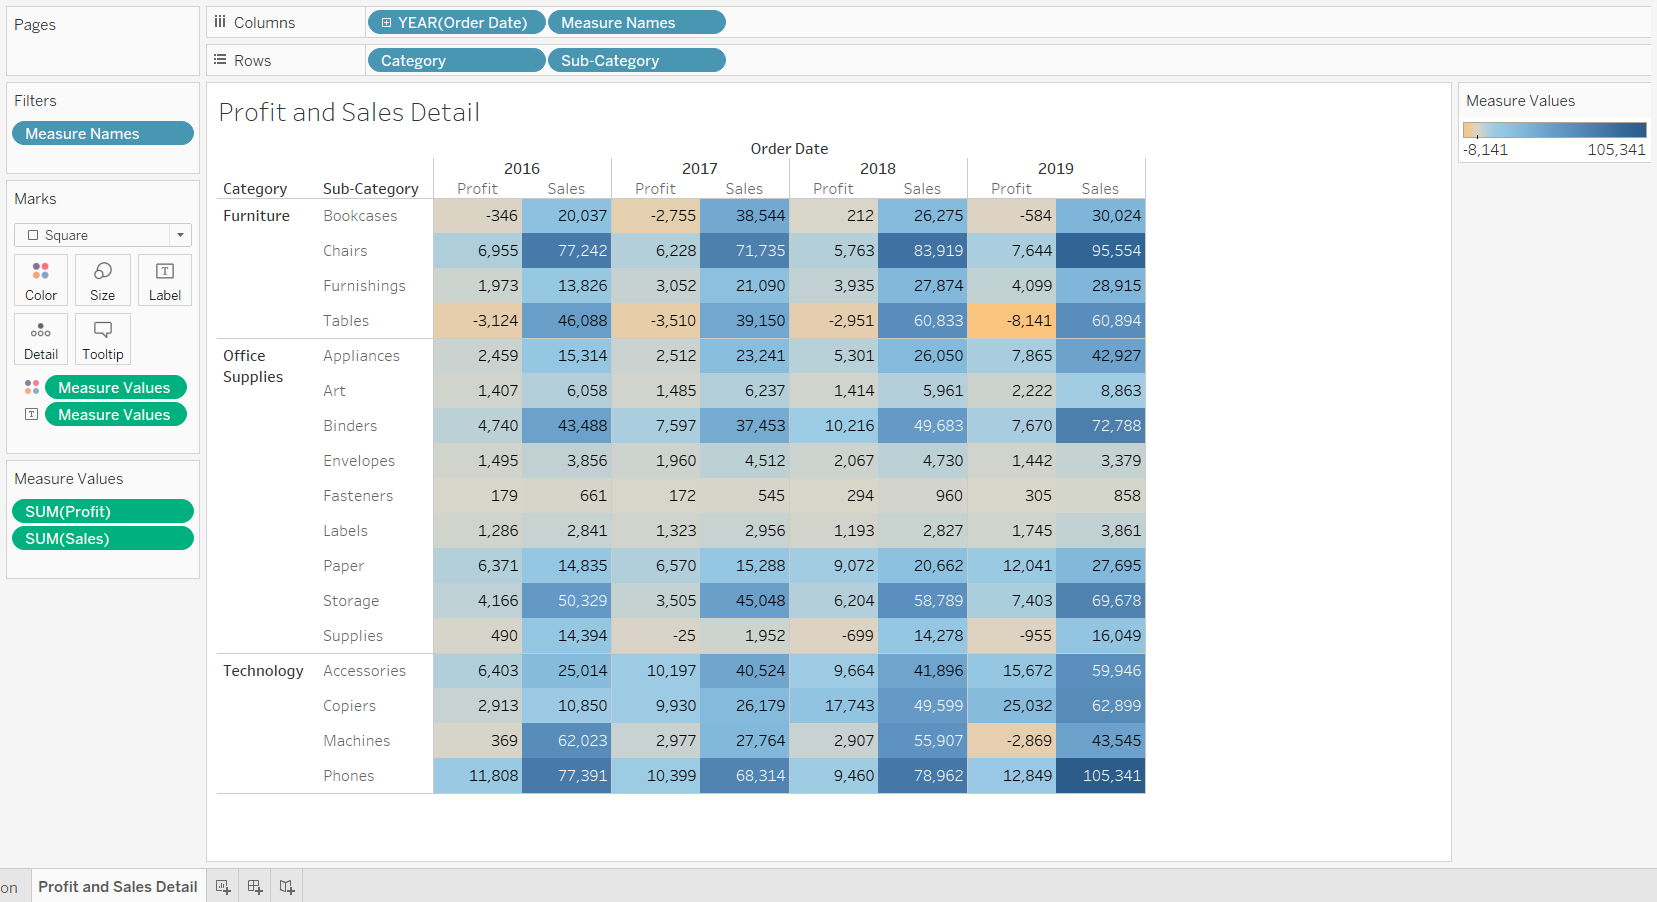
Rename the sheet to Profit and Sales Detail.
Now both the sheets are ready, and the next step is to create the dashboard.
Creating the Dashboard
You will place both the sheets together to present them as a dashboard. Click on the icon next to the sheet tab at the bottom as depicted below.
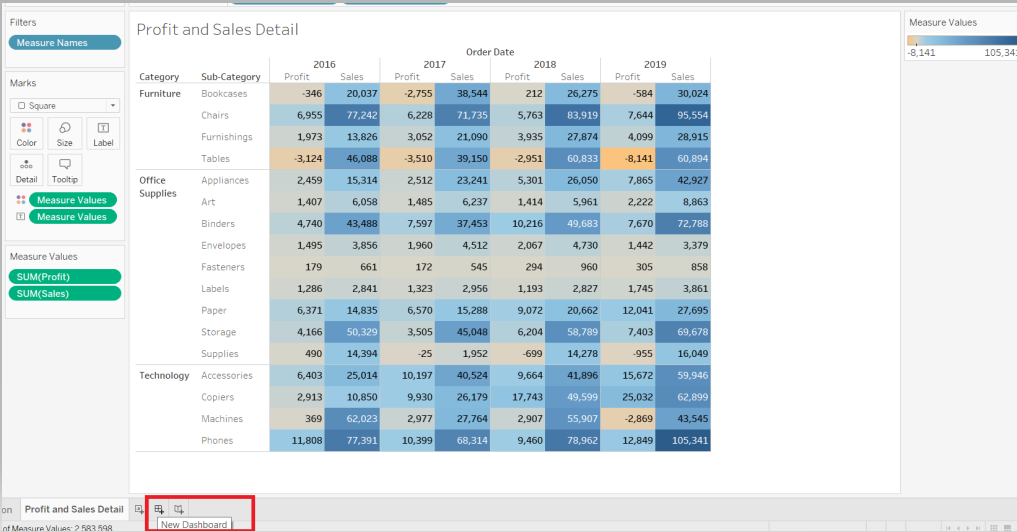
The above step results in a new tab, which is a dashboard pane.
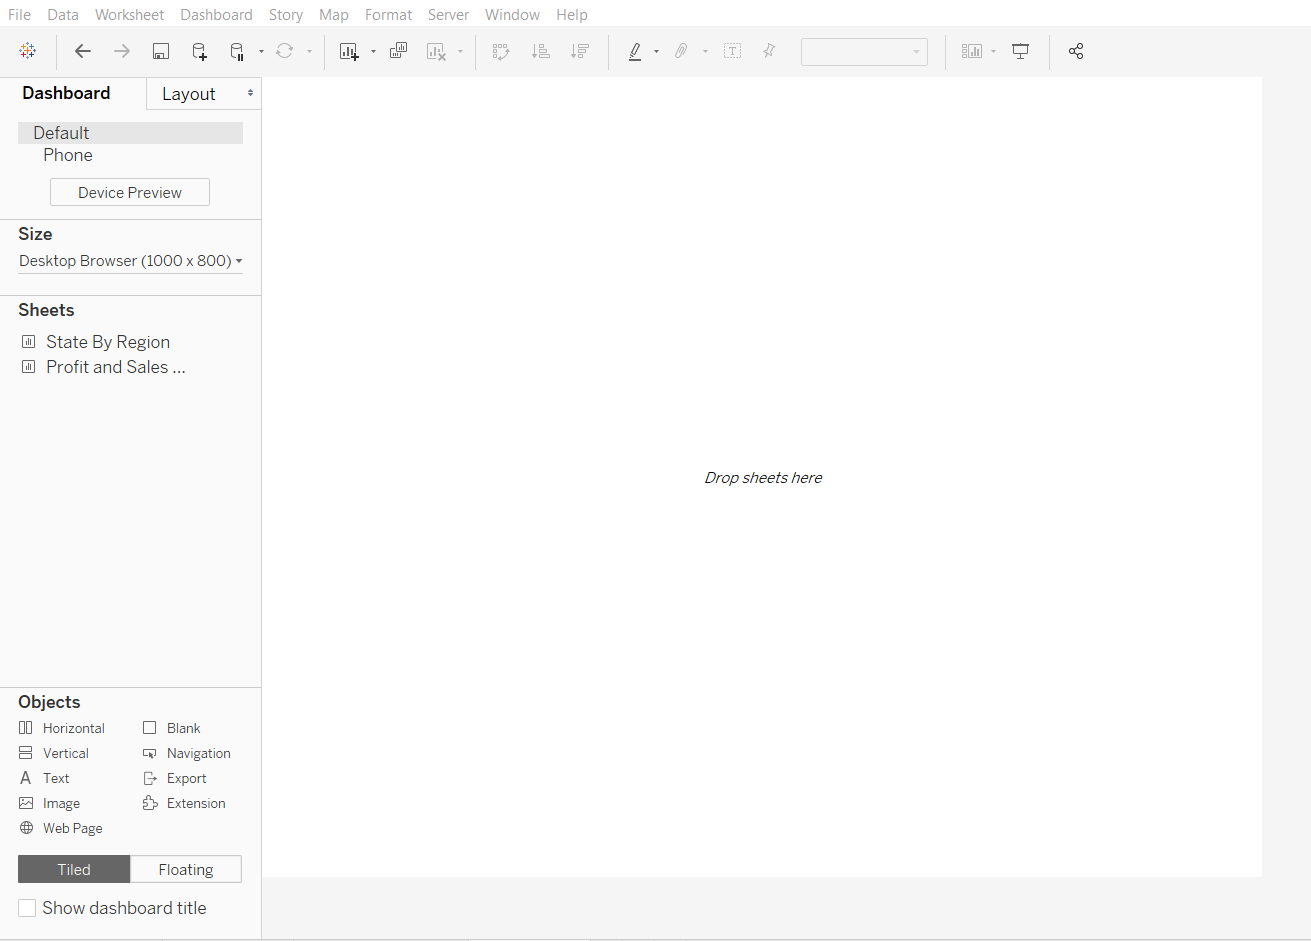
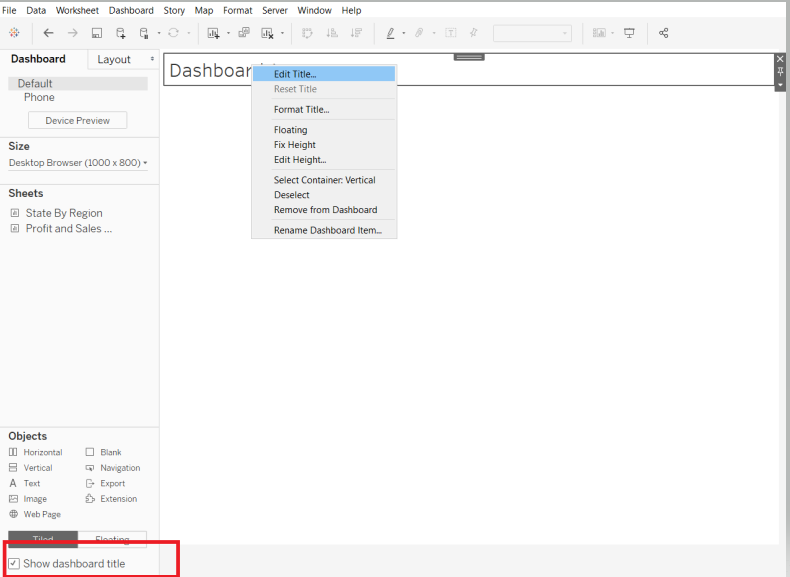
In the output above, you can see that both the sheets are displayed. You will begin by giving title to the dashboard. Check the box of Show Dashboard title.
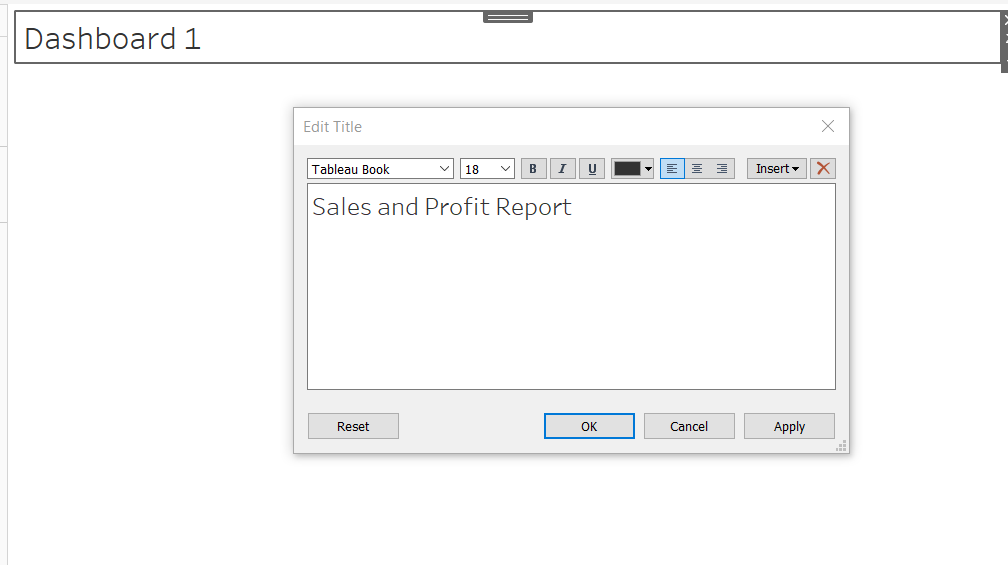
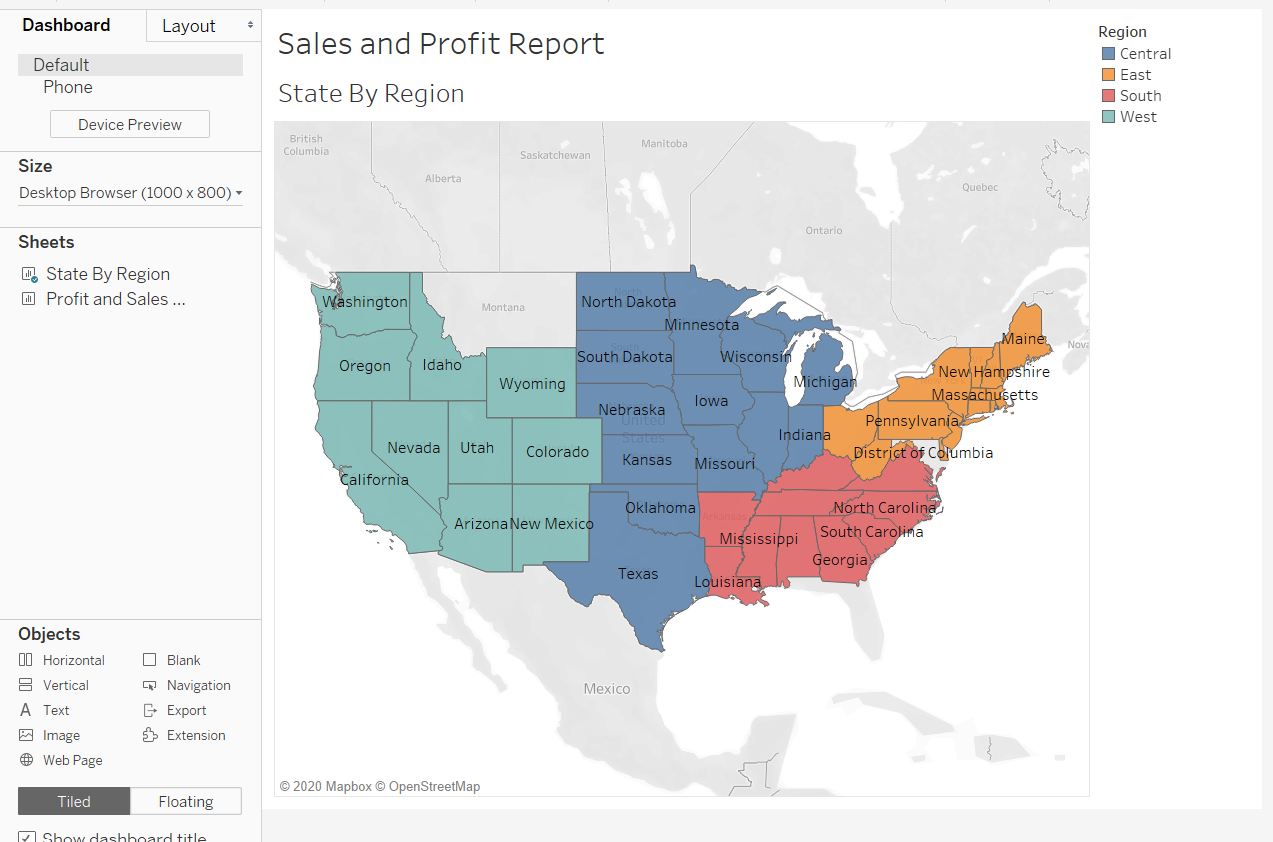
Enter the dashboard title and click OK.
Now you will drag the respective sheets. Drag State by Region sheet into the dashboard pane.
Next, drag the Sales and Profit Detail sheet into the bottom end of the dashboard view.
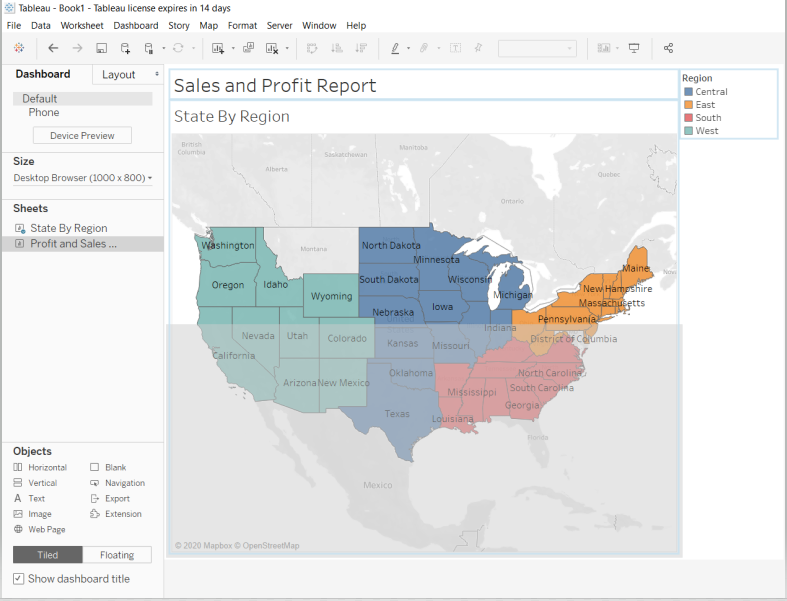
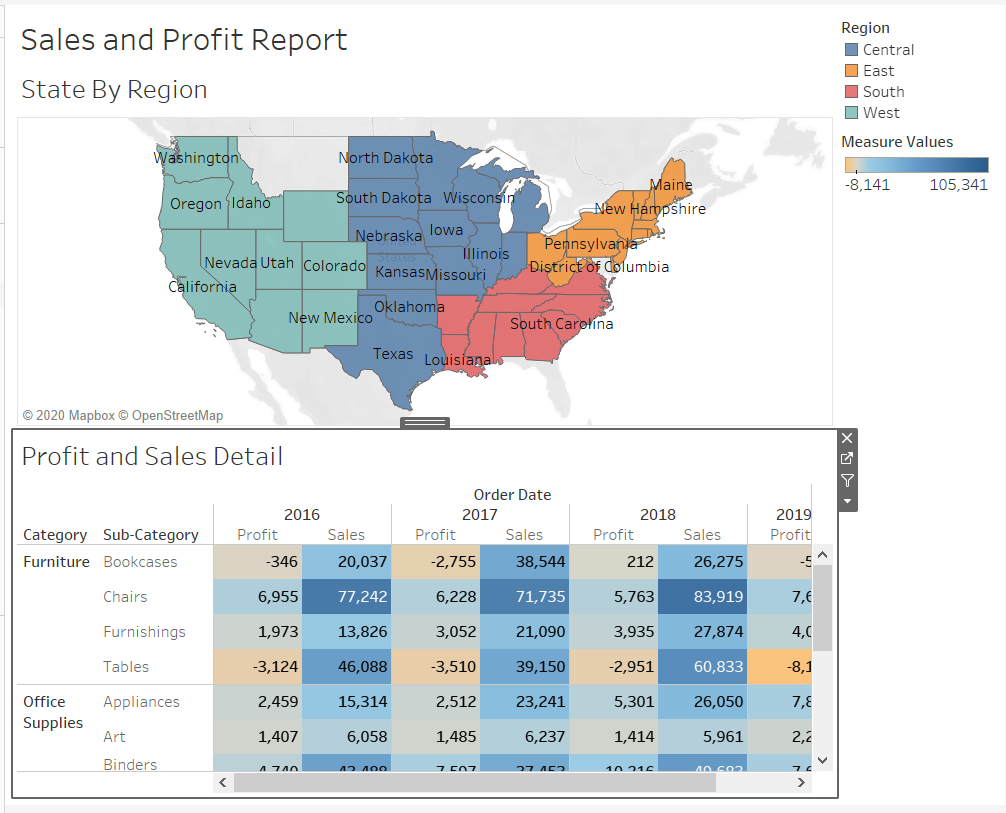
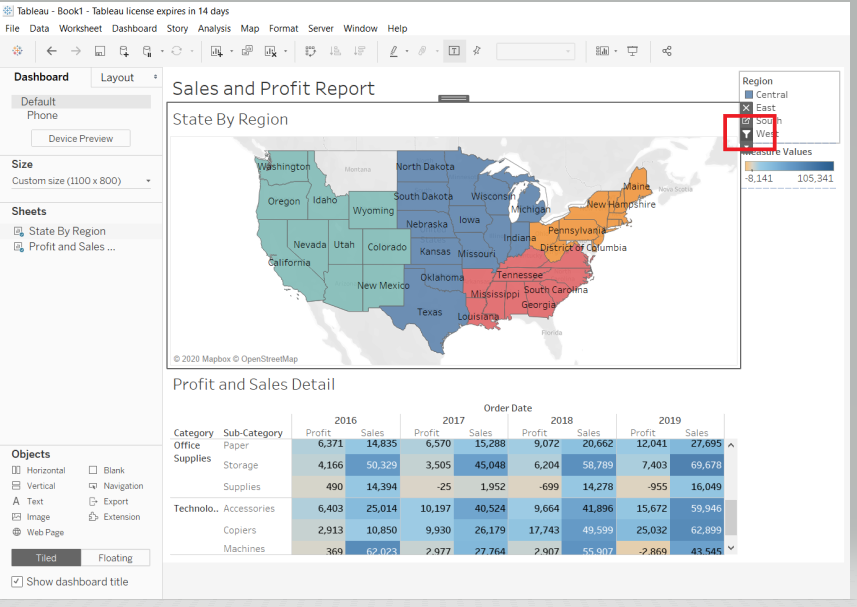
Click on the State by Region sheet and select the filter icon as shown below. This will help refine the profit and sales detail as per selection.
Publishing Dashboard
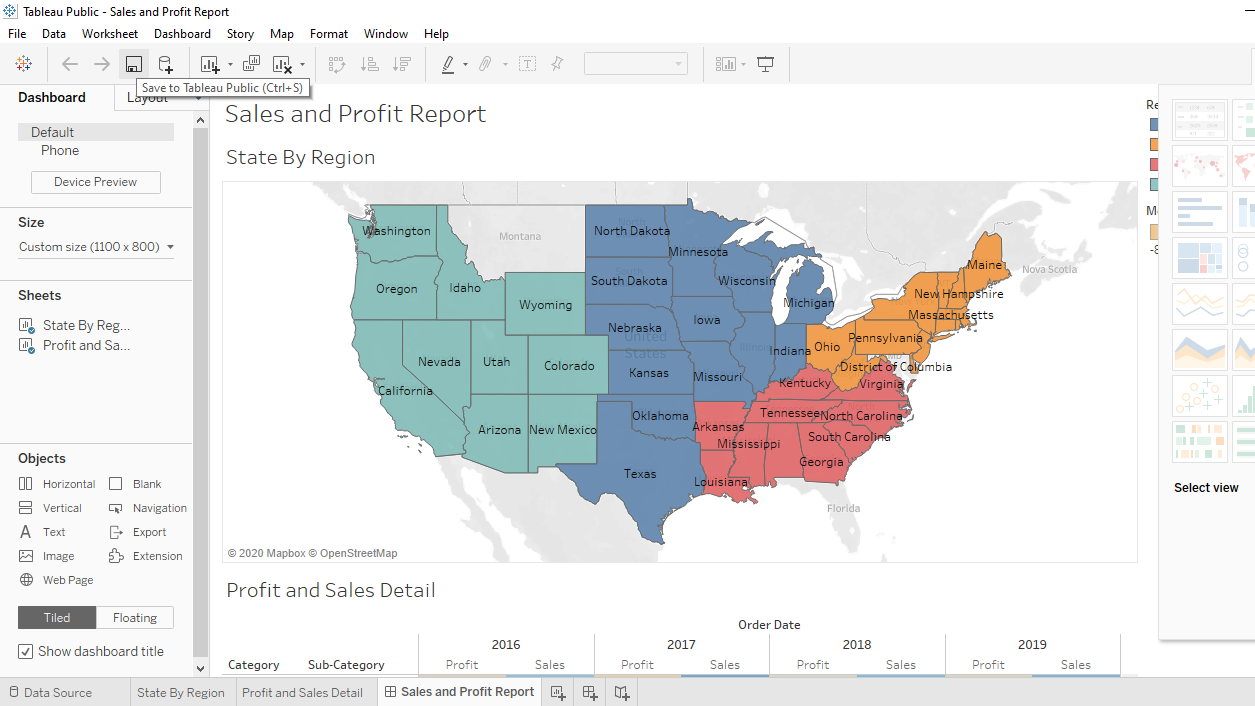
You have created the dashboard and the next step is to publish it. You will work with the option of Tableau public for publishing, because Tableau server is a paid service. To begin, click on the icon that shows Save to Tableau Public option.
This will open the tab where you need to enter the Tableau Public Sign In credentials. If you don’t have an account, you can use the Create one now for free link to create an account and then come back to this step.
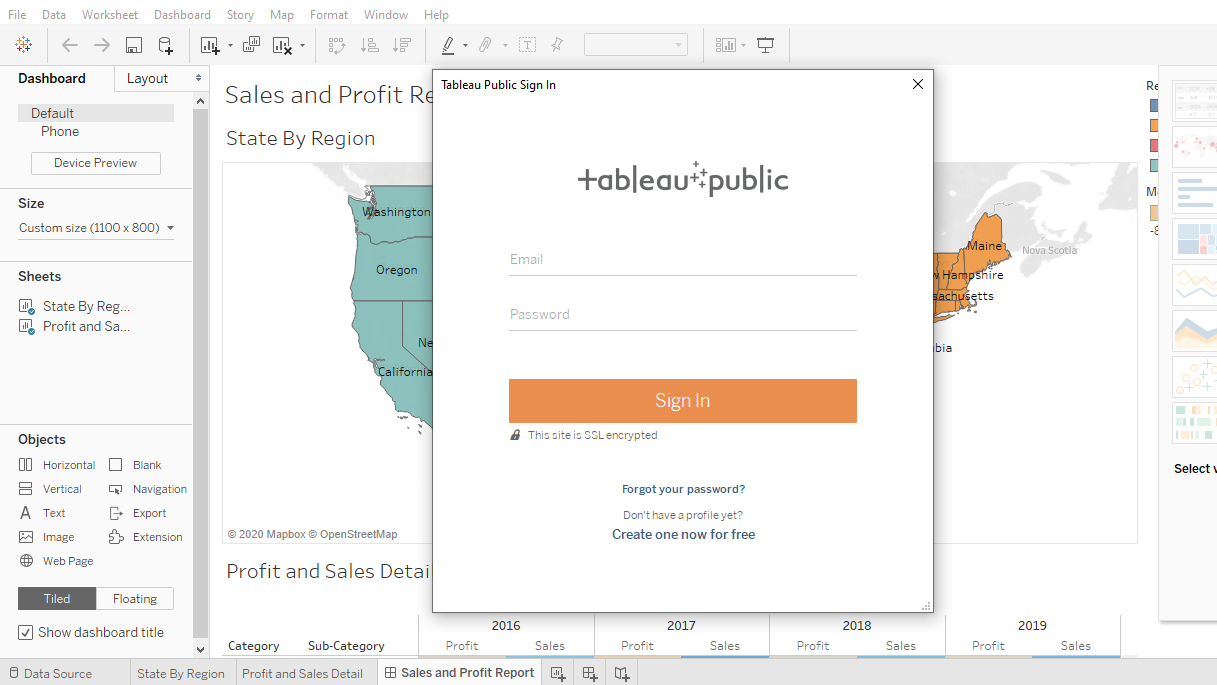
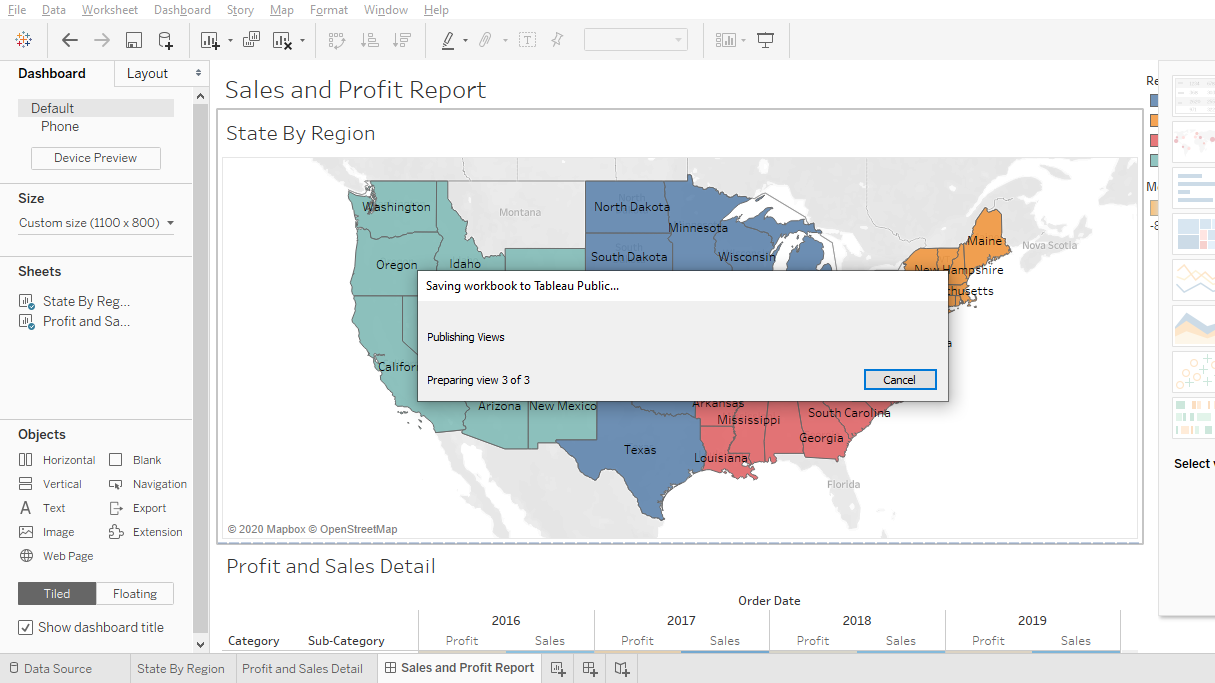
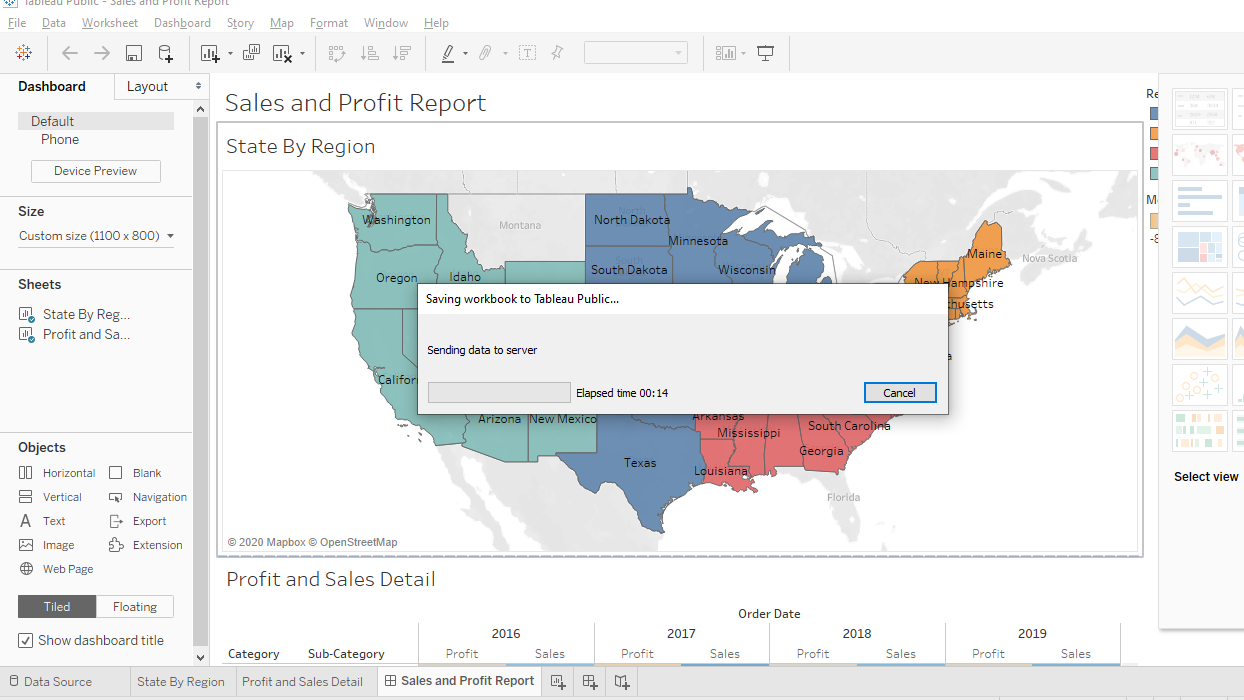
On entering the login details, the process of publishing the dashboard to Tableau public will begin.
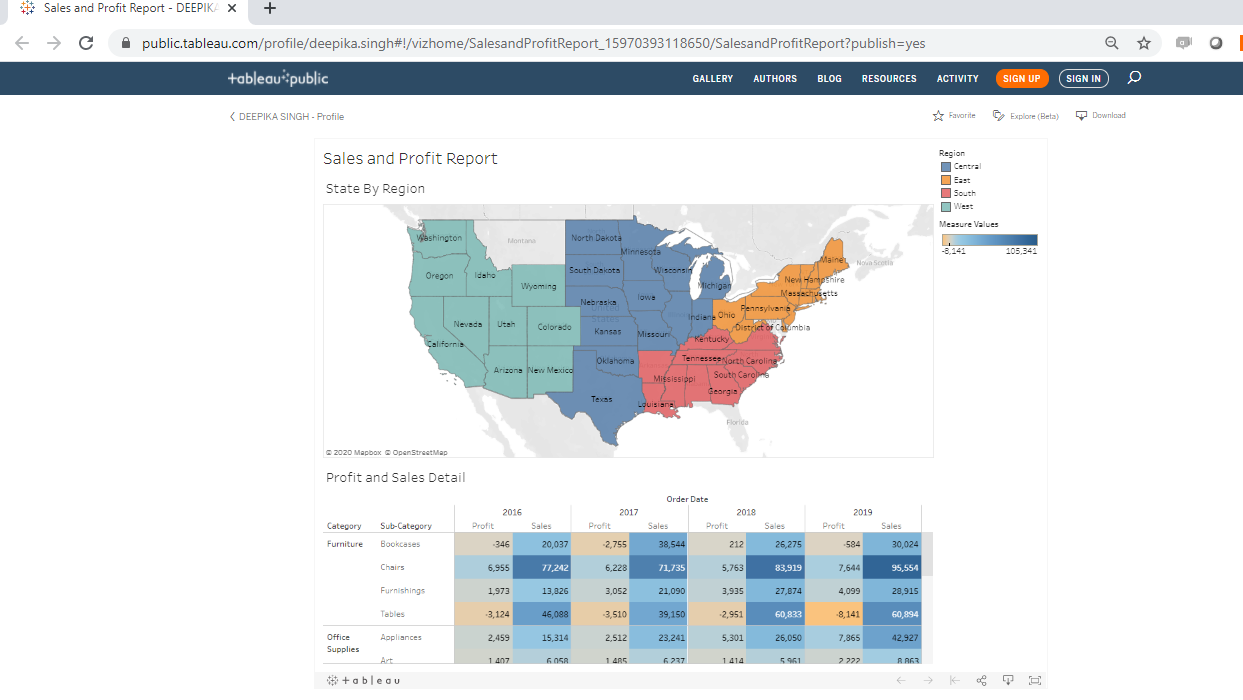
Once the dashboard is published, a default browser will be opened that will take you to the published dashboard.
Final Link
Completing the above steps will ensure that you have published your first dashboard in Tableau. To access the dashboard, refer the below link.
Conclusion
In this guide, you learned how to publish and share a dashboard in Tableau. You began by creating charts, then you learned how to add these charts into a dashboard, and finally learned how to publish it in Tableau public. This will strengthen your visualization skills as well as help showcase your work to others. To learn more about visualization and data analysis using Tableau, please refer to the following guides:
Advance your tech skills today
Access courses on AI, cloud, data, security, and more—all led by industry experts.
