Reactive Analytics Using Keen.IO and ActionCable in Rails 5
Learn how to create a reactive web dashboard from scratch by using Ruby on Rails 5 and its newly-introduced ActionCable, as well as Keen.IO's Ruby SDK.
Jan 10, 2019 • 20 Minute Read
Introduction
Data analytics is one of today's biggest trends. An increasing number of industries rely on metadata analysis to make decisions and gain competitive advantage. As such, more and more software products, from sleep-cycle mobile apps to enterprise logistics software are becoming coupled with in-depth analytics.
However, making sense out of data tends to be a tedious and tricky process. Building a meaningful dashboard requires a lot of changes both to your back-end architecture and to your front-end visualizations. This is where Keen.IO can be very helpful.
Keen.IO is a SaaS (Software-as-a-Service) solution that makes analyzing data and building dashboards easy, fast, and efficient. It comes with a developer-friendly API that covers the whole process: collecting data, analyzing it and visualizing it. It also comes with SDKs that can be used in a plethora of technologies.
In this guide, we are going to creating a reactive web dashboard from scratch by using Ruby on Rails 5 and its newly-introduced ActionCable, as well as Keen.IO's Ruby SDK. Let's get started!
Setting up
Connecting your Rails app with Keen.IO
First, open your terminal and make a new Rails 5 application. You need to have Ruby 2.2.4 up in order to do this:
rails _5.0.0_ new reactivedashboard
Once the application is generated, go to its directory:
cd reactivedashboard
Add the following gems to your Gemfile:
      #Gemfile.rb

gem "keen"
gem "dotenv-rails"
gem 'bootstrap-sass', '~> 3.3.6'
gem 'sass-rails', '>= 3.2'
Install the gems:
bundle install
What do these gems do? The keen gem makes Keen.IO's Ruby SDK available in the Rails app, dotenv-rails lets you save your Keen.IO APi credentials securely, and bootstrap-sass gives things a cleaner and crisper look.
In order to set up Boostrap, go to app/assets/stylesheets/application.scss: and insert the following lines:
      // "bootstrap-sprockets" must be imported before "bootstrap" and "bootstrap/variables"
@import "bootstrap-sprockets";
@import "bootstrap";
Now that the bootstrap CSS is set, let's move onto the more important things:
Getting your credentials
Connect to Keen.IO by using environment variables. Environment variables configure an application's behavior in different environments (development, staging, production, etc.). Environment variables must always be kept secret, since some of them may give out sensitive information about your application. One way to do this is using the [dotenv-rails]((https://github.com/bkeepers/dotenv) gem, which is included in the list of required gems above.
Go to Keen.IO's website and register your free account. Once you register, log in and create your first project. Once you've created this project you will see project credentials in the overview tab. Some things that will be available to you:
- Project ID: The unique identifier of your project
- API credentials:
- Write key - used when you want to publish data to your collections
- Read key - used for running queries and reading data from your collections
- Master key - used for deleting records and collections
In the root of your Rails application, create a new .env file.Put the following snippet in it:
      KEEN_PROJECT_ID=YOURKEENPROJECTID
KEEN_MASTER_KEY=YOURKEENMASTERKEY
KEEN_WRITE_KEY=YOURKEENWRITEKEY
KEEN_READ_KEY=YOURKEENREADKEY
Then, open up your first Keen.IO project's dashboard and replace the placeholders with your credentials in the corresponding fields.
With the keen gem installed and your API credentials inserted in your .env file, you are ready to publish, delete and update events in Keen.IO through your Rails app.
Publishing your data
Keen.IO uses collections that represent different types of events which occur in your application. A collection can contain all sorts of data you would like to record, from clicks made by a user to purchases made through your application.
In this guide, Keen.IO will keep track of the instances when a particular model is created. Let's call the collection products or products_created. A product_created event will have a name, a description, the number of times it's been favorited, and a price.
Let's scaffold the product model:
rails g scaffold product price:decimal name:string description:text favorites:integer
rails g scaffold will generate all the views, controller actions, model and database migrations you need to make to have a CRUDproduct model. Add the model to your database:
rails db:migrate
To start populating data into Keen.IO, add tollowing snippet to your product model:
      #app/models/product.rb

class Product < ApplicationRecord
  after_save { Keen.publish 'products' , self }
end
after_save is a callback hook which is executed every time a product in our application's database is created. The Keen.publish method provided by the Keen.IO's Ruby SDK accepts two parameters. The first is the collection to be interacted with and the second parameter is the data/event that we would like to track or publish. In this case, self refers to the particular instance of the model itself. Thus, every time a particular object is created, we are going to send the parameters associated with the Product model (name, price, favorites, etc).
Recording events vs recording entities When you are doing analytics, you must always think about data in terms of events, not collections. In this tutorial, we are not recording the products themselves, we are only recording the event of their creation. The product entity should stay in the database of the application. What's important is the data each event generates. Read more on the topic here.
Start your Rails server
rails s
Go to https://localhost:3000/products/new and create some products. After you have added a few products, go to your Keen.IO's project dashboard. Under the overview tab you will be able to see your newly-created collection and event occurrence times.
Analyzing your data
The next step is to start making sense out of the whole data that has been entered. At this point, a software development team would try to devise the numerous ways to represent the data in a meaningful format. Thankfully, Keen.IO's data analysis API does all this for you. It gives you options to select the core analysis types:
- Sum - calculate the sum of numeric values in a collection
- Average - calculate the average of numeric values in a collection
- Minimum - return the minimum, of all numeric values in a property
- Maximum - return the maximum of all numeric values in a property
- Percentile - calculate a percent of a given property in a colleciton
- Median - get the median value of all numeric values of a given property
- Count and count_unique - count either all instances or just the unique occurences of values of a given property
- Select and select_unique - select a list of values found for a given property
You can also input query parameters to group your data, sort, or filter it in terms of:
- Timeframe - Calculate values for a given timerframe
- Interval - Calculate values from the currenty minute up to the current year.
- Filter - Refine your serach by filtering out values for given properties
You can also combine multiple queries and collections using funnels for more advanced analytics.
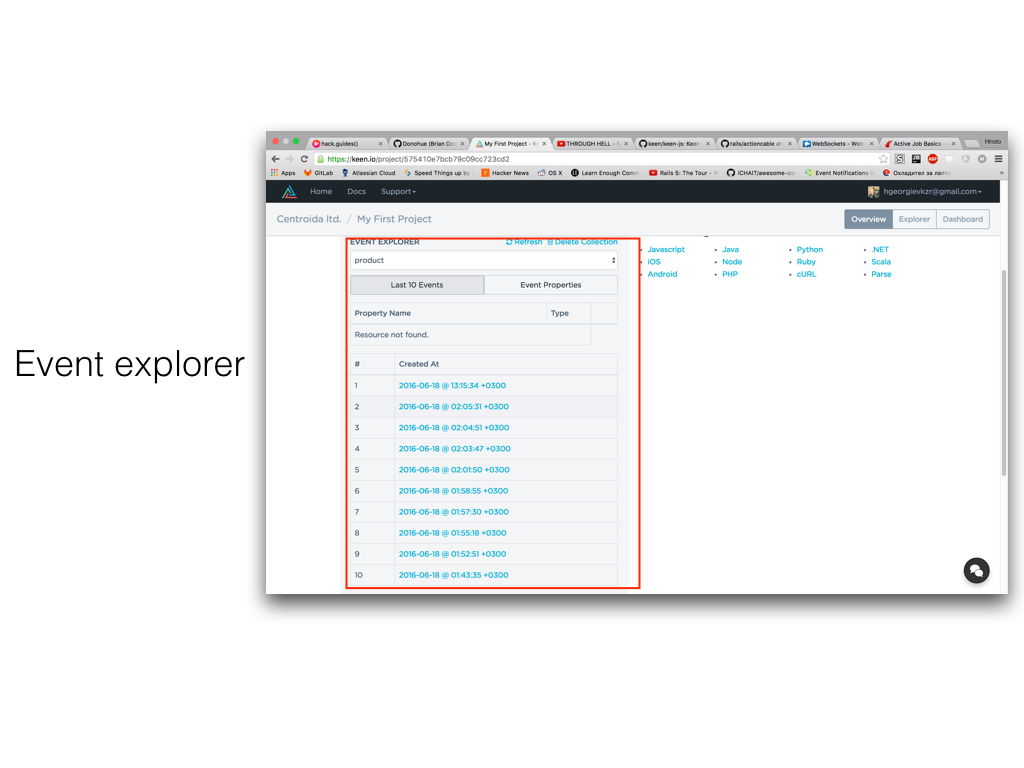
Exploring data
You can start playing with the events collected in Keen.IO using its explorer. To access it, go to your project overview and click on the explorer tab on the top right. You can also download the explorer and use it locally.
Using the explorer's UI, you can leverage all the analysis types and apply the filters easily:
Creating and saving queries
In your explorer, select count as the analysis time, products as the collection type, and this month as the time frame. Click on the run button to unveil the results.
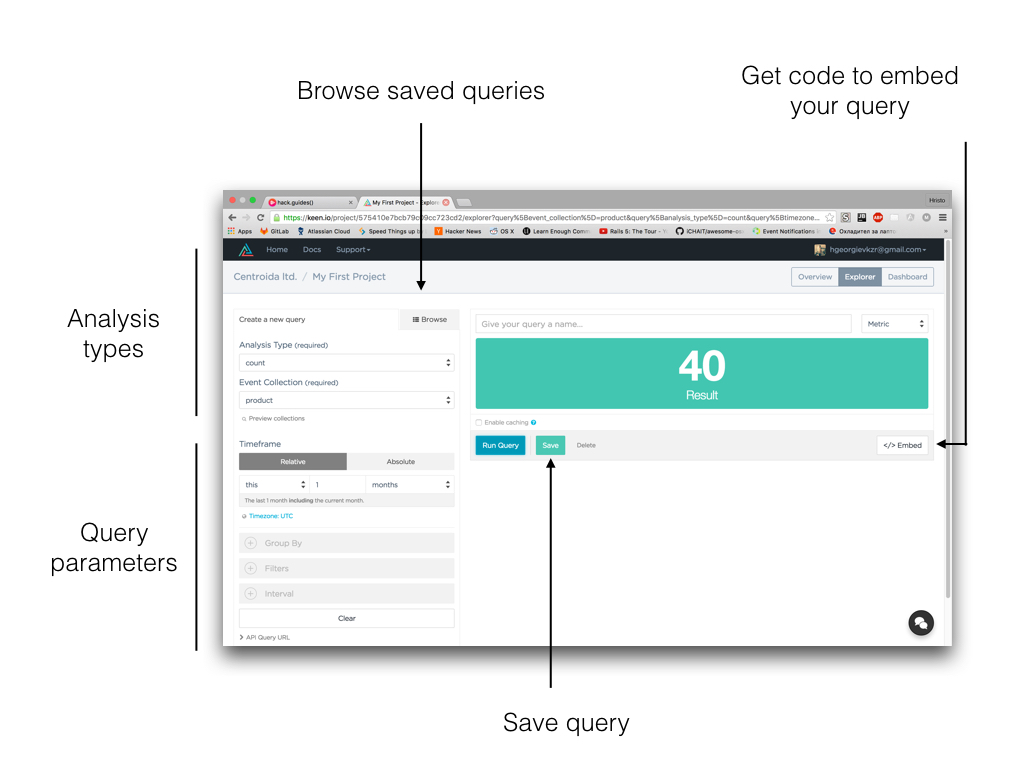
Voila! You just created your first query. You can save your query and reuse it any time you want. You can also visualize the data differently (if applicable) by choosing from the different types of visualizations in the top right (next to the field for the query name).
The next step is to click on the embed button on the right and get the code for displaying the query for the next step in the guide:
      var client = new Keen({
  projectId: "YOURKEENPROJECTID",
  readKey: "YOURKEENREADKEY"
});

Keen.ready(function() {
  var query = new Keen.Query("count", {
    eventCollection: "product",
    timeframe: "this_14_days",
    timezone: "UTC"
  });

  client.draw(query, document.getElementById("my_chart"), {
    // Custom configuration here
  });
});
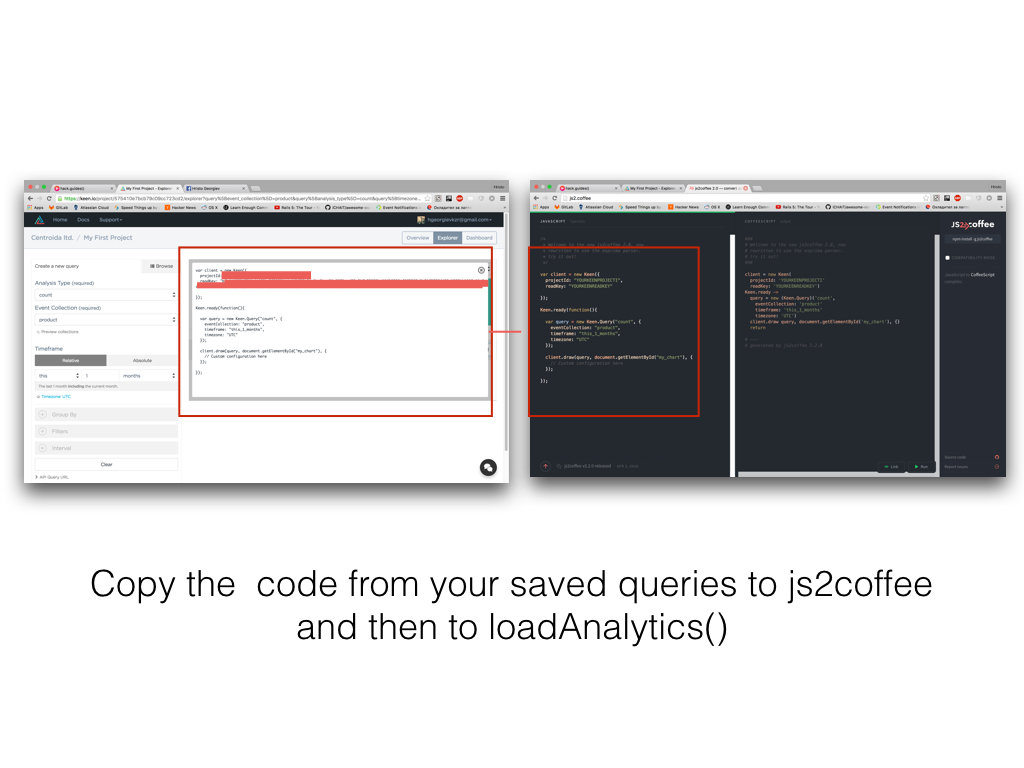
You can continue playing with the explorer and create one or two more queries. Make sure you save them because you are going to need the code for embedding in the next step of the guide.
Visualising your data reactively
After collecting data and analyzing it, we will build the dashboard. First, include the Keen.IO JavaScript SDK in the Ruby on Rails application. There are many ways to do this, but for the sake of simplicity, you can simply include the javascript file from a CDN (content delivery network) into your application layout:
      <!-- app/views/layouts/application.html.erb -->
<html>
  <head>
    <!-- Paste this line in the head section of the layout -->
    <%= javascript_include_tag "//cdn.jsdelivr.net/keen.js/3.4.1/keen.min.js" ,'data-turbolinks-track': 'reload'%>
  </head>
  <!-- content -->
</html>
Next, let's create an action and a view for the dashboard:
      #app/controllers/products_controller.rb
class ProductsController < ApplicationController
  #...
  def dashboard
  end
  #...
end
Add the following line to routes.rb in order to make the dashboard the root action of the application:
      #app/routes.rb
Rails.application.routes.draw do
  root to: 'products#dashboard' #set the dashboard as your root
  resources :products
end
Lastly, create a view for your dashboard action:
      <!-- app/views/products/dashboard.html.erb -->
<nav class="navbar navbar-default">
  <div class="container-fluid">
    <div class="navbar-header">
      <a class="navbar-brand" href="#">
        Keen Dashboard
      </a>
    </div>
    <ul class="nav navbar-nav navbar-right">
      <li><%= link_to 'All products', products_path%></li>
    </ul>
  </div>

</nav>
<div class="container-fluid">
  <div id="alert-placeholder"></div>
  <div class="row">
    <div class="col-md-6" id="chart-wrapper">

    </div>

    <div class="col-md-6" id="pie-wrapper">

    </div>
  </div>
  <div class="row">
    <div class="col-md-6" >
      <div class="col-md-6" id="total-wrapper">

      </div>
    </div>
  </div>

</div>
The view contains a simple bootstrap header and a few columns with id. The div tags with id chart-wrapper, pie-wrapper, and total-wrapper are going to be used as references for putting the analytics elements into the document.
Implementing reactivity
Reactive analytics means that our data visualization strategy will change automatically (without refreshing the page) as the data in Keen.IO changes. Ruby on Rails 5 make this easy through ActionCable. ActionCable is a Rails 5 module that introduces an API for working with WebSockets in Ruby on Rails.
The first step is to generate a channel. In your terminal, execute:
rails g channel analytics
The command will create a server-side representation of the channel in app/channels directory and a coffeescript file in app/assets/channels for handling the client side of the channel.
First, you need to explicitly define the name of the channel through which the analytics information is going to be streamed.
      #app/channels/analytics_channel.rb
class AnalyticsChannel < ApplicationCable::Channel
 def subscribed
   stream_from "analytics_channel"
 end
 #...
end
A channel usually has multiple instances. As such, steam_from is used to further specify the channel. For example, one channel can have instances that broadcast to multiple users. In such cases, the parameters entered in stream_from would include a unique identifier. But, in this guide, we are doing it the simpler way, by hardcoding a string.
Second, you need to create a job that is going to broadcast to the analytics_channel every time the an event is published to Keen.IO. We are putting our broadcast in a job because jobs can run parallel to other application processes. This ensures that your application will be able to queue multiple simultaneous requests for broadcasts.
Open your terminal and generate the job.
rails g job UpdateAnalytics
In order to maintain reactivity, the job has to be queued to broadcast every time that an event is published to Keen.IO. In this guide, we are doing it only once -- when creating a new product:
      #app/models/product.rb
class Product < ApplicationRecord
  after_create_commit do
    #publish the product creation event to Keen.IO
    Keen.publish 'products' , self
    #broadcast the job to update the analytics
    UpdateAnalyticsJob.perform_later self
   end

    #...
end
In the job itself, add a call to broadcast to the analytics_channel:
      #app/jobs/update_analytics_job.rb
class UpdateAnalyticsJob < ApplicationJob
  queue_as :default

  def perform(product)
    ActionCable.server.broadcast 'analytics_channel', product: product
  end
end
That's it! The back-end is set up. Let's move to the front-end and put the Keen.IO JavaScript SDK library that was previously added in the appication's layout to use.
Visualizing queries
Go to app/assets/javascripts/channels/analytics.coffee
There, you can see three functions: connected(), disconnected(), and received().
connected() is called when the client connects to the server-side websocket, disconnected() is called in the opposite case, and received() is called when data is broadcasted from the server.
Outside of these functions, declare a global function that is going to be called to reload all the queries and visualize them on the dashboard:
      App.analytics = App.cable.subscriptions.create "AnalyticsChannel",
  connected: ->
      loadAnalytics();

  disconnected: ->
    # Called when the subscription has been terminated by the server

  received: (data) ->
      loadAnalytics();


@loadAnalytics = () =>
  #paste the embed code from Keen.IO here
@loadAnalytics (@ denotes a global function in CoffeeScript) is going to be called when the client connects to the server-side channel, when there is data received from the channel, and when displayed in the view itself.
Remember that we've already established the server-side and client-side operations, so the only thing missing is the call from the view itself. Let's add it:
      <!-- app/views/products/dashboard.html.erb -->

<!-- put this in the bottom of the document -->
    <script>
        loadAnalytics()
    </script>
Now, go to your Keen.IO explorer and start getting the embed code from your favorite queries. Use js2.coffee to transpile the javascript to coffeesscript.
Here is an example with three queries displayed in the different div wrappers:
      @loadAnalytics = () =>
  client = new Keen(
    projectId: 'YOURKEENPROJECTID'
    readKey: 'YOURKEENREADKEY')
  Keen.ready ->

    allProducts = new Keen.Query("count", {
      eventCollection: "product",
      timeframe: "this_1_months",
      timezone: "UTC"
    });


    favoritesDist = new Keen.Query("count_unique", {
      eventCollection: "product",
      groupBy: [
        "name"
      ],
      targetProperty: "favorites",
      timeframe: "this_14_days",
      timezone: "UTC"
    });

    productsCreatedToday =  new Keen.Query("sum", {
      eventCollection: "product",
      interval: "daily",
      targetProperty: "id",
      timeframe: "this_14_days",
      timezone: "UTC"
    });

    client.draw productsCreatedToday , document.getElementById('chart-wrapper'), {}
    client.draw favoritesDist, document.getElementById('pie-wrapper'), {}
    client.draw allProducts, document.getElementById('total-wrapper'), {}
First, we initialize the client with the credentials of the project provided by Keen.IO. Keen.ready is called when the HTML document is loaded and the queries are ready to be visualized. Keen.Query takes two arguments. The first argument is the analytics type, and the second argument is an object that contains details about the collection, interval and filters. Have look at Keen.IO's JavaScript SDK for more information on creating queries.
client.draw is the function that does the drawing. The first argument is the query, and the second argument is the selected element from the HTML document.
Go to https://localhost:3000 and see the results. You now have a functioning dashboard that displays and automatically synchronizes each time that the product collection is modified.
To test out reactivity, open browser windows with https://localhost:3000/products/new and https://localhost:3000. Then, try to create a new product.
Creating a dashboard through Keen.IO
If you'd want to test out a dashboard layout or see how your queries visualize all at once, Keen.IO offers a dashboard builder.
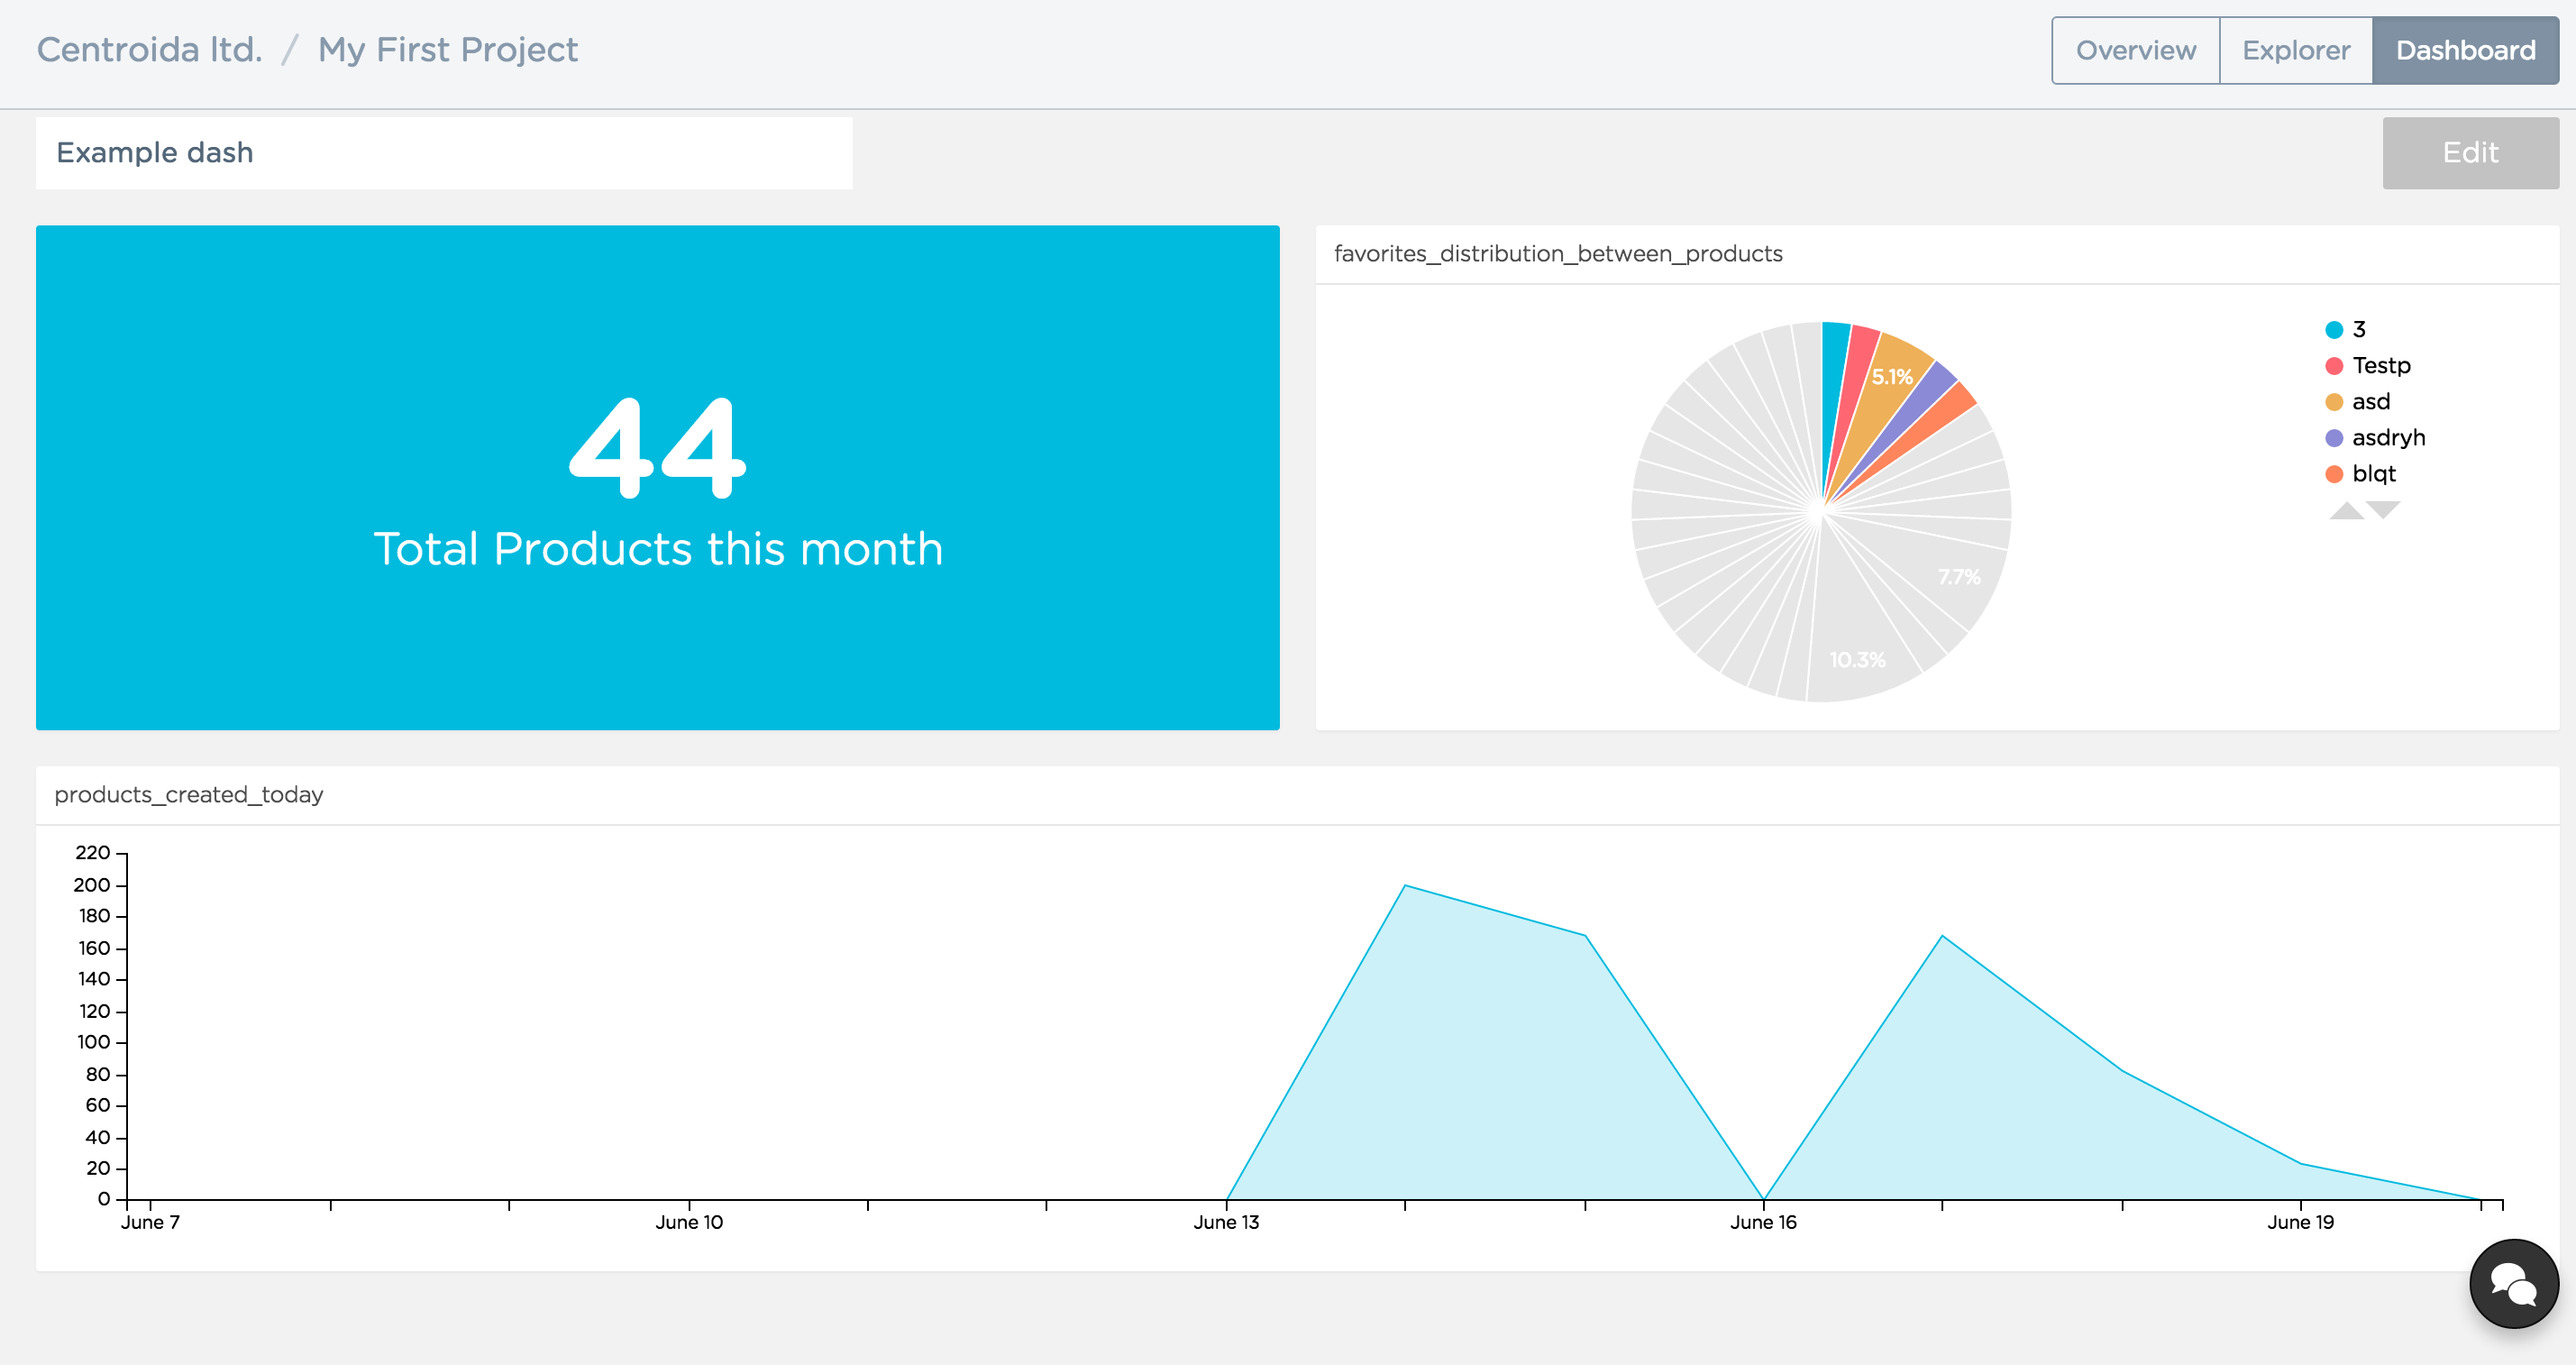
Dashboard items are distributed in rows in columns, the same way it is done when building a web applicaiton.You can pick your saved queries and distribute them in the dashboard.
That was all! I hope you found this tutorial interesting. If you missed out some of the parts or need a reference on the code, I have created a GitHub repository that contains the code from the tutorial.
Please favorite this tutorial and leave your comments and feedback in the comments below!
Advance your tech skills today
Access courses on AI, cloud, data, security, and more—all led by industry experts.
