Red Sqirl - Data Analytics platform introduction
Are you a novice to working with big data analytics? Use Red Sqirl as your secret weapon to data science without having to become an out-and-out expert.
Jan 10, 2019 • 16 Minute Read
Introduction
Over the last two years, I have been working on a program that makes it possible for novices to work with big data analytics.
Red Sqirl is a web-based big data application that simplifies the analysis of large data sets. With Red Sqirl, you can quickly access the power of the Hadoop eco-system, analyzing massive amounts of data rapidly and cost-effectively. It is an open platform that users can extend, thereby simplifying the Hadoop ecosystem (Hadoop, Hive, Pig, HBase, Oozie, etc) because you no longer have to master each of those underlying technologies. This makes Red Sqirl optimal for enhancing the productivity of data scientists.
Red Sqirl accesses your data through third-party processing and storage engines and organizes them into packages. For example, the Red Sqirl Pig package gives you access to Apache Pig. Red Sqirl also classifies a reusable piece of analyses into models.
Furthermore, Red Sqirl is open-source and Free.
You can learn more at www.redsqirl.com
Additionally, a video version of this tutorial is available: https://youtu.be/LL6adYq4YL4

The idea here is to give a glimpse of Red Sqirl's abilities.
Summary
- Step 1: Learn about the Red Sqirl interface
- Step 2: Learn how to copy data into HDFS
- Step 3: Learn how to build a workflow
- Step 4: Learn how to run that workflow
- Step 5: Learn how to extract the result from that workflow
Red Sqirl is a platform that you can install directly on top of a Hadoop Cluster. This tutorial requires the Red Sqirl Docker image.
At this point we’ll assume you already know what Red Sqirl is, and that you’ve installed it successfully.
If you want to follow along with this tutorial step by step on your local environment, you’ll need to know where the Red Sqirl installation folder is (/opt/redsqirl-2.6.0-0.12/) and have Red Sqirl Pig package already installed.
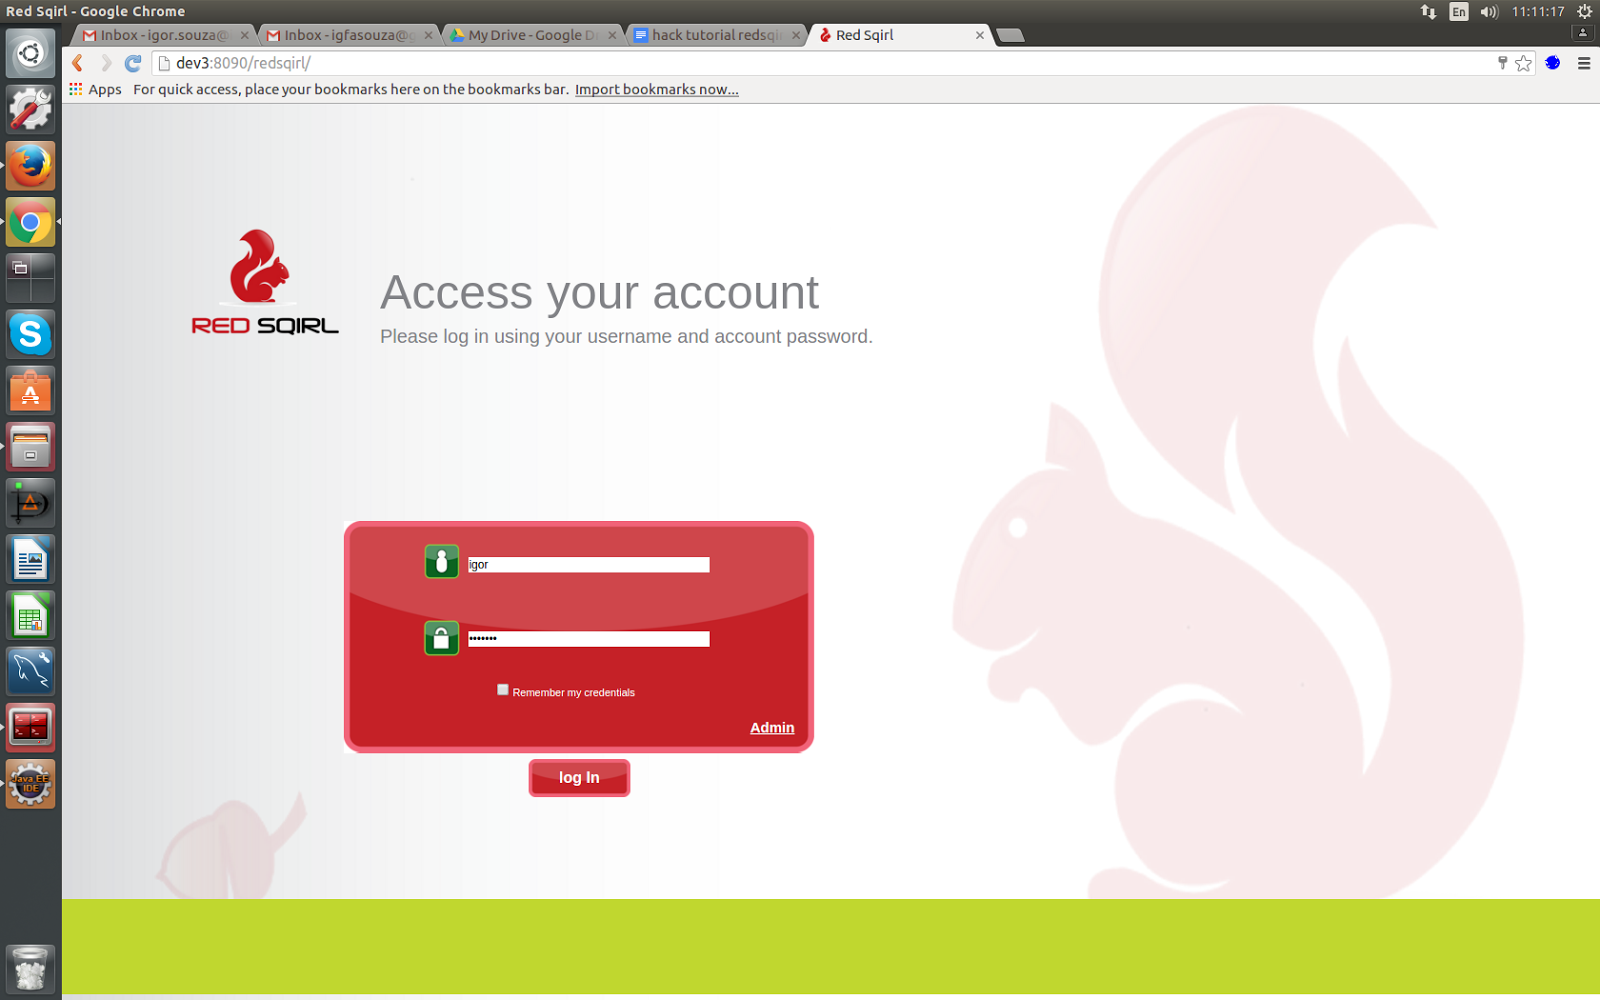
To Sign in, we’ll just use the OS username & password that you used to install Red Sqirl.
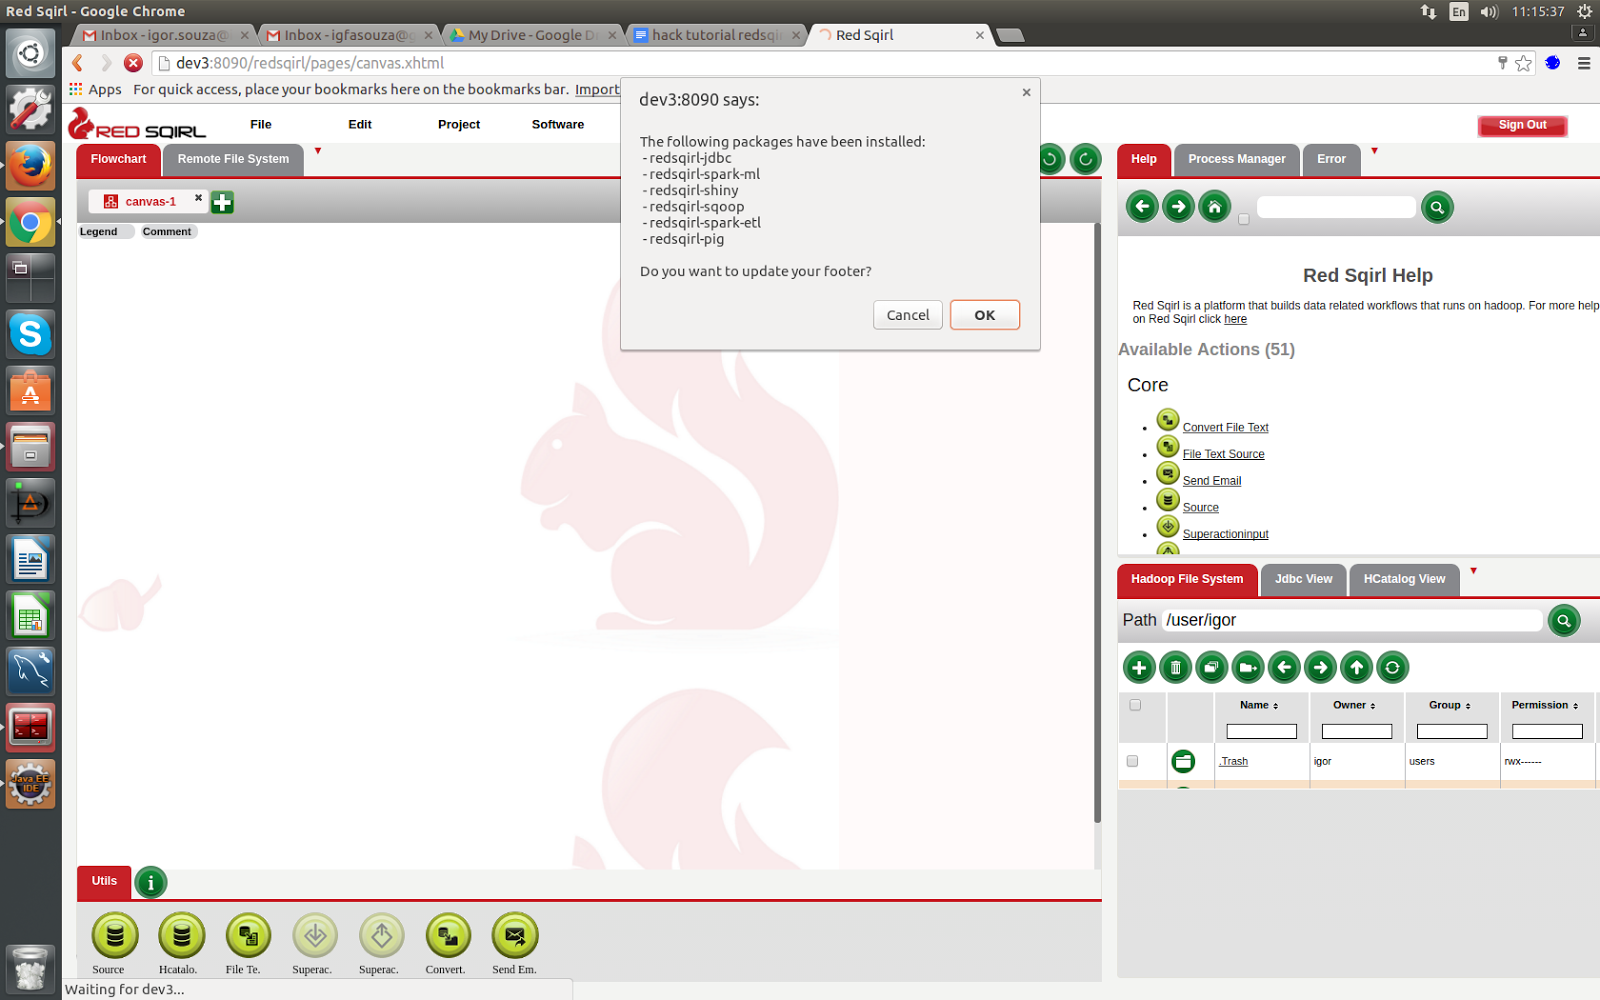
If you’re signing in for the first time, you’ll be prompted with a window about updating your footer menu. Click OK.
Step 1: Learn about the Red Sqirl interface
So this is our Red Sqirl interface. As you can see, it’s made up of three main sections.
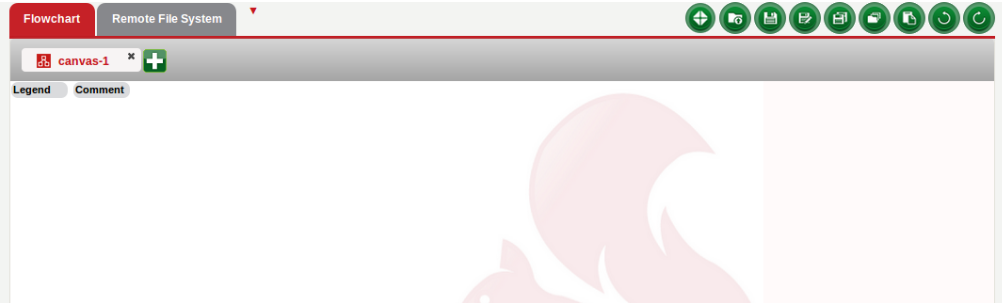
Section 1: On the left we have two tabs
- The flow-chart canvas: this is where the workflow will be executed.
- The remote file system: the system through which we can connect to any ssh (Secure Shell) server.
**The flow chart canvas: **
The flow chart canvas is where we create a data analysis workflow. It also contains the actions that we can use for our analyses. We’ll find it at the bottom, in the canvas footer.

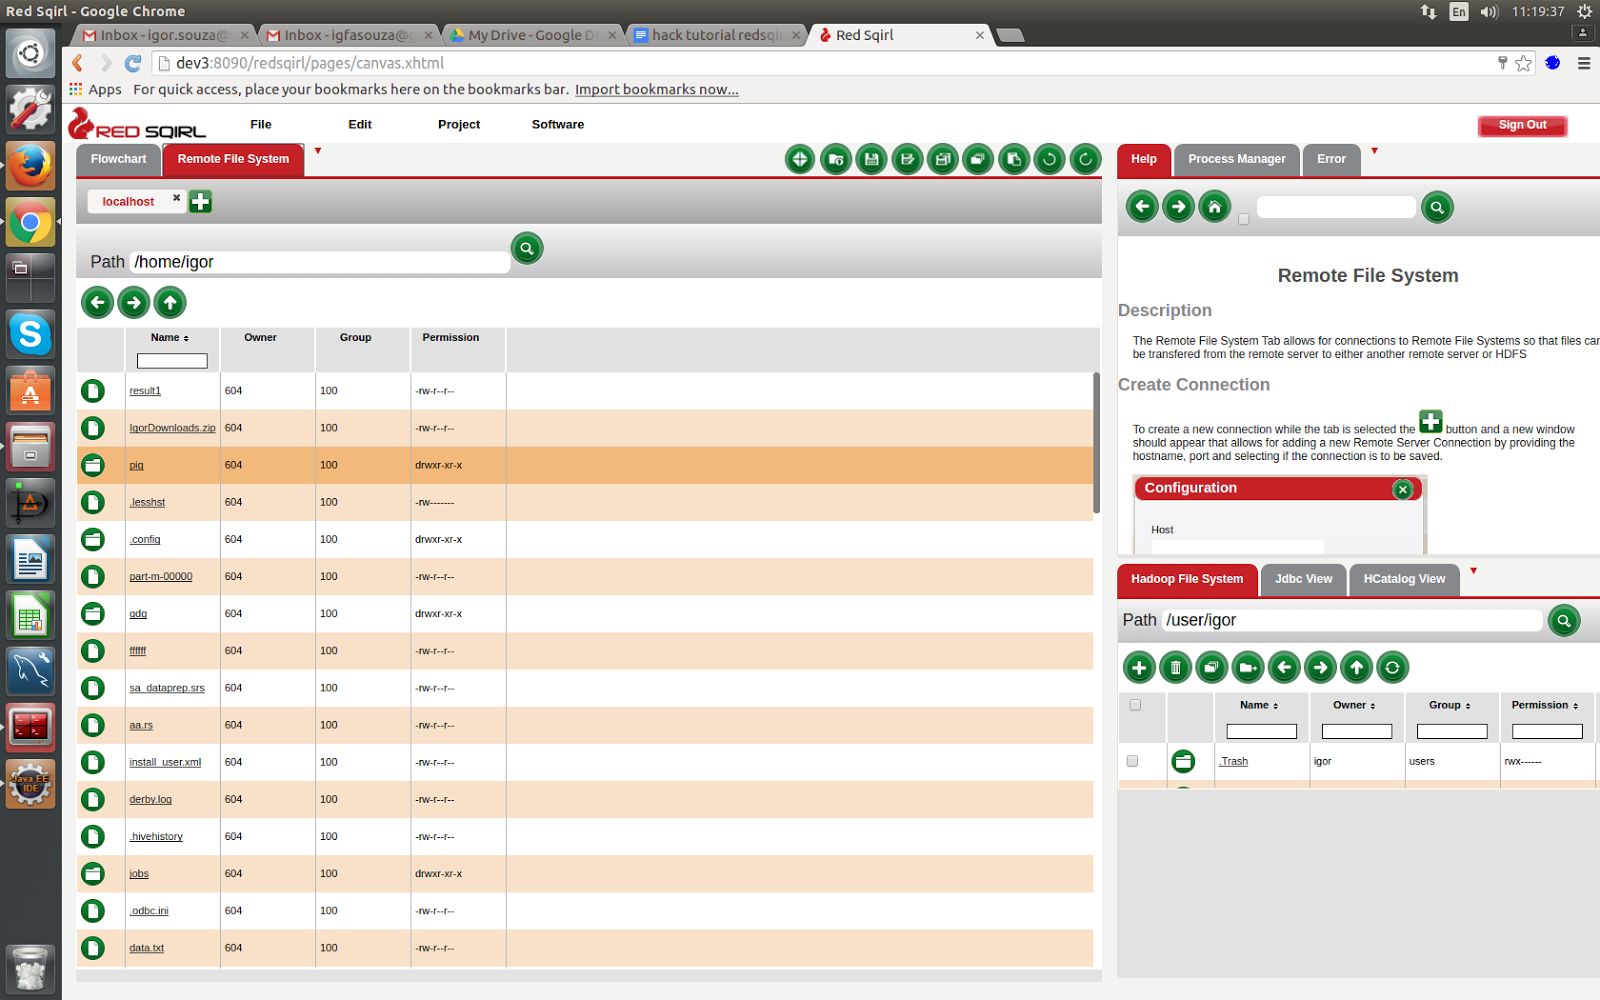
** The remote file system: **
This is where we can connect to any ssh server. For instance, you can ssh localhost, which will correspond to the server that Red Sqirl is installed on.
Click on the remote file system tab and then click on the plus button. Then fill out the form as necessary. Now we can see our remote file system.
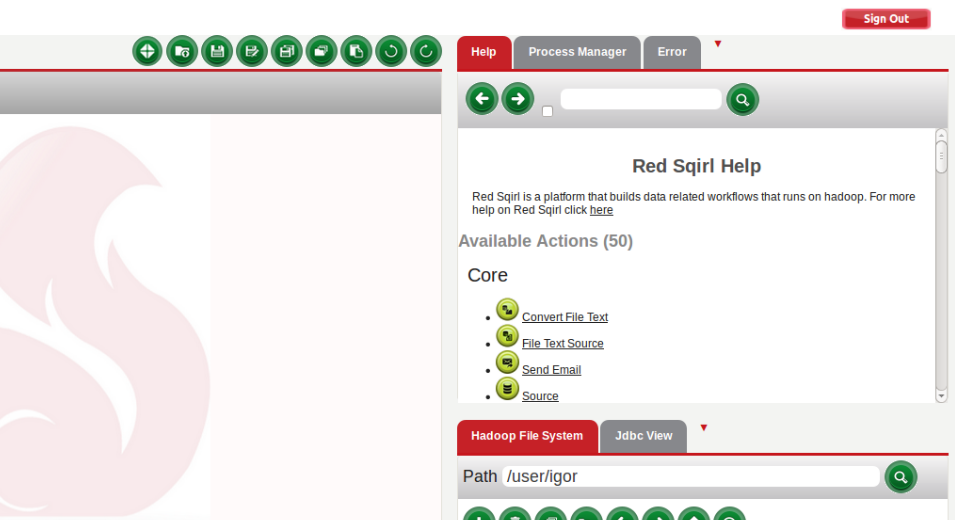
Section 2: On the top right is the help tab
The help tab is made up of:
- A main section where we can find the generic options
- An action section
- We can find the action section by clicking this Home button,
- This section describes each of the drag & drop actions that we can use.
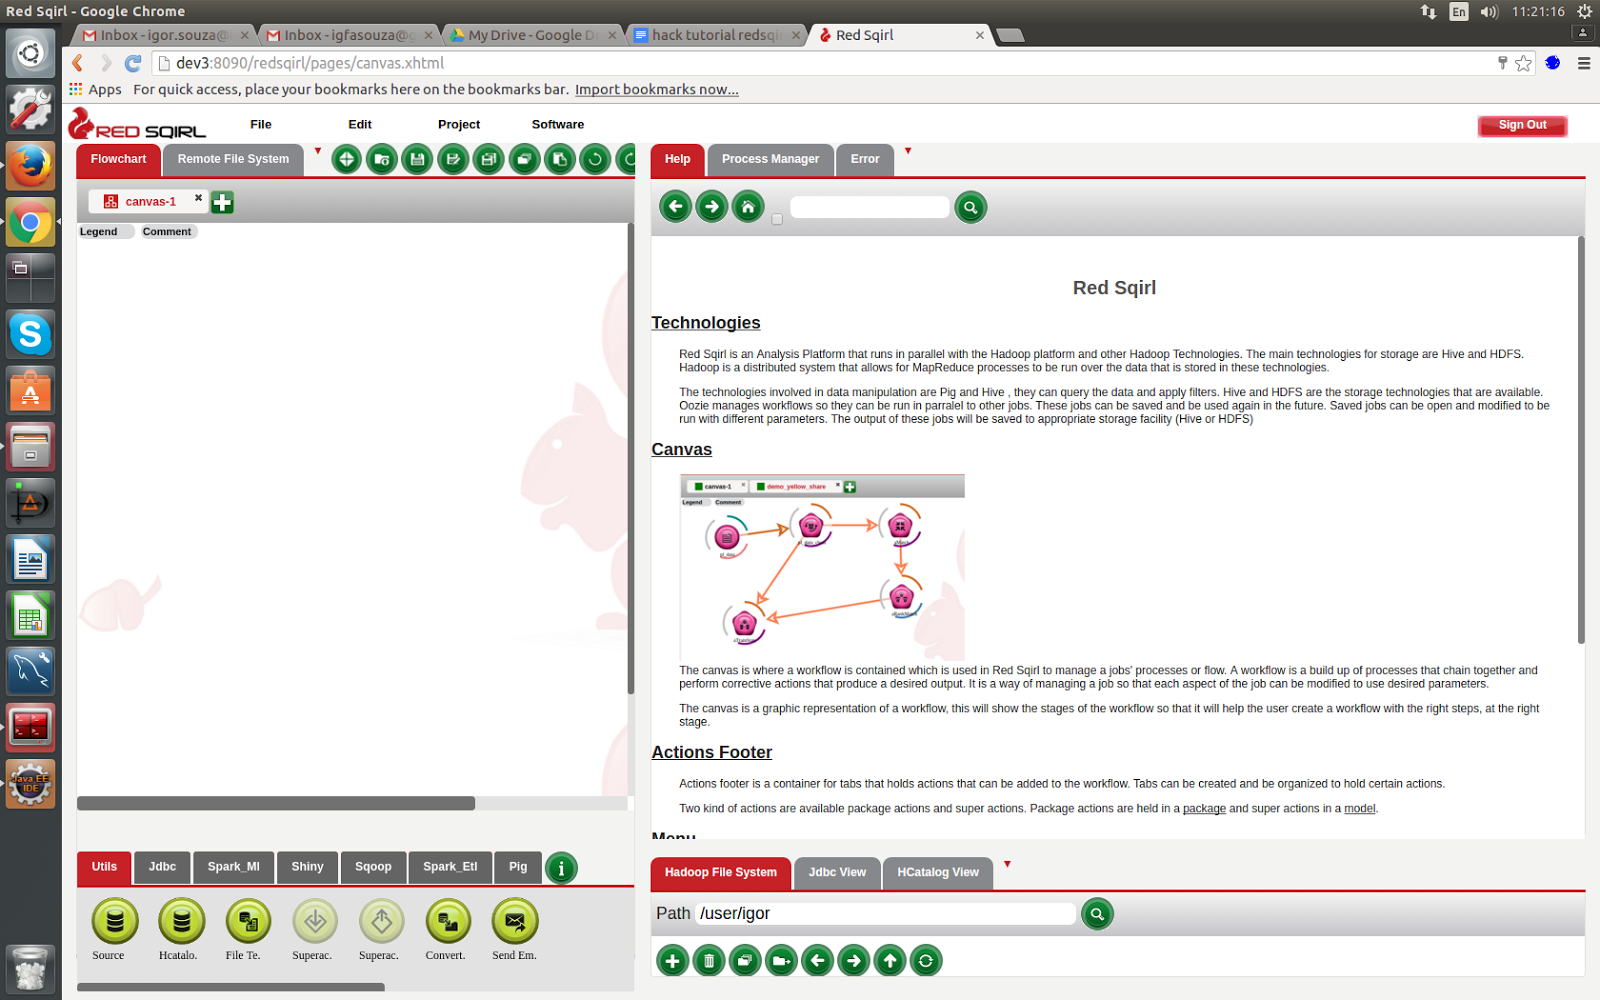
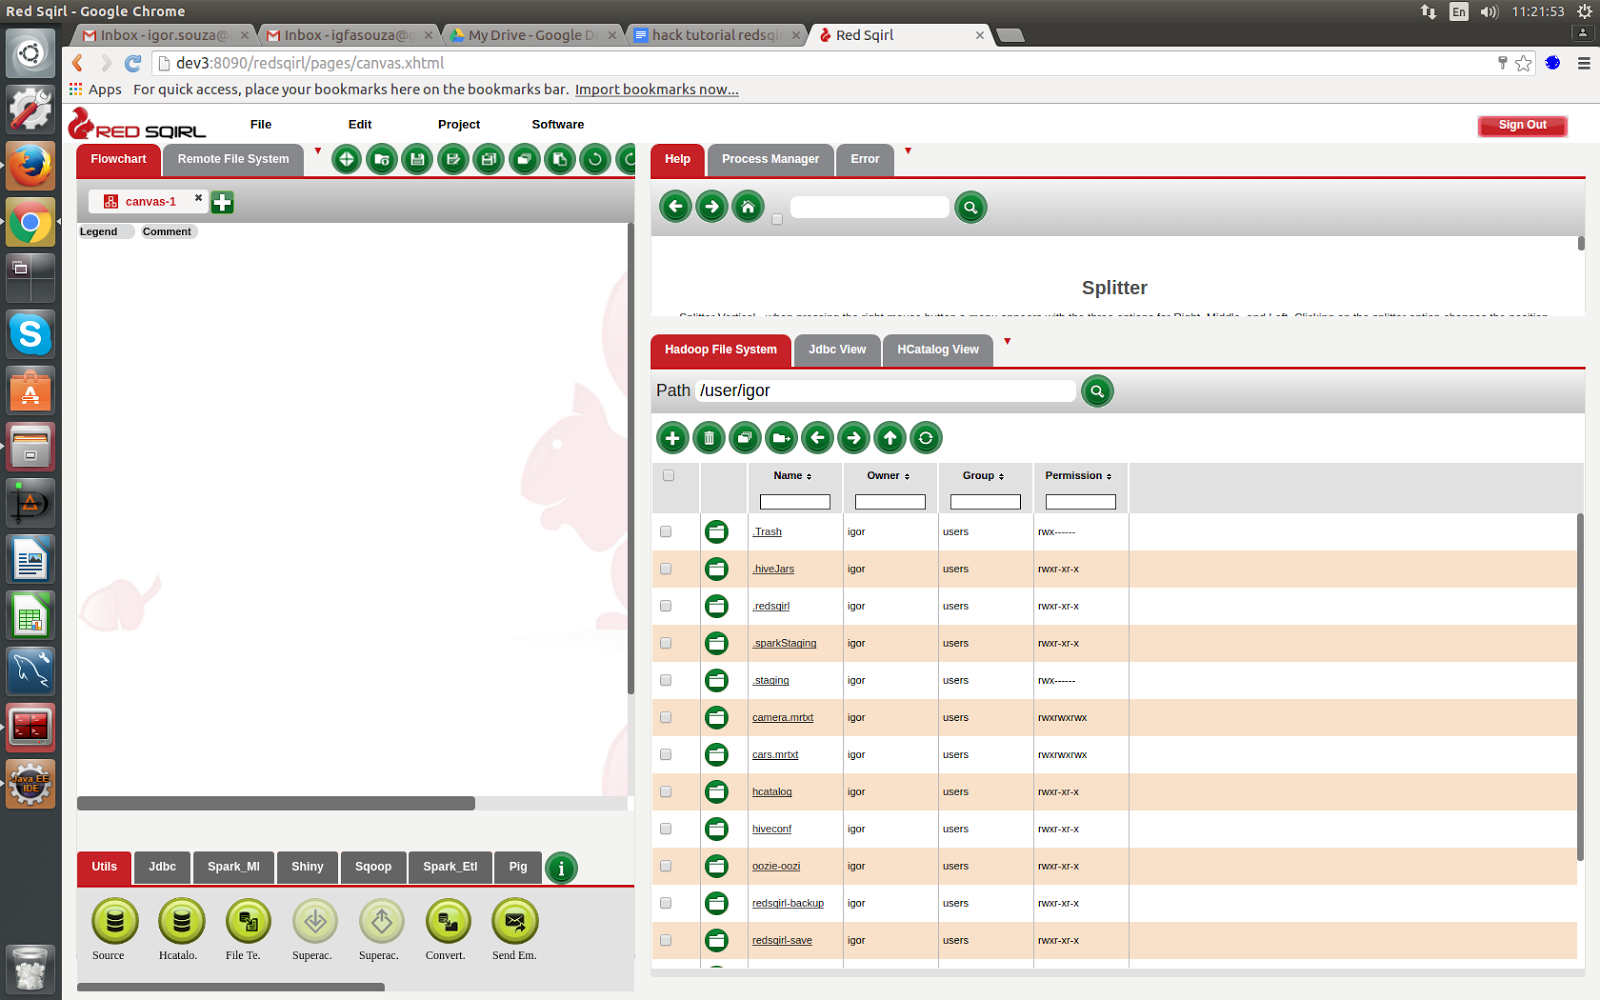
Section 3: On the bottom right, we have the Hadoop Distributed File System
These are the three main parts of the Red Sqirl interface.
Step 2: Learn how to copy data into HDFS
Inside the Red Sqirl installation folder we’ve already given you some data for this tutorial. So what we need to do now is copy this data into our HDFS (Hadoop Distributed File System).
To do this we’ll first go back to the Remote File System.
- Go into the Red Sqirl installation folder, in my case it is /opt/redsqirl-2.4.0-0.12
- Find the folder called “tutorial_data” and drag-and-drop it anywhere into our HDFS window.
There are a few different files in this folder. For this tutorial we’ll be using the file named getting_started.txt. Now we can click on tutorial_data and click on the getting_started.txt file.
Step 3: Starting your analysis
Go back to the flowchart canvas section.
- Configure the source for a HDFS file
- Select the sum of two columns
- Get the average of a column
- Get the sum of a column when grouping by another
- Join the two tables
- Filter a table with a condition
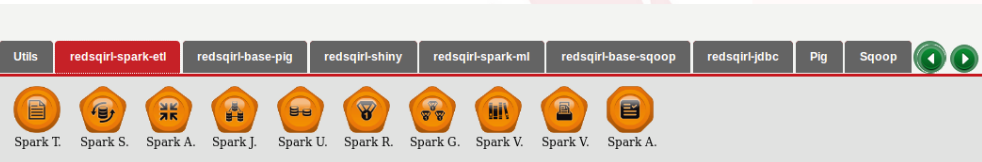
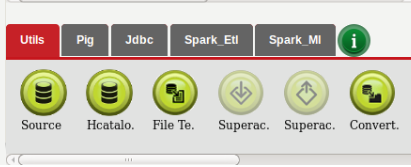
To accomplish these tasks, we first need to change the footer. The action footer is the little frame on the bottom left of the FlowChart tab.
- Click the green information symbol.
- Once the configuration popup has appeared in the left column click “+”.
- Type “extraPig” on the new empty line.
- Click the “...” symbol.
- On the new window, select redsqirl_pig in the drop-down menu
- Click on the check box next to pig_audit, and click on the Select button.
- Click OK.
- Click OK.
You should see a new footer tab called “extraPig” with “Pig Audit” inside. To remove this new menu, you need to do the following.
- Click the green information symbol.
- Click on the check box beside “extraPig”.
- Click on the Delete button (bin icon) in the table header.
- Click OK.
**Let’s analyze the data. **
- An analysis always starts with a source action, so let’s set this action up first.
- In the actions footer, drag a new source icon onto the canvas.
- Now we just double click on it to configure it.
- Name the action “communication“
- Comment the action “Configure tutorial data“.
- Click OK.
- Now we’ll see a step-by-step window.
- Select “Hadoop Distributed File System“ as the data type then click next.
- Select “TEXT MAP-REDUCE DIRECTORY” as the data subtype and click next.
- Next we have to chose the path, that we saved our file into.
- Click on the search button, and click the refresh button, then find the tutorial data file and then the getting started file pig_tutorial_data.mrtxt
- Click on the radio button beside pig_tutorial_data.mrtxt. If you cannot find it, refresh the view by clicking on the search button. Click OK.
- Our data is now in the source action. At this stage, you will see the data correctly displayed on the screen, the name of the fields are “Field1 Long, Field2 Long...”
- In this next step we can change the field name and its type by clicking the edit button on the top-left of the table
Let's rename the fields:
- Copy and paste “subscriber_number STRING , Friend STRING , offpeak_voice INT , offpeak_sms INT , offpeak_mms INT ,peak_voice INT,peak_sms INT , peak_mms INT , sna_weight INT , subscriber_onnet INT ,friend_onnet INT” into the value field
- Click OK. You will have the confirmation that the Header is correct.
- Click OK to exit from the Configuration window.
- If you leave the mouse cursor on the source action you will be able to see some configuration details
- Save the Workflow by going into File > Save, name it pig_tutorial. By default, it is saved in the redsqirl-save HDFS directory and the file will have the extension ‘.rs’. Click OK to save.
How do we view the modified data?
We can now see that the arcs around the source action icon have changed.
The arcs around the icons, give information about the status of that action.
To check what the arcs mean, just click on the legend on the top left of the canvas. To hide the legend, just click it again.
Let’s recap:
- We’ve gone through the interface
- We’ve copied our data into the HDFS
- And we’ve set up our source file and configured it
Now we’re ready to start processing data.
Set Up a Pig Aggregator Action (PAA)
The Pig Aggregator is an action in which aggregation methods are allowed to be used when selecting columns as you would in an SQL statement. These aggregation methods are AVG, MAX, SUM, and so on. This action will group by either the selected attributes or all, which is the default if no attributes are selected.
In the Pig footer menu, we can select the aggregator action.
-
Drag a PAA to the canvas.
-
Create a link between the source that was just configured and the new PAA by clicking between the image and the arc of the source action and then clicking on the pig aggregator image. (you’ll see an arrow connecting the two icons)
-
Open the new pig aggregator icon, name the element “nl_sum” and Click OK.
-
This first page lets us choose the field by which we want to aggregate. In this case, we want to aggregate by “subscriber_number” Select “subscriber_number” and click "Select" in the Group by interaction.
-
Click next.
-
On this second page we can do the operation field by field.
-
Select "copy" from the dropdown menu on the generator interaction and click OK. (We can also have a more granular choice of generation by clicking on the “Configure” button. Each Tab is a different configuration option.)
-
We can also sort the rows -- On the top of the table click the “+” symbol to add a new row to the table. One thing to note: the check box on each row is only used for sorting and deleting, we don’t need to have each row ticked in order to continue.
-
Click on the pen in Operation field of the new row and click the “SUM()” function and add the parameters “communication.offpeak_voice” and “communication.peak_voice”. In between the parameters add a “+” symbol so that the operation would read “SUM(communication.offpeak_voice + communication.peak_voice)”
-
click OK.
-
In the Field Name, type “total_voice” for the new column, and change the type to DOUBLE.
-
Click next.
-
The next page shows that we can sort the data. We won't sort it now, so click next.
-
The following page is about filter and format, click OK to leave the default parameters. (The filtering option is another text editor where we can just create a condition for filtering.)
-
We can choose the delimiter of the output, let’s use comma in the delimiter box. By default, the output type is compressed. In Red Sqirl the output format is important for linking one action to the next, the two types need to be compatible.
-
If we want we can also choose to do an audit of the output.
-
Click OK.
Step 4: Running the workflow
Go on menu click Project and click on “Save & Run”
This will take some time to run because Pig uses Map-Reduce.
- While this is running, the canvas can’t be modified. However, we can still create more workflows at this time.
- Click on a new tab and drag and drop something onto a new canvas
- We can create and run multiple workflows at the same time.
- Also while the workflow is running, we can check progress in the Process Manager on the right-hand side.
- Click on the Process Manager tab, and hit refresh. In here, we’ll see all of our processes This is also where you can pause or kill any running processes. We can also check the logs in the Oozie Control; just click on the left green button.
And that’s it!
As soon as the process is finished, we can see the results. Go to the Pig Aggregator Action, go into options, and click on “data output.” We can see the path at the top and we can download our results as a CSV.
Create another PAA
- Drop another Pig Aggregator onto the canvas.
- Make a link between the source and the new Pig Aggregator.
- Open it, and give it the name "comm_groupbyall" and click OK.
- This time leave the group by list alone so nothing is selected and click next.
- Create a new row (use the + button).
- In this new row copy and paste “AVG(communication.offpeak_voice + communication.peak_voice)”.
- Call the field “total_voice_avg” and select the DOUBLE type.
- Click next.
- Click next on the sorting page.
- Click OK on the final page.
Perform a Pig Join Action
To make each dataset interactable with each other it is necessary to perform a join on them.
- Drop a Pig Join onto the canvas.
- Create a link from “comm_groupbyall” to the new Pig Join Action.
- Create a link from “nl_sum” to the new pig join action.
- Double click the Pig Join and call it “nl_vs_total”.
- The first page lists the table aliases. Click next.
- On the following page, make sure that “copy” is selected as the generator and click OK.
- Click next.
- This page has two interactions that specify the join type and the fields on which to join. We'll use the default join type (“Join”).
- In “Join Field” column, type “1” in the two rows. This condition will join the two tables together.
- Click next.
- Click next on the sorting page.
- Click OK on the final page.
Step 5: Filter a Data set
Now we want to make a condition to see what subscribers have a higher total voice calls than the average of the entire dataset. The easiest would be to add the condition in Join, but we will create a new Pig Select Action for demonstration purposes.
- Drop a new Pig Select action onto the canvas.
- Create a link from the Pig Join Action to the new Pig Select Action.
- Open it and change the element ID to be “high_voice”.
- In the generation drop-down menu, select "copy" and click OK.
- Click next.
- In the Sorting page, select “nl_sum_total_voice” and “DESCENDING” order.
- Click Next.
- Click on the Pen in the Condition section and write “nl_sum_total_voice > comm_groupbyall_total_voice_av”.
- Click OK, and finish the action by clicking OK.
We would now like to store the “nl_vs_total” intermediate result before running the workflow. To save the result:
- Leave your mouse on “nl_vs_total”. Click Options button and select “Data Output” from the drop-down menu.
- Select “BUFFERED” instead of “TEMPORARY”.
- Click OK.
You can now “Save and Run,” and see your result in the Data Output of “nl_vs_total” and “high_voice.”
To see the results, leave your mouse on the action “nl_vs_total” or “high_voice”, > Options > Data Output. You can close it by hitting “Cancel” or “OK”
Once you are happy with the result you can clean all the data generated by this workflow by clicking on “Select All” and then “Clean Actions” in the “Edit” top menu.
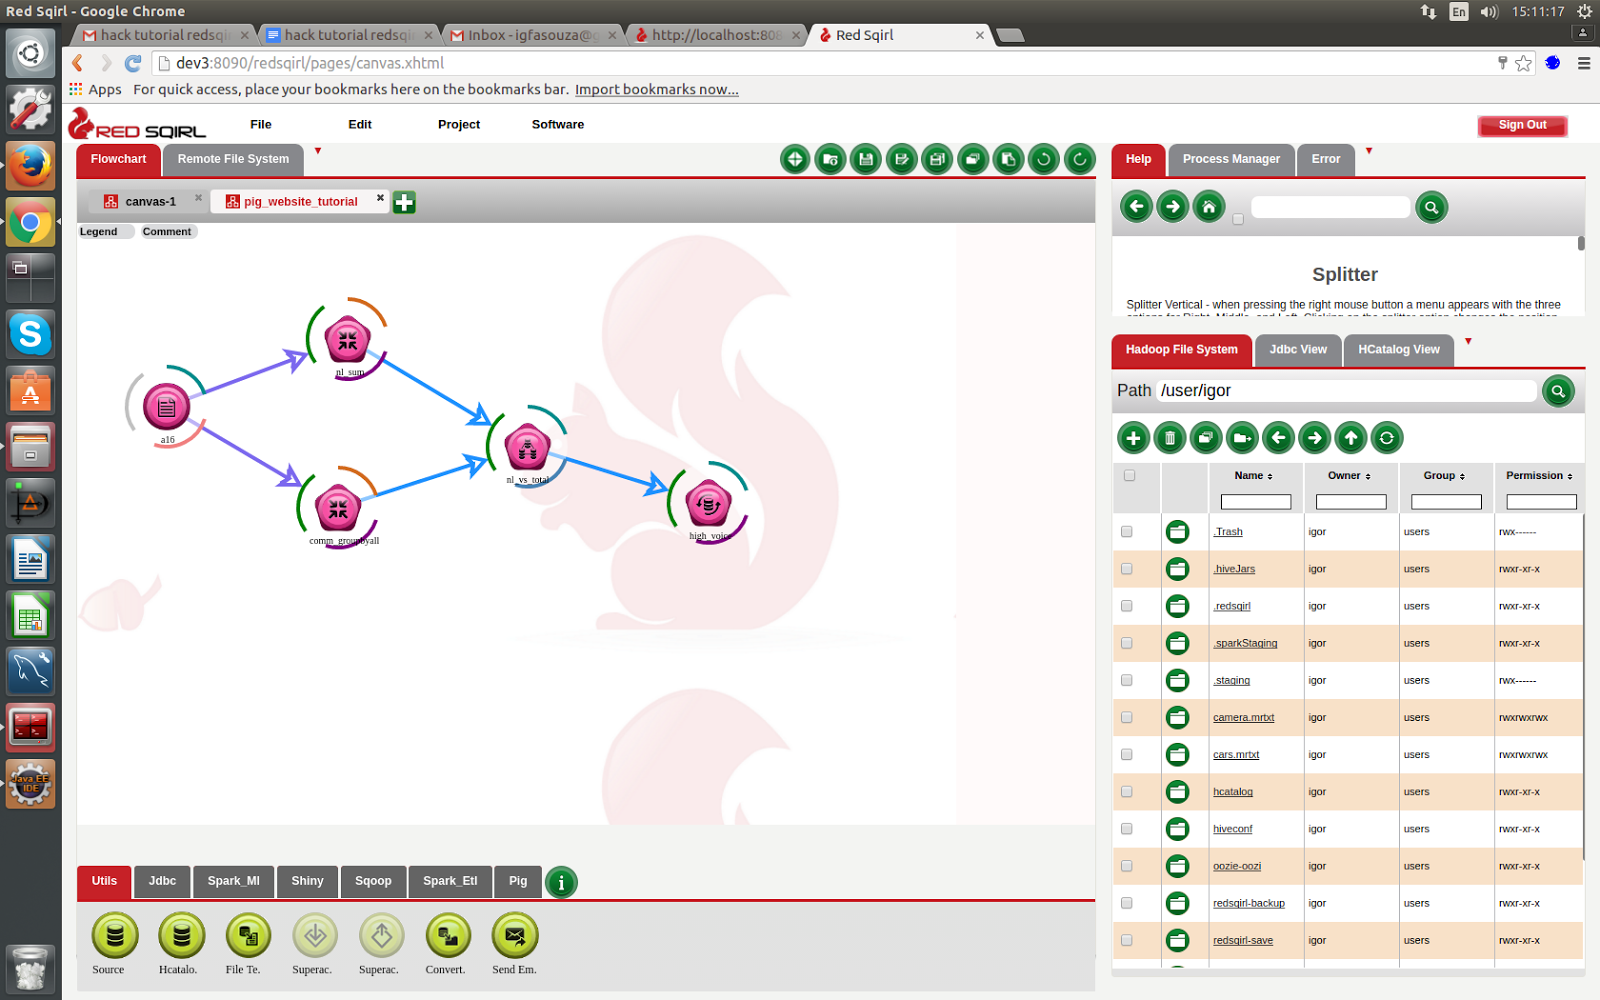
The final canvas should be something like this;
Conclusion
Red Sqirl is a program that simplifies and facilitates data analysis. Analysis methods in Red Sqirl are efficient; they are quickly created, easily shared, and easily reused.
In this tutorial, we
- Covered the interface
- Copied data into HDFS
- Built a workflow
- Extracted the results from that workflow
- Configured the source for a HDFS file
- Selected the sum of two columns
- Got the average of a column
- Got the sum of a column when grouping by another
- Joined two tables
- Filtered a table using a condition
Advance your tech skills today
Access courses on AI, cloud, data, security, and more—all led by industry experts.
