Capture Metrics for Cosmos DB using Application Insights
In this guide, you will learn how to use EventSource to capture the request charge of your Cosmos DB requests and push these metrics to Application Insights.
Oct 20, 2020 • 6 Minute Read
Introduction
One of the more difficult aspects of working with Azure Cosmos DB is managing the request unit consumption and provisioning. If you don't use request units efficiently, your Cosmos DB instance may be significantly throttled, negatively impacting users' experience.
In this guide, you will learn how to use EventSource to capture the request charge of your Cosmos DB requests. Then, you will push these metrics to Application Insights so that they can be analyzed in the context of your application. This can be useful for pinpointing which user or feature in your application is incurring high request charges.
To follow this guide, you will need an Azure Subscription with the latest Azure CLI.
Set Up the Azure Resources
To get started logging Cosmos DB metrics, create:
- An Azure Application Insights component
- A Cosmos DB database and container
The easiest way to do this is to use the Azure CLI:
      $rg = 'rg-demo-ai-cosmos'
az group create -n $rg -l 'australiaeast'

az extension add -n 'application-insights'
az monitor app-insights component create --app ai-cosmos-demo --location 'australiaeast' --kind web -g $rg

az cosmosdb create --name cosmos-metrics-demo-pl --resource-group $rg
This code snippet uses PowerShell and the Azure CLI to create an Application Insights instance, a Cosmos DB database, and an Application Insights component.
Then you need to create a .NET Application to start recording metrics.
You can also use the CLI to help you scaffold this:
      mkdir cosmos-metric-demo
cd cosmos-metric-demo
dotnet new sln
dotnet new web
dotnet sln add .
dotnet add package Microsoft.Azure.Cosmos
dotnet add package Microsoft.ApplicationInsights.AspnetCore
Create an Event Listener
.NET has a feature called Event Source that can publish low-level events that other tools and libraries can use. These tools are not able to modify data in the context of your application, like Diagnostic Source. Some examples of event source data that can be collected include SQL requests, garbage collection (GC) statistics, and memory allocations.
Cosmos DB implements Event Source, which publishes request and response events. You can create an event listener to listen for these events and write them to Application Insights.
The snippet below demonstrates how to do this:
      public class DocumentClientEventListener : EventListener
{
    private bool _initialised;
    public static AsyncLocal<RequestTelemetry> Request { get; }
        = new AsyncLocal<RequestTelemetry>();

    protected override void OnEventSourceCreated(EventSource eventSource)
    {
        if (!_initialised && eventSource.Name == "DocumentDBClient")
        {
            this.EnableEvents(eventSource, EventLevel.Verbose, (EventKeywords)1);
            _initialised = true;
        }
    }

    protected override void OnEventWritten(EventWrittenEventArgs eventData)
    {
        if (eventData == null || eventData.Payload == null || eventData.EventSource?.Name != "DocumentDBClient")
        {
            return;
        }

        // const int cosmosDBRequestEventId = 1;
        const int cosmosDBResponseEventId = 2;
        if (eventData.EventId == cosmosDBResponseEventId)
        {
            OnCosmosDBResponseEvent(eventData, Request!.Value);
        }

        static void OnCosmosDBResponseEvent(EventWrittenEventArgs eventData, RequestTelemetry? requestTelemetry)
        {
            if (requestTelemetry == null)
            {
                return;
            }

            if (eventData?.Payload?.Count != 30)
            {
                return;
            }

            if (eventData.Payload[22] is string requestChargeAsString
                && double.TryParse(requestChargeAsString, out double requestCharge))
            {
                const string key = "CosmosDBTotalRequestCharge";
                var metrics = requestTelemetry.Metrics;
                if (metrics.ContainsKey(key))
                {
                    metrics[key] += requestCharge;
                }
                else
                {
                    metrics[key] = requestCharge;
                }
            }
        }
    }
}
This class subscribes to the DocumentDBClient event source. When it sees that a response event has been published, it extracts the request charge and saves it to Application Insights' request telemetry. It uses AsyncLocal , which is a special class that allows you to create request scoped variables.
You will also need to create a piece of middleware to set the request telemetry property.
      // Startup.cs
app.Use((ctx, next) =>
{
    var requestTelemetry = ctx.Features.Get<RequestTelemetry>();
    if (requestTelemetry != null && DocumentClientEventListener.Request.Value == null)
    {
        DocumentClientEventListener.Request.Value = requestTelemetry;
    }

    return next();
});
This snippet needs to be added to the top of the Configure method of your Startup.cs.
Finally, update Program.cs to see listen events when your application starts.
      private static DocumentClientEventListener DocumentClientEventListener;
public static void Main(string[] args)
{
    DocumentClientEventListener = new DocumentClientEventListener();
    CreateHostBuilder(args).Build().Run();
}
When you run your application, you should see the request telemetry with a CosmosDBTotalRequestCharge metric that aggregates all charges for that single request. This can tell you specifically which users and routes has RU usage issues.
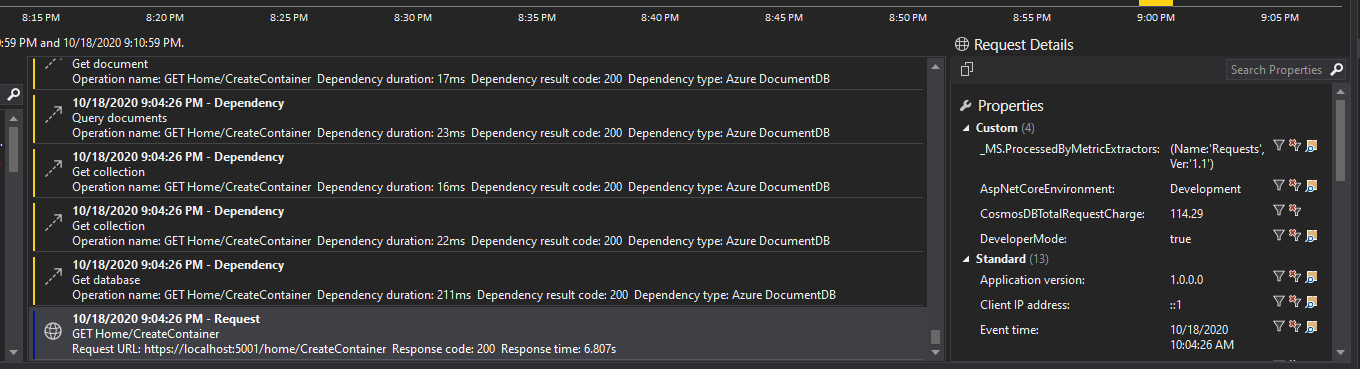
Note: At the time of writing, this technique only works if your CosmosClient is configured WithConnectionModeGateway() rather than a direct TCP connection.
Conclusion
Monitoring and observability are important skills to have when you work with distributed systems. If you learn about lower-level APIs like Event Source, you can easily diagnose performance issues. This is especially true in large applications where you cannot easily look through all the code. Instead, you rely on metrics to help you pinpoint the root cause of the issue.
Advance your tech skills today
Access courses on AI, cloud, data, security, and more—all led by industry experts.
