Profiling Performance with React Developer Tools
Jun 5, 2020 • 9 Minute Read
Introduction
Profiling the performance of a React app can be a difficult and time consuming process. By installing the React developer tools, you can record and interrogate the performance of individual components in your app and make this process much easier.
The guide will be based on a React web app, however, the developer tools can also be used with a React Native app. The app used in the examples below is here.
Installation
The first thing to do is install the developer tools. How you do this depends on the browser you are using to run the app. For Chrome and Firefox, the developer tools are available as browser extensions and can be found in the appropriate extension store. If using a different browser, the developer tools can be installed as a standalone app from this npm package.
Once developer tools are installed in either the standalone app or the browser, two new tabs will be available: Components and Profiler. This guide will use the Profiler tab.
Profiler Tab

This is an example of a chart showing each commit that occurred during the profile recording:

Hover over a commit to get information on its duration and at what point in the recording it occurred, and select a commit to view it in the other charts.
Flamegraph
This is a flamegraph chart of a commit in the example app:
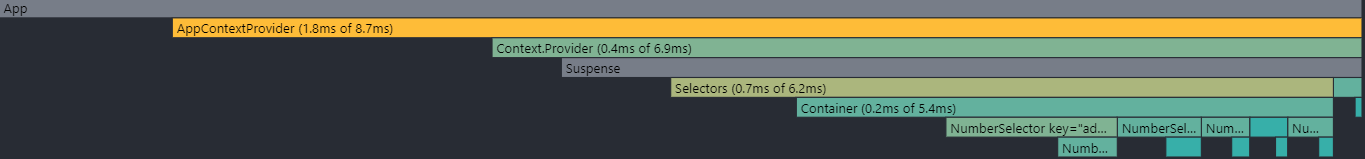
Each bar in the graph represents a React component, and the width of each bar represents how long it took to render the component and its children. The bars are also color-coded to help show at a glance which components took the longest to render, but the actual durations can be seen on the bar (if there is room for the text) or by hovering on the bar.
In the graph above, you can see that the AppContextProvider took the longest to render with a total of 8.7 ms. However, only 1.8 ms of that was taken up by the AppContextProvider itself, while the other 6.9 ms was its children rendering. If you then move to its only child, the Context.Provider component, you can see that its render took 0.4 ms, and the rest of the 6.9 ms was taken by its children, and so on down the chart.
As you move down the chart, it can become more difficult to see the components as they get smaller. Selecting a component will expand that component to the full width of the chart, making it much easier to see.
Ranked Chart
The ranked chart displays each component in the commit as a bar, but this time they are ordered by the duration of their render. This is a ranked chart of the same commit as the flamegraph above:
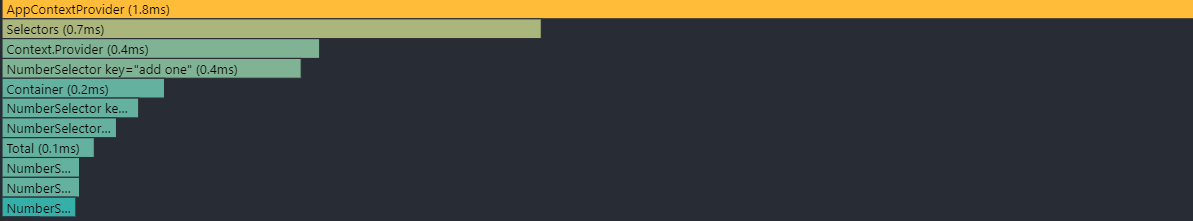
This chart deals just with the time taken by the component itself and doesn't show anything about how long the children took to render. If you are having a performance problem that is being caused by a single component, it should be very easy to identify using this chart.
Profiler Settings
There are two options on the Profiler tab in the developer tools settings menu:
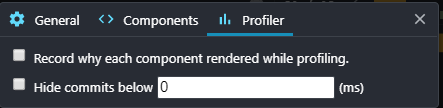
Often, components are rendered that we don't expect to have been, and debugging why this has happened can be very difficult and time consuming. To help with this, the React developer tools can record the reason each component was rendered when recording a profile. Check the Record why each component rendered while profiling checkbox to use this feature. If this feature is selected, when a component is selected from either of the charts in the right hand panel, a reason will be displayed as to why the component rendered.
When profiling an app, you will sometimes produce a very large number of commits, and you will often only be concerned with those that take a longer amount of time. In order to reduce the clutter in the Profiler tab, you can set the Hide commits below setting, and only commits that took longer than the specified number of milliseconds will be shown.
Profile the Initial Render

Find a Performance Issue
The example app contains a performance issue. While the issue is very contrived, it can be used to show how to find an issue in an app.
In the example app, when clicking on the Show count buttons on the right hand side of the window, there is a noticeable lag before the count appears and the button label changes to Hide count. To try and identify the cause of this lag, you could record a profile of a user toggling the Show count and Hide count buttons a few times. This is a chart of the commits produced by showing and hiding three times:
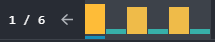
You can see that commits 1, 3 and 5 are showing bars significantly higher than the others. This would be expected as the lag occurs on the show rather than the hide. Selecting any one of these commits shows a flamegraph and a ranked chart like these:
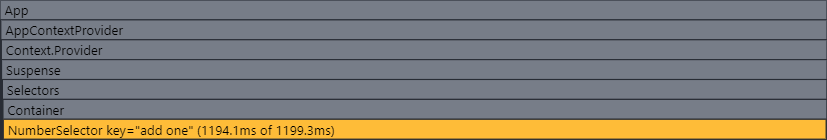

The first thing you see is that all of the components above the NumberSelector in the tree are showing with a grey background because they were not rendered in the commit; this is what we would expect as all of the state and event handling for this component is done locally.

It probably won't take too much time to see that this component contains a function, getCountToShow(), which is called every time the component is rendered with the showingCount state set to true. That looks like this:
      const getCountToShow = () => {
  pointlessDelay();
  return changedCount;
};
A good attempt to fix this performance issue might be to remove the call to pointlessDelay and then re-record a profile and see if the lag has disappeared both from the user's point of view and the profiler charts.
Conclusion
This guide has shown some of the tools that can be used to profile a React app and help identify performance issues. There is one more chart available in the profiler: the interactions chart. This uses an experimental API that is subject to change and would probably need a guide of its own to cover the functionality.
The code for the example app used in this guide can be found here.
Advance your tech skills today
Access courses on AI, cloud, data, security, and more—all led by industry experts.
