Use a Data Analytics Tool to Predict Where the Pokemon Are Going to Appear
Predictive data analytics has endless possibilities and applications. In this guide you will use Red Sqirl, a data analytics tool, to predict where Pokemon are going to appear with a Spark Decision Tree. Don't wait up, start learning today!
Jan 10, 2019 • 10 Minute Read
Introduction
Based on the success of the last post that I wrote on my blog about Red Sqirl and Pokemon, I've decided to do another more advanced one: Red Sqirl - first step tutorial with Pokemon
Here I am playing with Pokemon again
What is Red Sqirl?
Red Sqirl is a new tool for analysing Big Data sets. My previous tutorial was outlining how to set up adding a data source into Red Sqirl and how to do a basic analysis of that data, and as an example, I used a dataset from Pokemon Go.
For this tutorial, I'll show how to use a Spark Decision Tree with Red Sqirl to create a prediction model and using the Pokemon Go dataset we will be able to predict where Pokemon will appear in the game. Decision Trees - spark.mllib
More information about decision trees: A Brief Tour of the Trees and Forests
Decision Trees are a non-parametric supervised learning method used for classification and regression. The goal is to create a model that predicts the value of a target variable by learning simple decision rules inferred from the data features.
Definition from the book “Machine Learning with R” - As you might intuit from the name, decision tree learners build a model in the form of a tree structure. The model itself comprises a series of logical decisions, similar to a flowchart, with decision nodes that indicate a decision to be made on an attribute. These split into branches that indicate the decision's choices. The tree is terminated by leaf nodes (also known as terminal nodes) that denote the result of following a combination of decisions. Data that is to be classified begin at the root node where it is passed through the various decisions in the tree according to the values of its features. The path that the data takes funnels each record into a leaf node, which assigns it a predicted class.
Red Sqirl is a platform, that you can install directly on top of a Hadoop Cluster, containing packages for different Hadoop technologies. One of those packages contained in Red Sqirl is one for Spark.
To use Spark in Red Sqirl you will need the following python libraries on all data nodes:
- python-dateutil
- numpy (used by Spark for machine learning)
To Start in Red Sqirl
To start in Red Sqirl you can have a look at this introdution tutorial: Red Sqirl Data Analytics Platform Introduction
And here: Red Sqirl - Overview
Proof of concept
For this tutorial, I'll be using a small dataset on Pokemon go, and as it is a small dataset the result at the end of the tutorial won't be very useful.
But this is just a proof of concept, if you were to apply these steps to a larger dataset, you will be able to get a predictive model which would be very accurate.
The dataset I'll be using for this tutorial was taken from here: https://www.pokemonradargo.com/
I just combine map information plus forecast data from data specific time.
Header Id INT,Pokemon CATEGORY,Timestamp STRING,Longitude FLOAT,Latitude FLOAT,Temperature INT,Barometer INT,Humidity INT,Wind INT,Near_Water CATEGORY,Near_Grass CATEGORY,Near_Buildings CATEGORY
1,Drowzee,14/07/2016 13:48,53.334968,-6.251446,16,1026,63,19,No,Yes,Yes 2,Drowzee,14/07/2016 10:11,53.337254,-6.251597,14,1026,82,15,No,No,Yes 3,Drowzee,14/07/2016 10:23,53.339945,-6.248335,14,1026,77,13,No,Yes,No 4,Drowzee,14/07/2016 12:24,53.345677,-6.248267,17,1026,59,15,No,No,Yes 5,Drowzee,14/07/2016 15:31,53.34038,-6.261259,18,1026,52,11,No,No,Yes 6,Drowzee,14/07/2016 14:08,53.342125,-6.262587,17,1026,68,17,No,No,Yes 7,Drowzee,12/07/2016 13:27,53.344171,-6.259333,16,1014,55,20,No,No,Yes 8,Drowzee,14/07/2016 11:31,53.348675,-6.255442,16,1026,63,11,No,No,Yes 9,Drowzee,14/07/2016 13:02,53.356889,-6.258702,17,1026,59,17,No,Yes,Yes 10,Drowzee,12/07/2016 22:53,53.347341,-6.287458,12,1016,82,15,Yes,Yes,No 11,Squirtle,14/07/2016 10:07,53.332052,-6.253498,14,1026,82,15,Yes,No,Yes 12,Squirtle,14/07/2016 13:51,53.333941,-6.250503,17,1026,68,17,No,No,Yes 13,Squirtle,18/07/2016 16:41,53.334569,-6.255064,25,1018,57,11,No,No,Yes 14,Squirtle,14/07/2016 10:00,53.335854,-6.225442,14,1026,82,15,Yes,No,Yes 15,Squirtle,24/07/2016 19:24,53.338531,-6.259332,17,1014,73,35,Yes,Yes,No 16,Squirtle,14/07/2016 13:50,53.339978,-6.272175,17,1026,68,17,No,Yes,Yes 17,Squirtle,20/07/2016 10:18,53.358605,-6.225089,20,1008,73,24,Yes,No,Yes 18,Squirtle,19/07/2016 07:56,53.358854,-6.229893,19,1016,78,11,Yes,No,No 19,Squirtle,12/07/2016 13:12,53.366995,-6.280585,16,1014,55,17,Yes,No,No 20,Squirtle,14/07/2016 11:36,53.375874,-6.319334,16,1026,63,11,Yes,No,
Steps
The idea here is to predict where the Pokemon are going to appear.
So let's start
- In the Pig footer, drop a new Pig source icon onto the canvas.
- Double click to open the source action.
- Now name the action “Pokemon“.
- Comment the action “this is a tutorial using Pokemon data“.
- Click OK.
- On the data set screen, click on the path field or on the button.
- Click on the radio button beside “pokemon.mrtxt”- if you can't find it refresh the view by clicking on the search button, or you may need to navigate to the file system.
- At this stage, you'll see the data correctly displayed on the screen, the name of the fields are “Field1 string, Field2 string…”
- On the feature title line, click on the edit button.
- Once it appears you can choose “Change Header”
- Copy and paste “Id INT,Pokemon CATEGORY,Timestamp STRING,Longitude FLOAT,Latitude FLOAT,Temperature INT,Barometer INT,Humidity INT,Wind INT,Near_Water CATEGORY,Near_Grass CATEGORY,Near_Buildings CATEGORY” into the value field.
- Click OK.
- You'll now have the confirmation that the Header is correct.
- Click OK to exit from the Configuration window.
If you leave the mouse cursor on the source action you'll be able to see some of the configuration details.
Next, drop a new Pig Select action icon onto the canvas.
- Create a link from “Pokemon” to the new Pig Select action.
- Double click on the new Pig Select action to open it.
- Name the action “random“.
- You'll now see the configuration pages for this action.
- On the first page just click on copy
- add a new line with the function RANDOM() and give a name rnd and type Double
- Click next
- Click next
- Click OK
Now drop another Pig Select action icon onto the canvas.
- Create a link from “random” to the new Pig Select action.
- Double click to open this new action.
- And name this new action “prediction“.
- On the first page just click on copy
- Click next
- click next
- Add a where statement rnd >= 0.3
- Change the output type to Text Map-reduce directory
- click OK
Now drop another Pig Select action icon onto the canvas.
- Create a link from “random” to the new Pig Select action.
- Double click to open this new action.
- And name this new action “training“.
- On the first page just click on copy
- Click next
- click next
- Add a where statement rnd < 0.3
- Change the output type to Text Map-reduce directory
- click OK
Now drop a Spark Decision Tree icon onto the canvas.
- Create a link from “training” and another from "prediction" to the new Spark Decision Tree action icon.
- Double-click on it to open it.
- Name the action “sparkdtree“.
- On the first configuration page, choose ID as the id and Pokemon as the target and click next.
- Deselect “Country“ and “City” from Predictors and click in next.
- If you are using Spark, change the partition to be 1.
- click ok
Next, drop a Pig Join action from the footer onto the canvas.
- Create a link from “prediction” to the new pig join action.
- Create a link from “sparkdtree” to the new pig join action.
- Double-click the Pig Join and call it “pokemonData”.
- The first configuration page for the Pig Join action will list the table aliases, just click next.
- On the following page, just add 3 lines;
- pokemonData.label; pokemonData.score; prediction.pokemon and click OK and Click next.
- This page has two interactions that specify the join type and the fields to join on, we'll use the default join type which is “Join” so this does not need to be changed. In the “Join Field” column, type “sparkdtree.label” and “prediction.ID”. This condition will join the two tables together.
Finish
Now you have your decision tree done and you can start to predict where the pokemon are going to appear in the game.
I just add a new line in my prediction source and run again to have my prediction. My new line has the pokemon name empty. Example line; 21,,20/07/2016 14:23,53.237642,-6.239801,19,1006,53,12,Yes,No,No
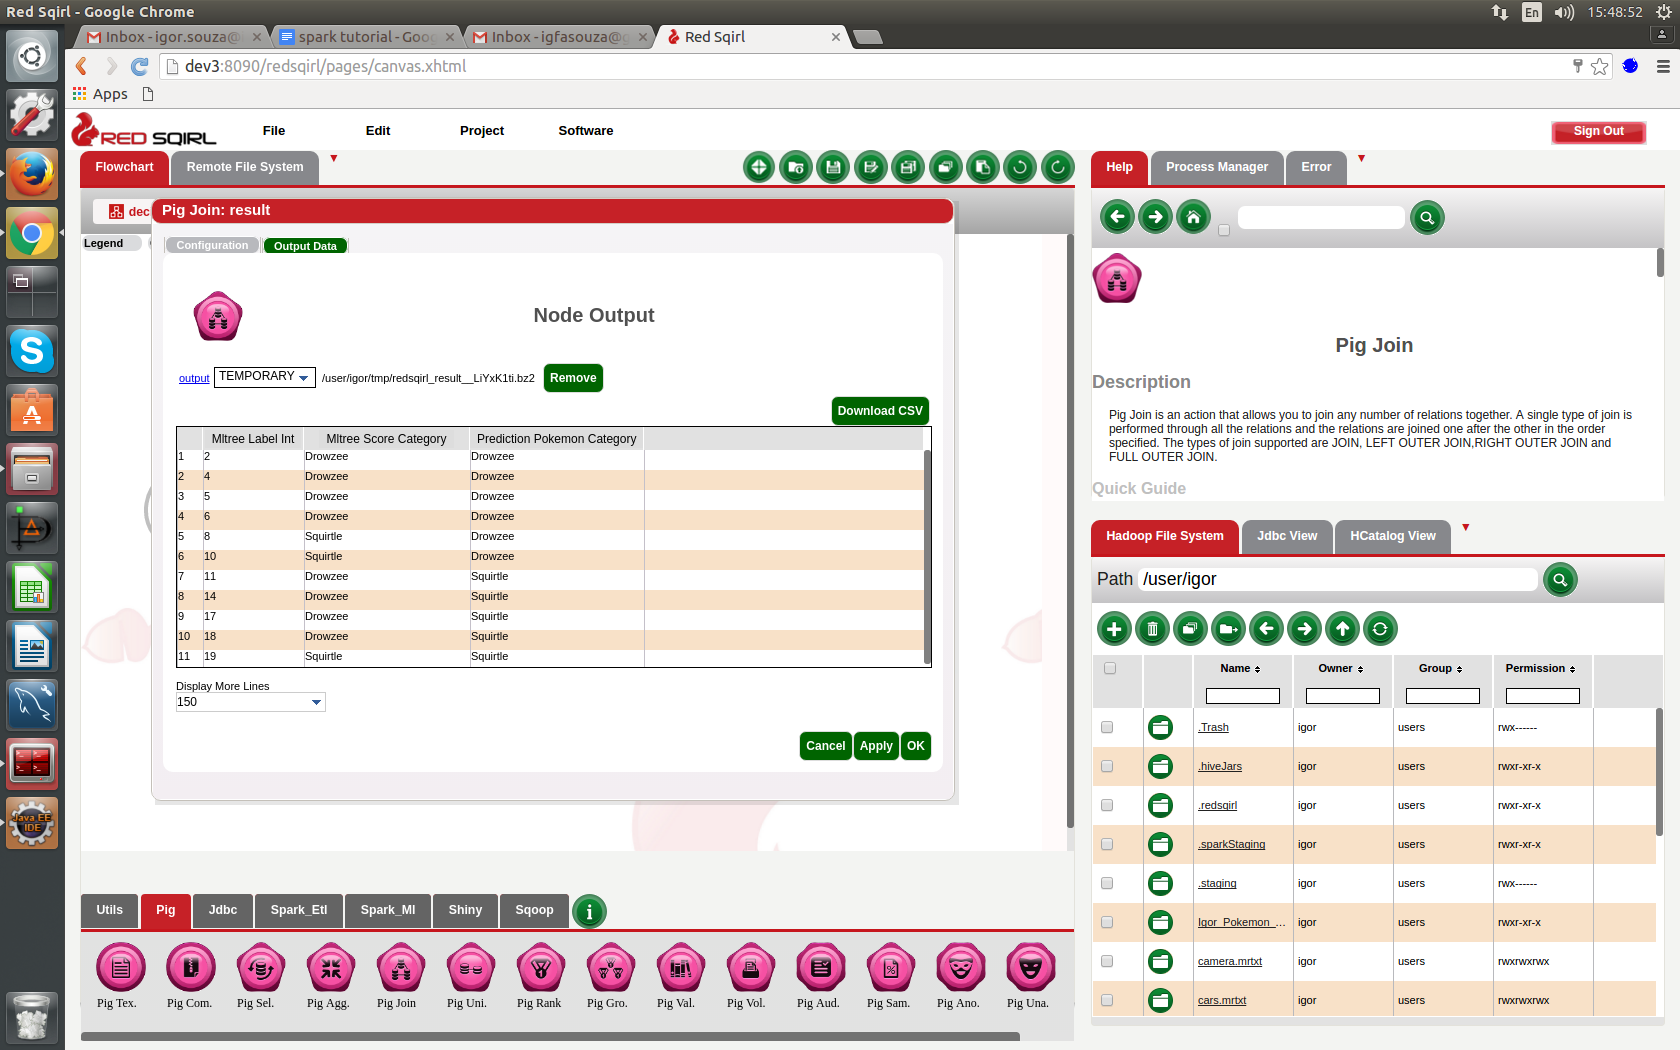
On this image you can see the result.
Conclusion
Again, this is just a proof of concept using a small dataset as an example. Our result here won't help you master Pokemon Go, sorry. But if we were to use a larger dataset these steps would help to put together an accurate predictive.
Predictive data analytics has endless possibilities and applications, our example here is just a lighthearted way of showing how it can be done using Red Sqirl as the tool. Data Analytics can be fast and efficient when you use the right tools.