Create Conditional Calculations with Built-in Functions in Tableau
Jun 3, 2020 • 7 Minute Read
Introduction
Testing the logical scenarios of variables is a common task in data science and business intelligence. This allows us to determine if a certain condition is true or false (Boolean logic), thereby providing useful insights. In this guide, you will learn how to create conditional calculations with built-in functions in Tableau.
Data
Conditional calculations can be applied to both dimensions and measures. This guide will be using the Sample Superstore data source available in the Tableau repository.
In the subsequent sections, you will implement several built-in functions including IF, IFELSE, CASE, and ISDATE.
ISDATE
The ISDATE function is used to check whether the string value passed in the function is a date or not. This function is useful in scenarios where the data source has fields in string format. The syntax of the function is ISDATE(String value), and the output is a Boolean expression—TRUE or FALSE.
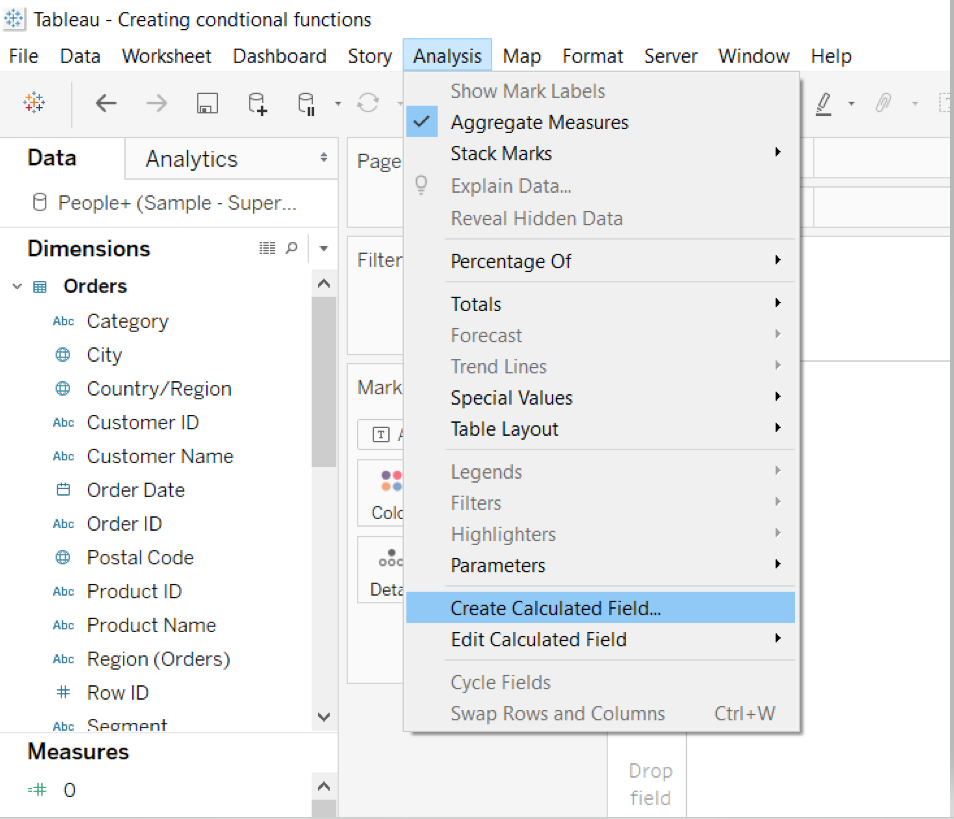
The first step is to go to the Analysis tab and select the Create Calculated Field option, as shown below.
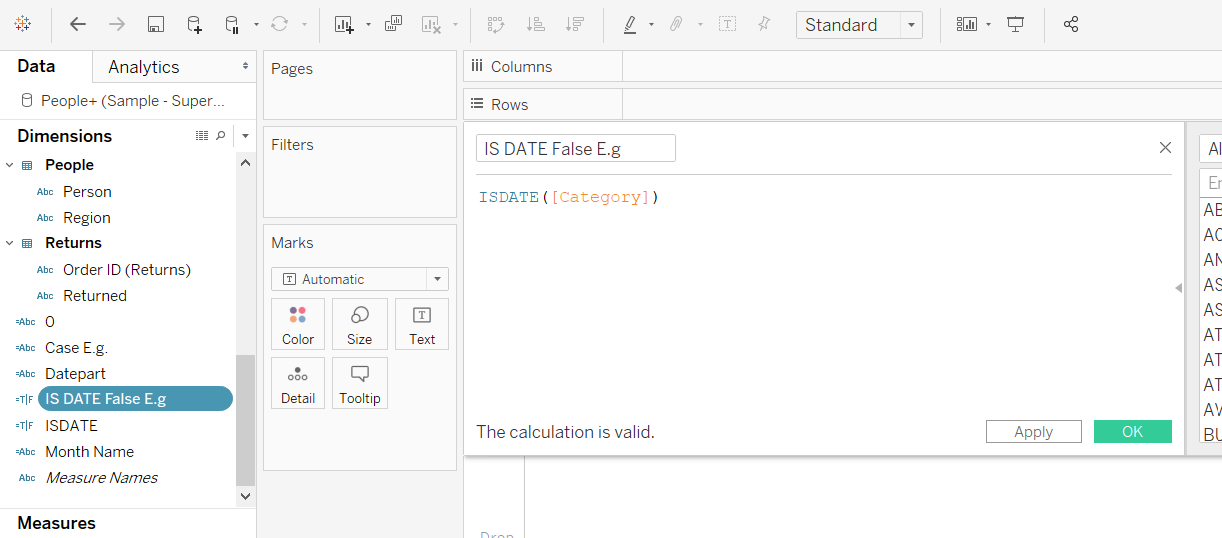
The next step is to name the calculated field ISDATE False E.g. Next, write the expression as shown below, and click Ok. The calculation is valid because the datatype is string for the category.
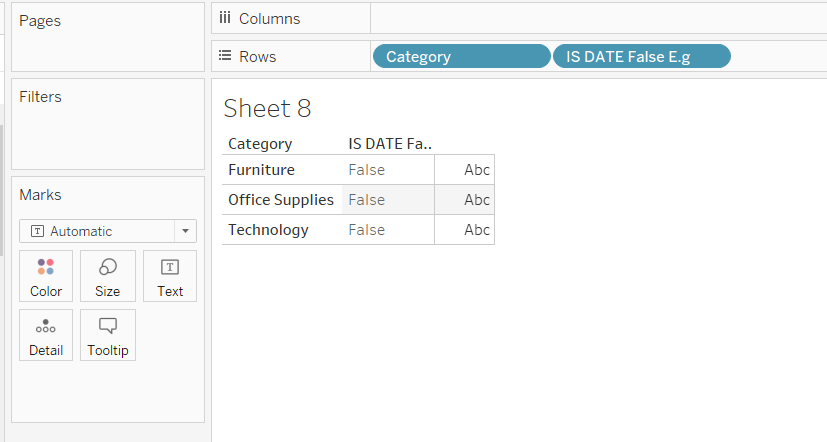
Drag this calculated field into the view and check the output. The result will be False because Category is not a date type variable.
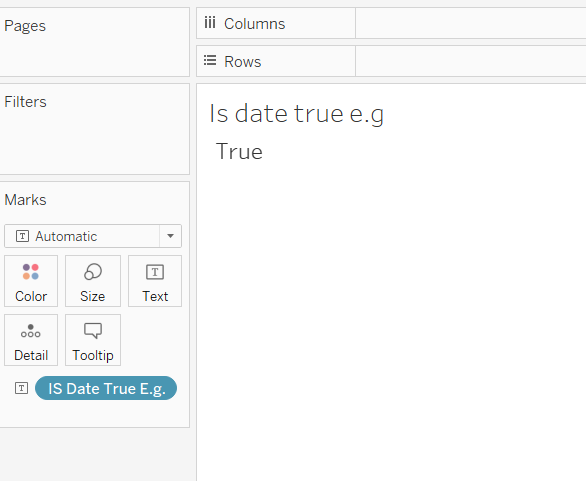
If the variable was a date type, the result would have been True. To illustrate this, create another calculated field as above and name it ISDATE True E.g.. Next, write the calculation as shown below.
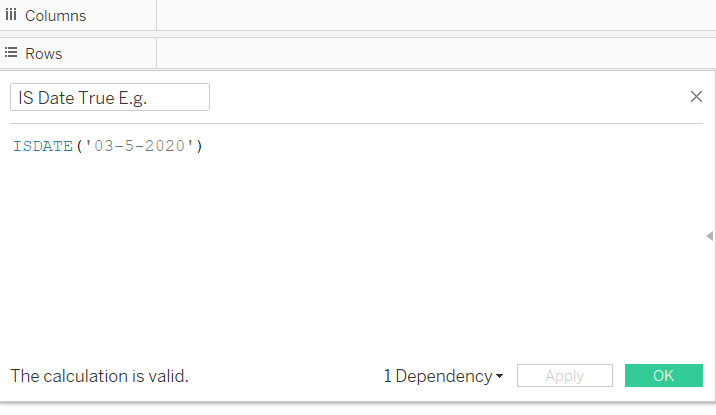
Click on OK and drag the calculation into the view. The output will be True as the condition has been satisfied.
IIF
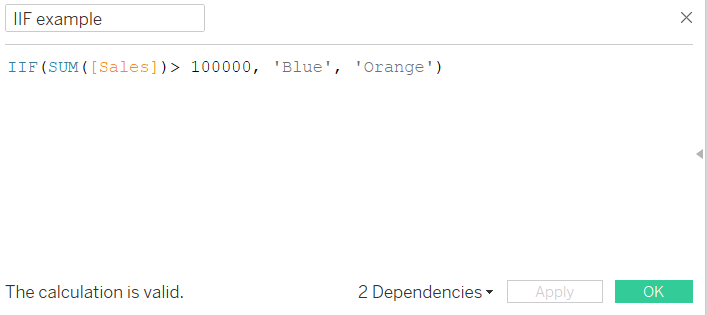
The IIF function is used to return the true output if the expression is met, otherwise it returns false or null as the output. The first step is to create a calculated field and name it IIF example. Enter the logic in the calculated field as shown below.
Next, drag Sub-Category into the Columns shelf and Sales into the Rows shelf. Turn on the label to display the values.
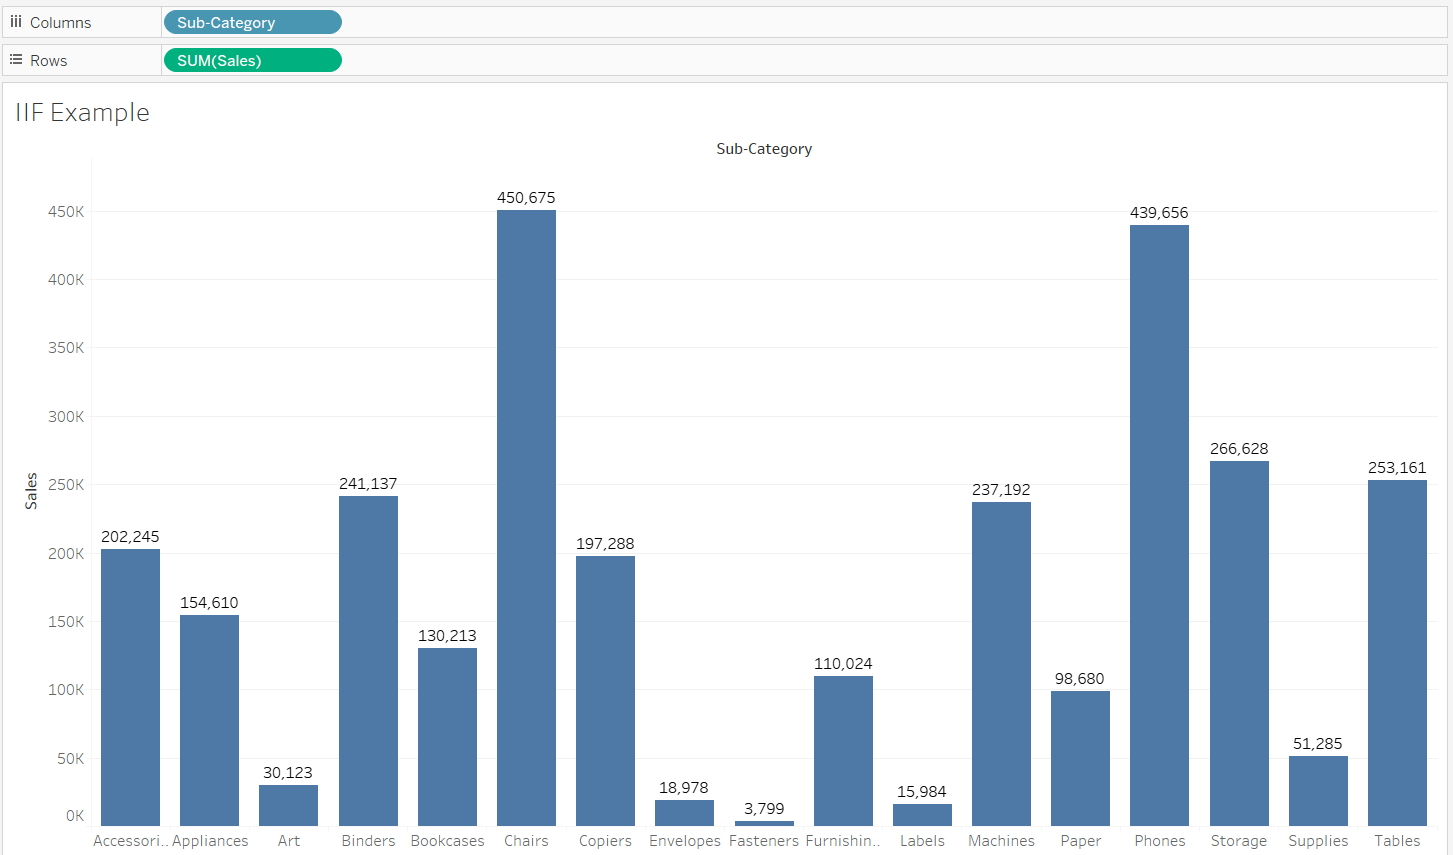
Next, drag the calculated field IIF Example into the Color option of the Marks card.
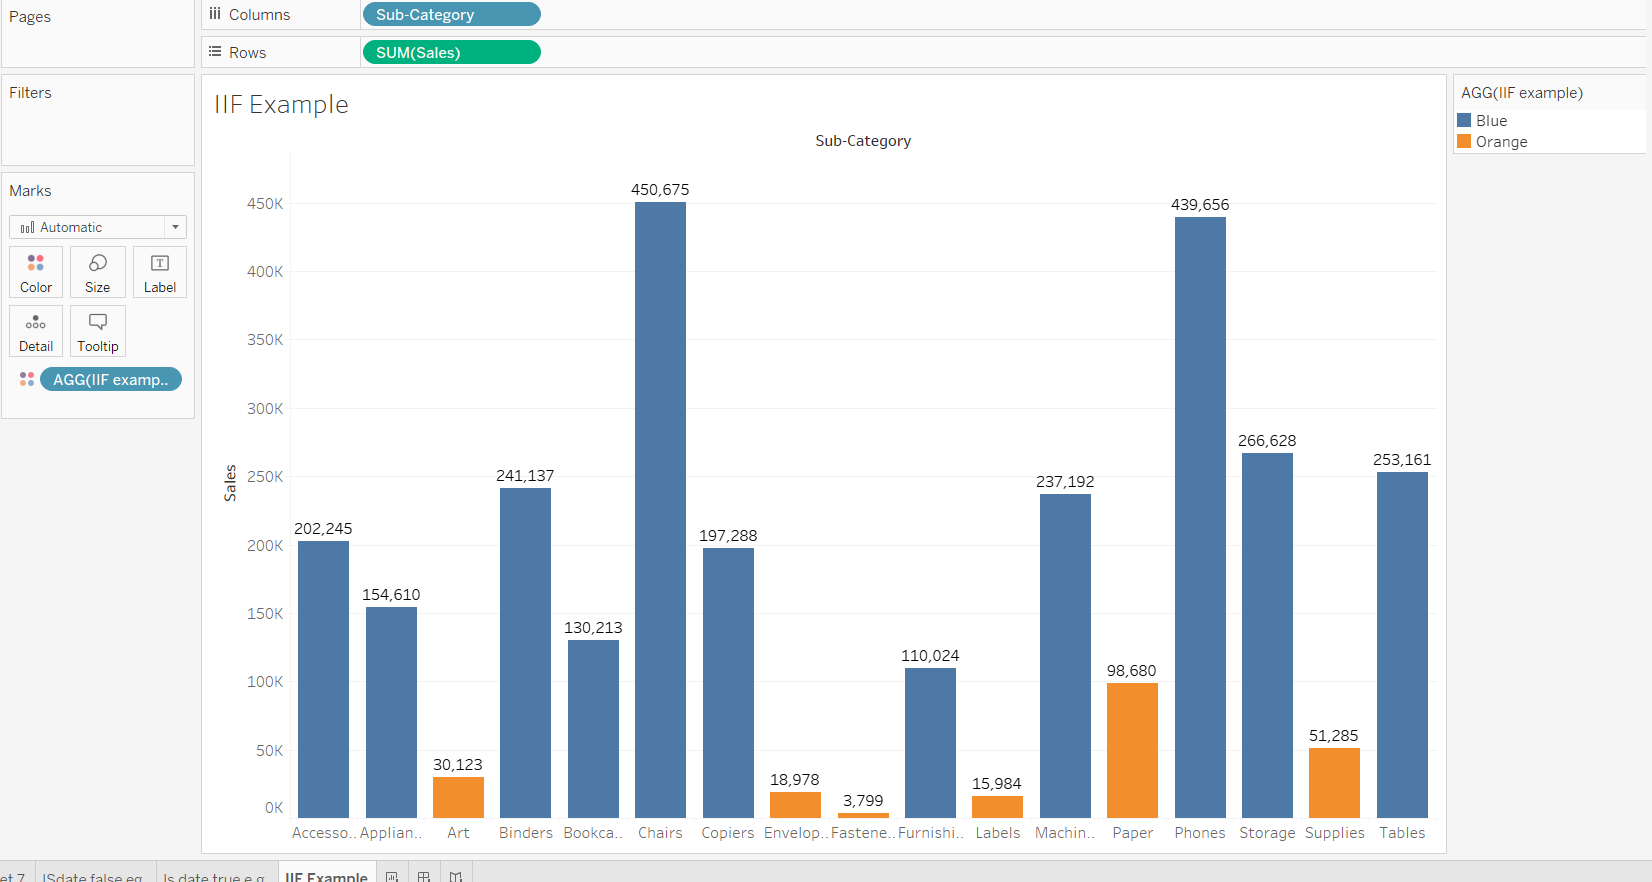
The output above shows that the bar chart is demonstrating the color as specified in the logic.
IF THEN
The IF function allows the user to construct only one condition, and if the condition is satisfied, the function returns the output. The extended argument THEN is used to return the result, given the expression in the IF part is satisfied.
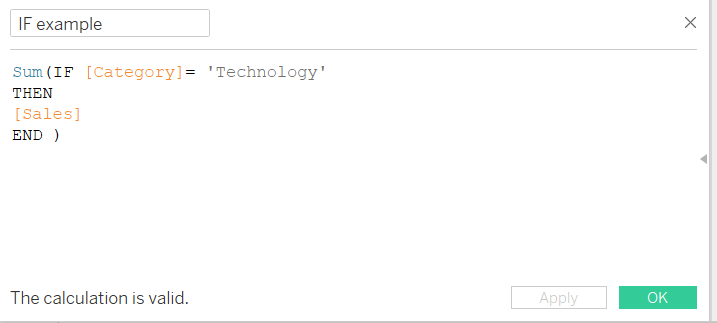
To start, create a calculated field named IF example, and write the logical expression as shown below. This expression will return the Sales amount only if the Category condition is satisfied.
Drag the Category into the Rows shelf and the calculated field, IF example, into the Text option of the Marks shelf.
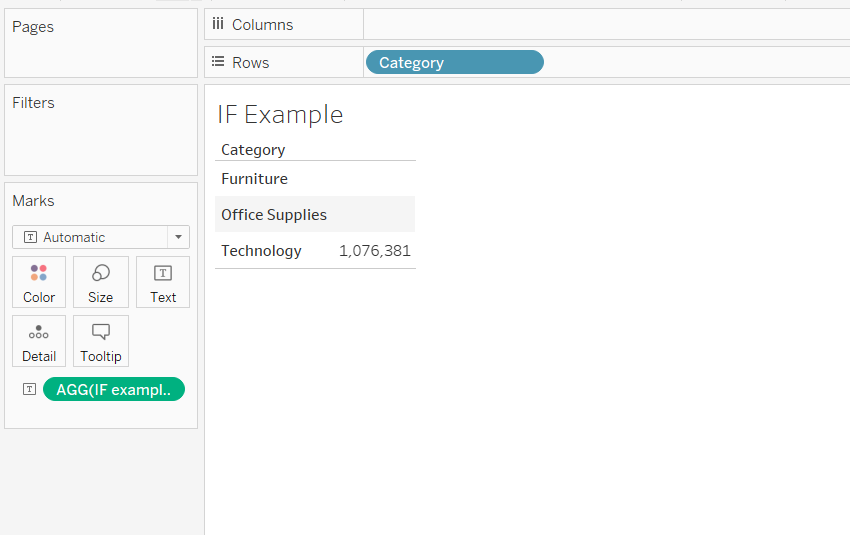
The output above shows that the other two categories are blank, and sales is displayed only for the Technology category.
IF ELSE
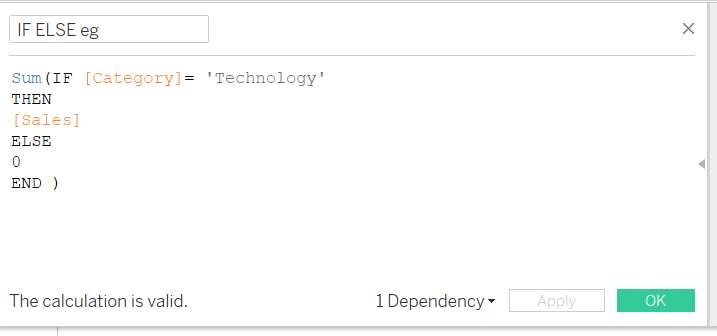
This is an upgraded version of the previous IF THEN function. You can create two conditions using this function. To start, create a calculated field named IF ELSE eg, and write the logical expression as shown below. This expression returns the sales value when the condition is met, otherwise it returns a value of zero.
Next, drag the Category into the Rows shelf and the calculated field into the Text option of the Marks shelf.
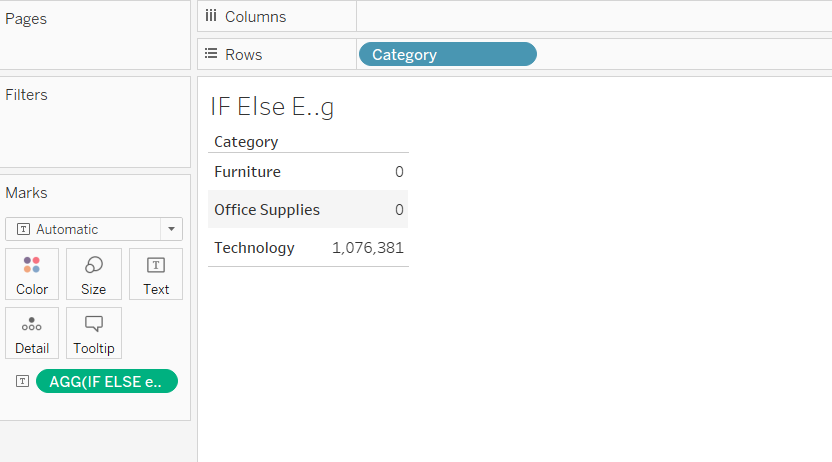
The output above shows that the sales value is displayed only for the Technology category.
CASE
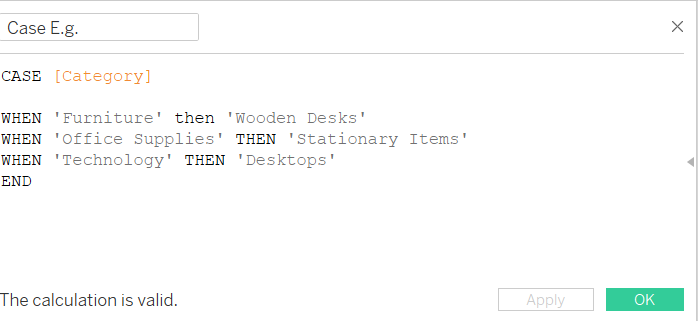
The CASE function evaluates the expression mentioned in the conditions, scans through the values, and returns the value that matches the expression. To start, create a calculated field named Case E.g., and write the logical expression as shown below.
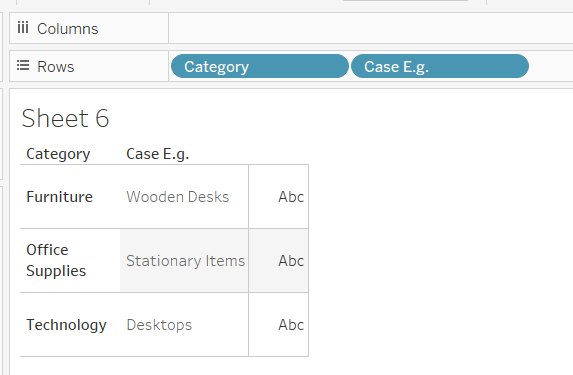
The next step is to drag the Category and the calculated field, Case E.g., into the Rows shelf. Also, place the Case E.g. variable into the Text option of the Marks shelf. This will generate the required output.
Conclusion
In this guide, you learned how to create conditional calculations using built-in functions in Tableau. You learned several functions which are commonly used while working with data. This will help strengthen your descriptive analytics capabilities.
To learn more about visualization and data analysis using Tableau, please refer to the following guides:.
- Building Dual-Axis Combination Charts in Tableau
- Building a Box-and-Whisker Plot in Tableau
- Building a Time Series Chart in Tableau
- Building a Gantt Chart in Tableau
- Building a Bullet Graph in Tableau
- Use Built-In Statistical Modeling in Tableau
- Building a Burndown Chart in Tableau
- Adding Trend Lines to Continuous Charts in Tableau
- Create a Reference Band in Tableau
- Create a Reference Line in Tableau
Advance your tech skills today
Access courses on AI, cloud, data, security, and more—all led by industry experts.
