Create Conditional Calculations with Parameters in Tableau
Jun 24, 2020 • 7 Minute Read
Introduction
In Tableau, you can use parameters to create conditional calculations for the variable of interest. Parameters allow you to come up with scenarios or options that enable conditional calculations. Parameters are the placeholders that support the input with the common datatype. They allow users to input values and customize the view according to the input. In this guide, you will learn how to create conditional calculations using parameters to solve problems in Tableau.
Data
Parameters support a variety of data types like text, strings, integer, float, date, and boolean. This guide will use the Sample Superstore data source available in the Tableau repository.
You will work on two scenarios to demonstrate how to create conditional calculations linked to parameters.
Steps – Scenario One
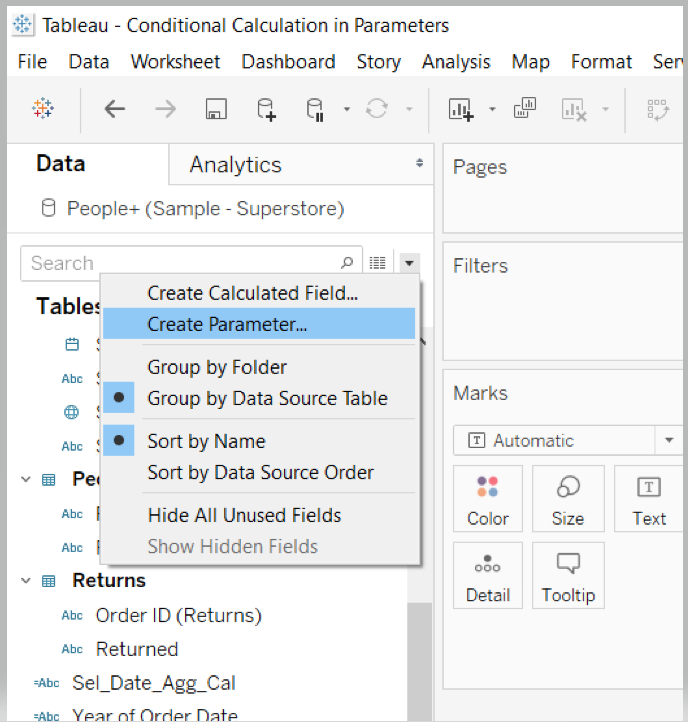
In the first scenario, you will capture data granularity such as period level granularity at the year, quarter, month, or week level. To begin, click on the down arrow in the data pane and select Create Parameter. Name the parameter as Select Date Aggregation.
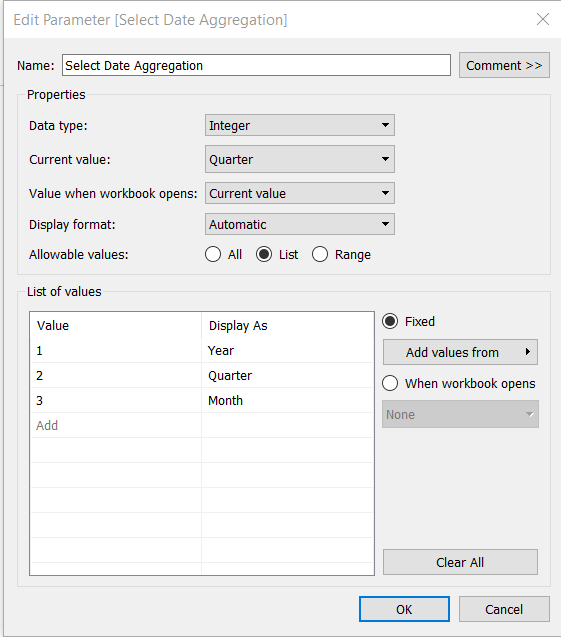
Select the datatype of the parameter as Integer and enter the values in the list as shown below.

The list will contain different level of date aggregations, and the parameter will display the value of one for Year, two for Quarter, and three for Month.
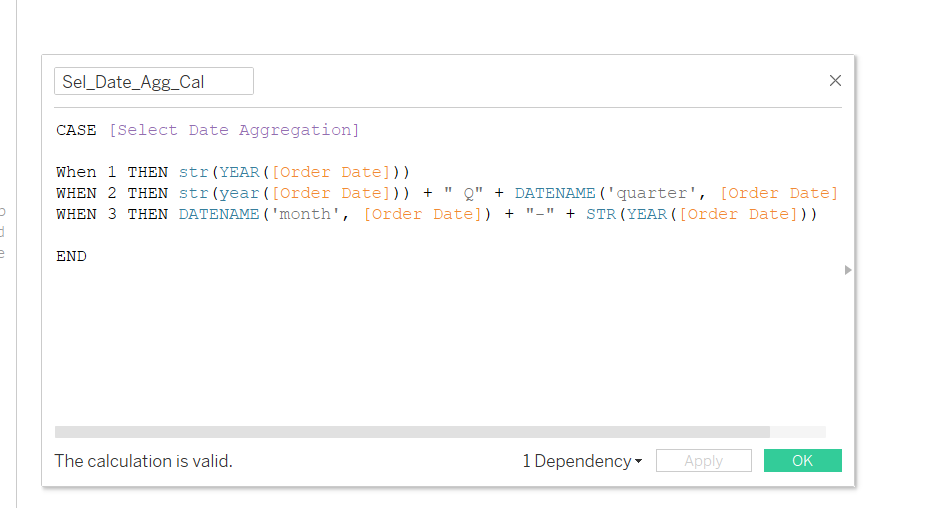
You have created the parameter and the next step is to create a calculated field. Click on the down arrow in the data pane and this time select Create Calculated Field. To make a parameter work in the views and dashboard globally, you need to bind it with the calculated field. To do this, call the parameter and write the logic for each date level aggregation to extract the specific date_part. The calculated field is named as Sel_Date_Agg_Cal and the calculation is shown below.
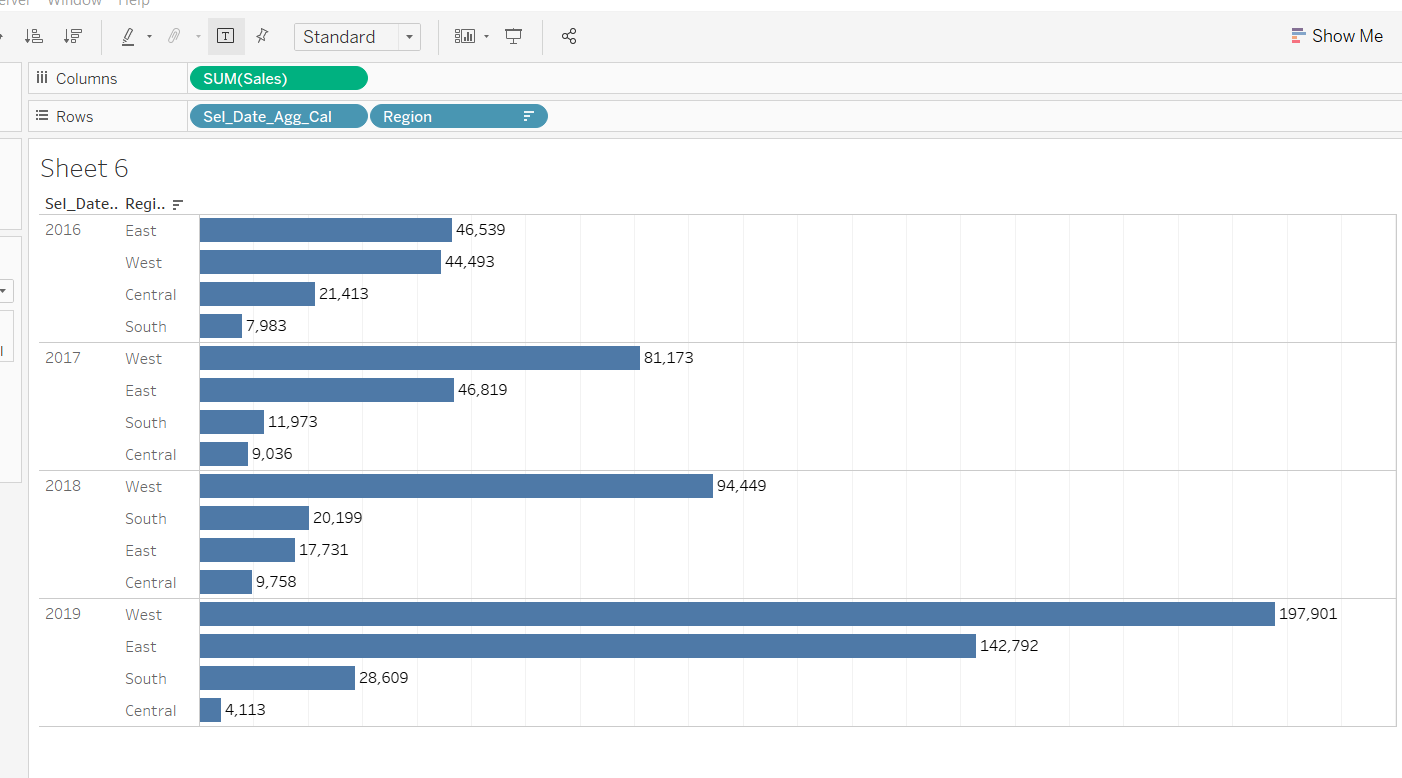
You have created the parameter and the calculated field, and the next step is to use these in the Tableau worksheet. Drag the Sel_Date_Agg_Cal and Region field in the Rows shelf, and Sales into the Columns shelf.
Next, right click on the Select Date Aggregation parameter and select Show Parameter.
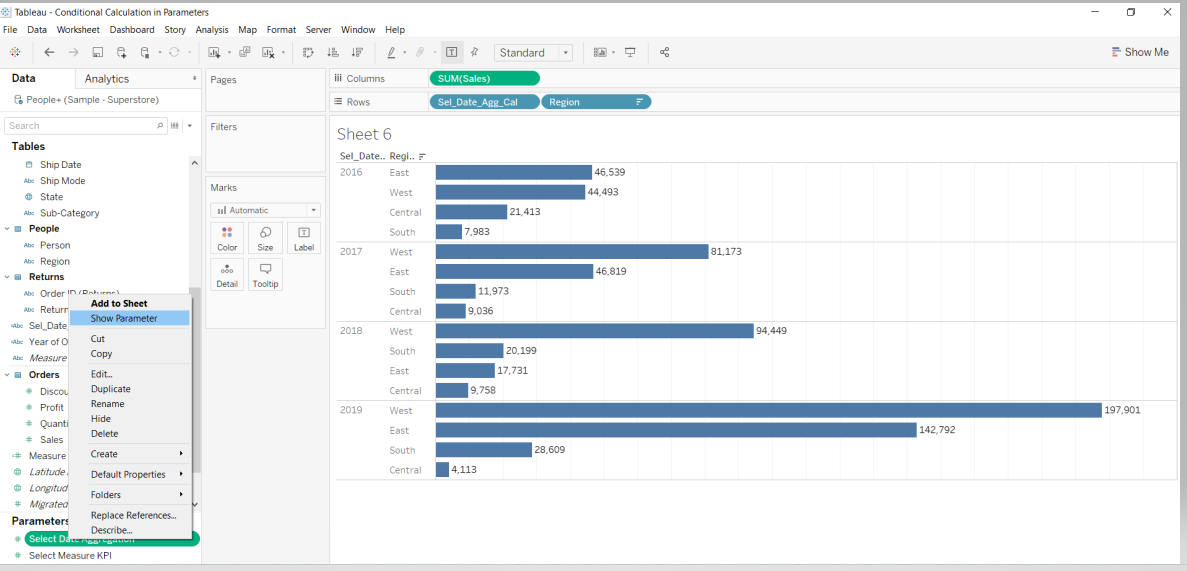
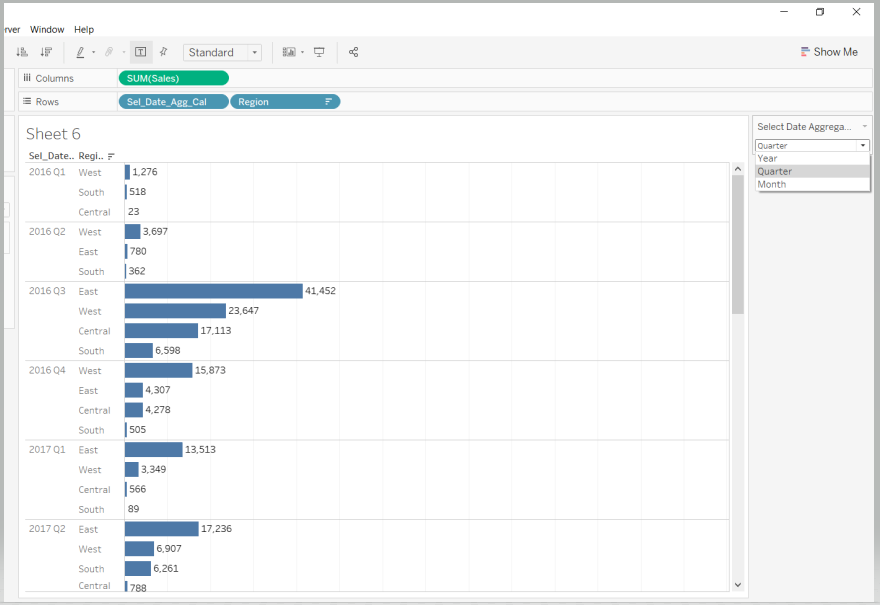
This will display the view and you can control the date aggregation as shown below.
Steps – Scenario Two
In this scenario, you will visualize the variables Sales and Profit by Category, Sub- Categories, Region, etc. To begin, click on the down arrow in the data pane and select Create Parameter.

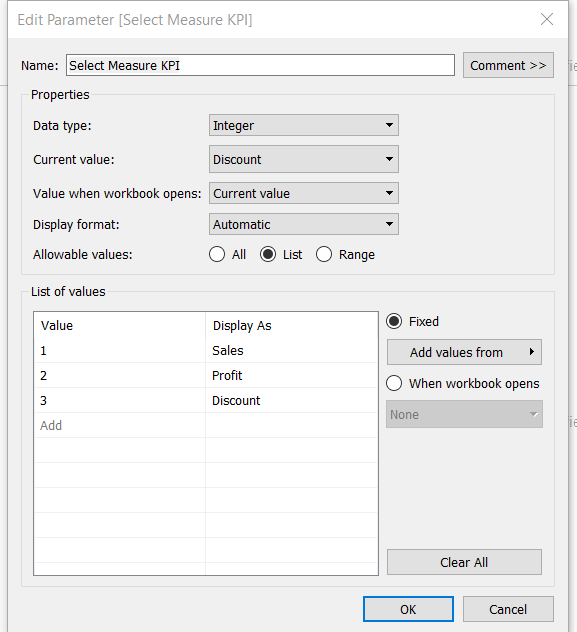
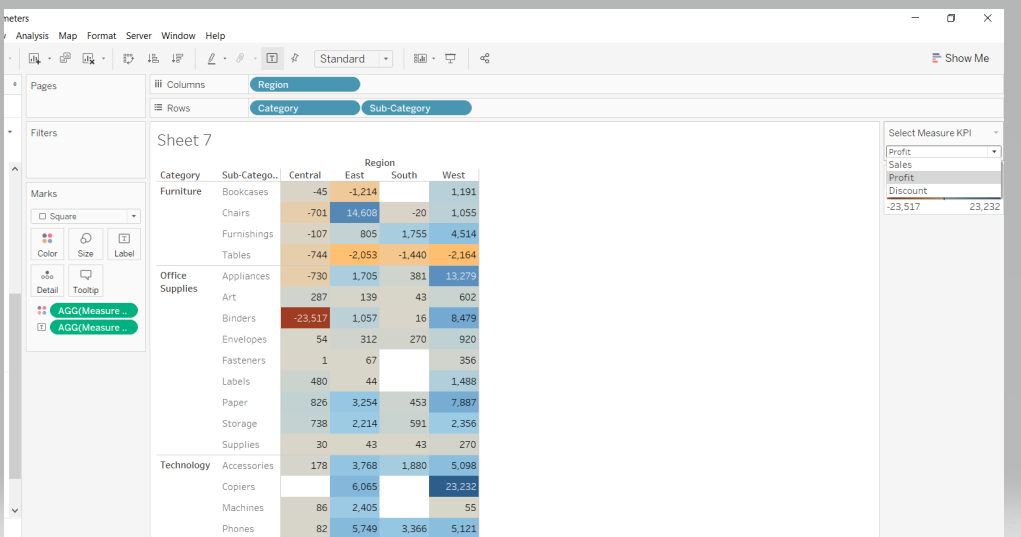
Next, name the parameter as Select Measure KPI and fill the entries as shown below.
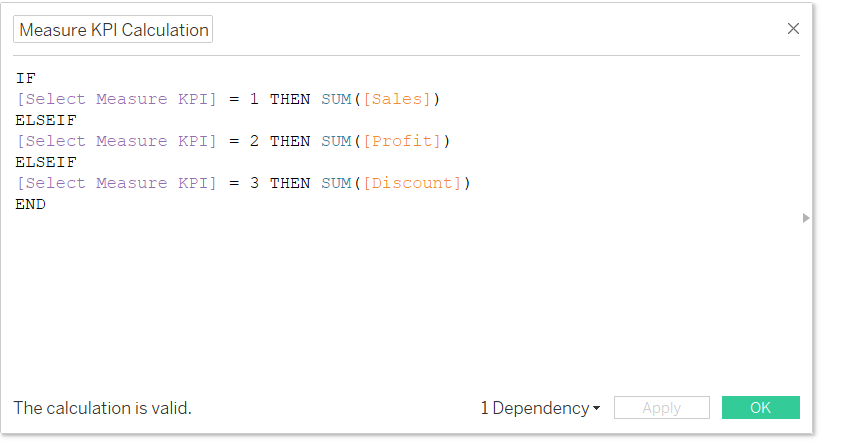
Click on the down arrow in the data pane and select Create Calculated Field, and name it as Measure KPI Calculation.
Provide the logic in the calculated field as shown below. The logic states that if the parameter value is one, then fetch records for Sales. Similarly, if the value is two, then show Profit, and if the value is three, select Discount.
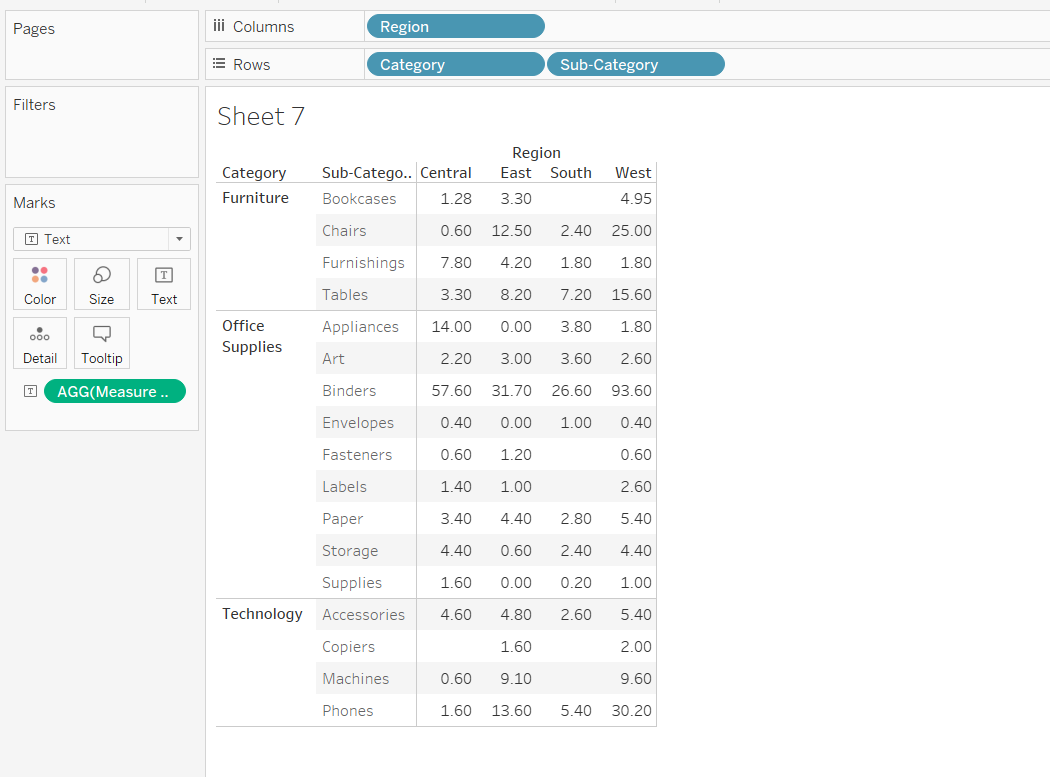
Drag the fields Category and Sub-Category into the Rows shelf, and Region in the Columns shelf. Drag the calculated field, Measure KPI Calculation, in the Text label option of the Marks card.
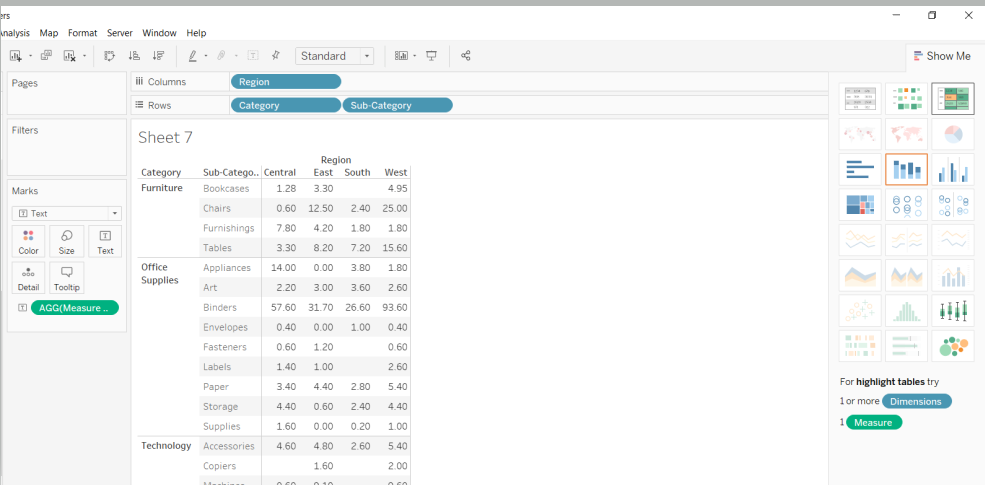
To make the visualization better, go to the Show Me option on the top-right corner of the worksheet, and select the highlight table option shown below.
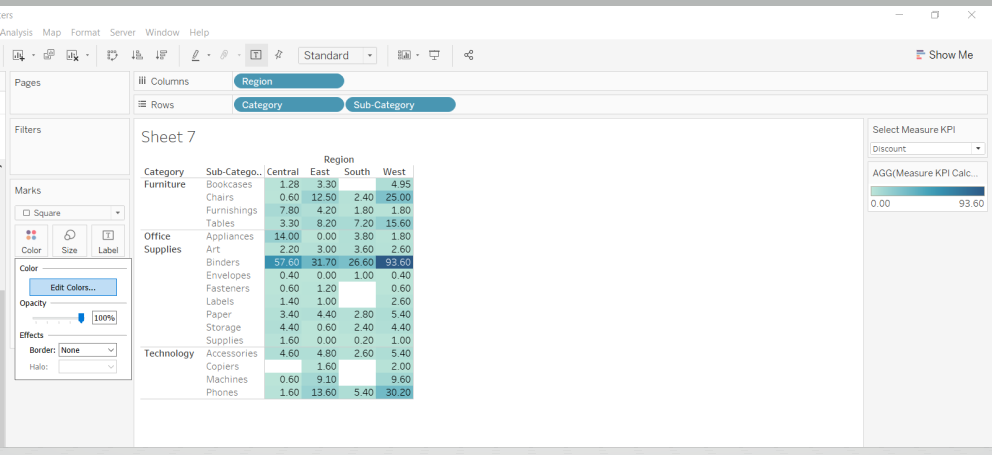
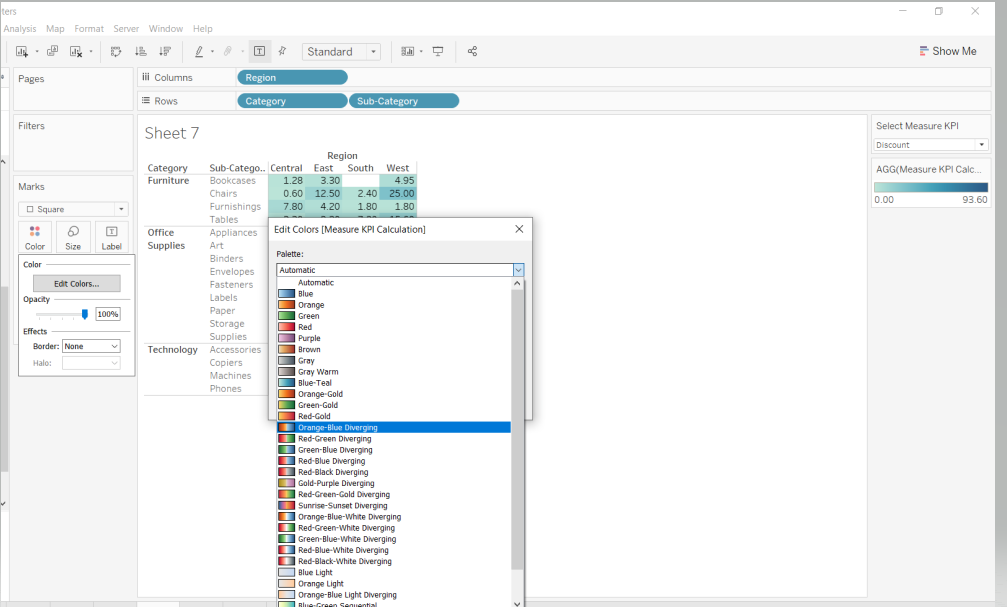
Next, change the color for the measure range to Orange - Blue Diverging. To do this, click on the Color option and select Edit Colors option.
Next, select the option Orange Blue Diverging as shown below.
Next, right click on the parameter Select Measure KPI and select show parameter control. The above steps will prepare the display, and you can choose the options in the parameter to customize the view accordingly.
Conclusion
In this guide, you learned how to create conditional calculations using parameters to solve problems in Tableau. This will help in strengthening your descriptive and diagnostic analytics capabilities.
To learn more about visualization and data analysis using Tableau, please refer to the following guides:
- Building Dual-Axis Combination Charts in Tableau
- Building a Box-and-Whisker Plot in Tableau
- Building a Time Series Chart in Tableau
- Building a Gantt Chart in Tableau
- Building a Bullet Graph in Tableau
- Use Built-In Statistical Modeling in Tableau
- Building a Burndown Chart in Tableau
- Adding Trend Lines to Continuous Charts in Tableau
- Create a Reference Band in Tableau
- Create a Reference Line in Tableau
Advance your tech skills today
Access courses on AI, cloud, data, security, and more—all led by industry experts.
