Display Grand Totals and Subtotals in a Tableau Worksheet
Jun 1, 2020 • 7 Minute Read
Introduction
In business intelligence and analytics, it's often necessary to show both grand totals and subtotals. It's also important to customize how these totals are calculated and where they appear in the visualization. In Tableau, it's easy to include both subtotals and grand totals for various measures, and this guide will help you learn how to perform these tasks.
Data
To add the totals and subtotals to the view of your report, a measure is required against which totals and subtotals will be calculated. You also need a dimension against which the measure will be placed.
This guide will use the Sample Superstore data source available in the Tableau repository. There are three sheets, People, Orders, and Return, that have been joined to fetch the data.
In this guide, you’ll walk through two scenarios—column level and row level totals and subtotals.
Scenario 1: Column Level Totals and SubTotals
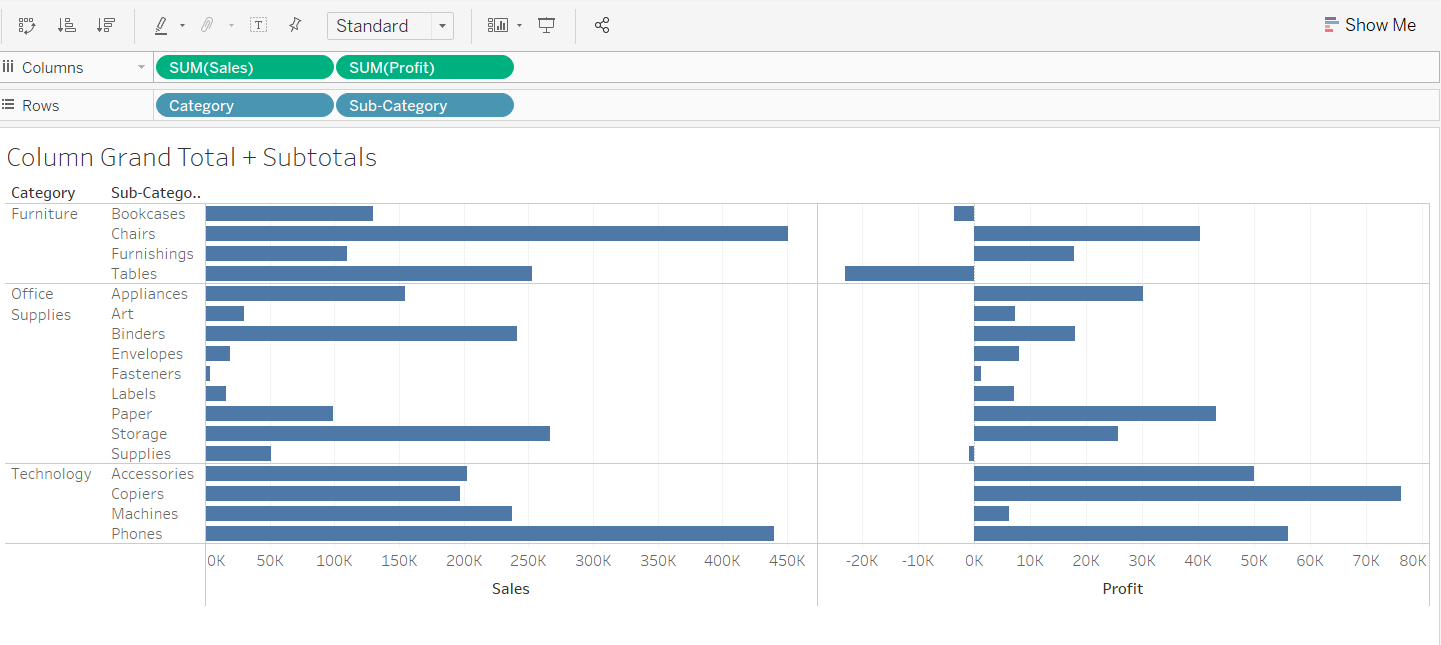
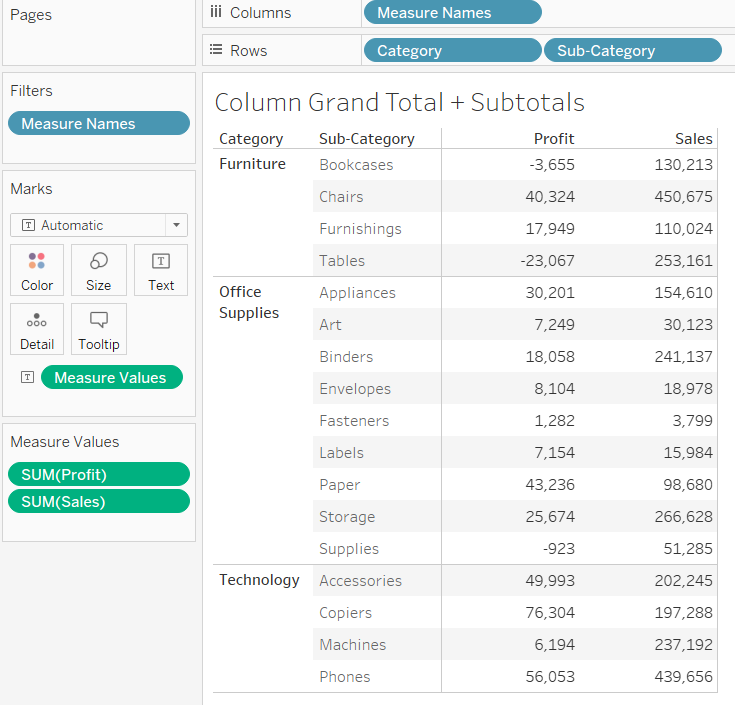
In the first scenario, you will work with column level totals and subtotals. Drag the Category and Sub-Category variables into the Rows shelf.
Next, drag Profit and Sales into the Columns shelf. The default selection is Bar Chart, as shown below.
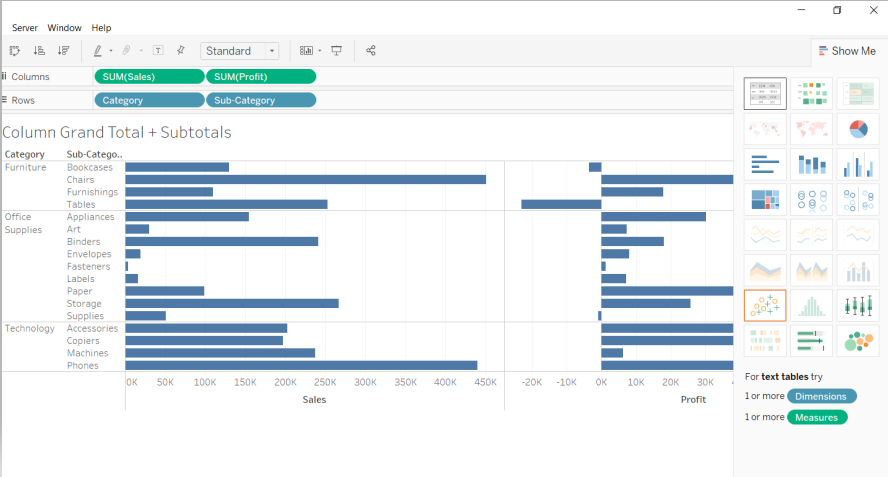
The chart needs to be converted to text table format. To do this, go to the Show Me pane and select Text tables, which is the first option from the left.
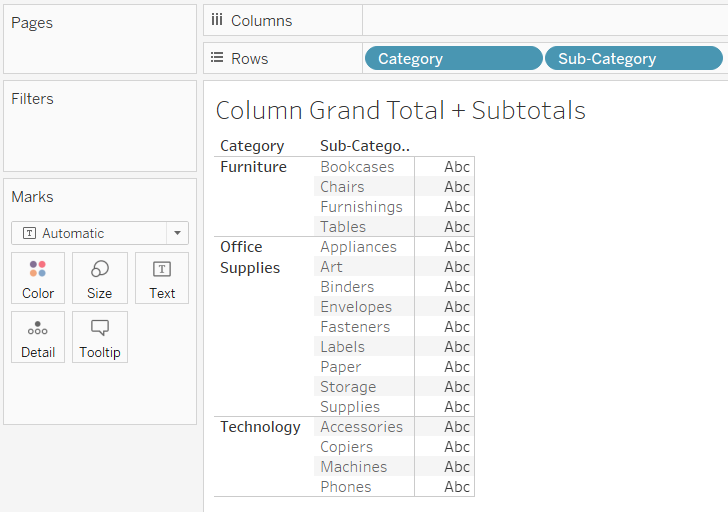
Completing the above steps will create the required table.
You can use the flexibility provided by Tableau to adjust and resize the cells.
You have created the table, and the next step is to add totals and subtotals. To do this, go to the Analysis tab and select Totals from the drop-down option, followed by Add All Subtotals.
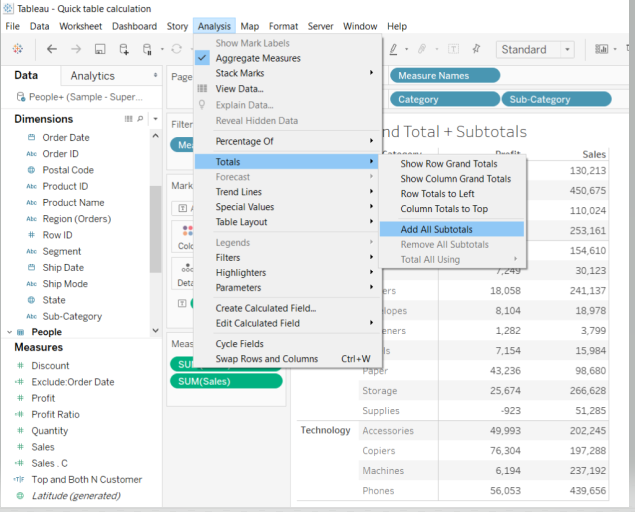
Completing the above step will create this output.
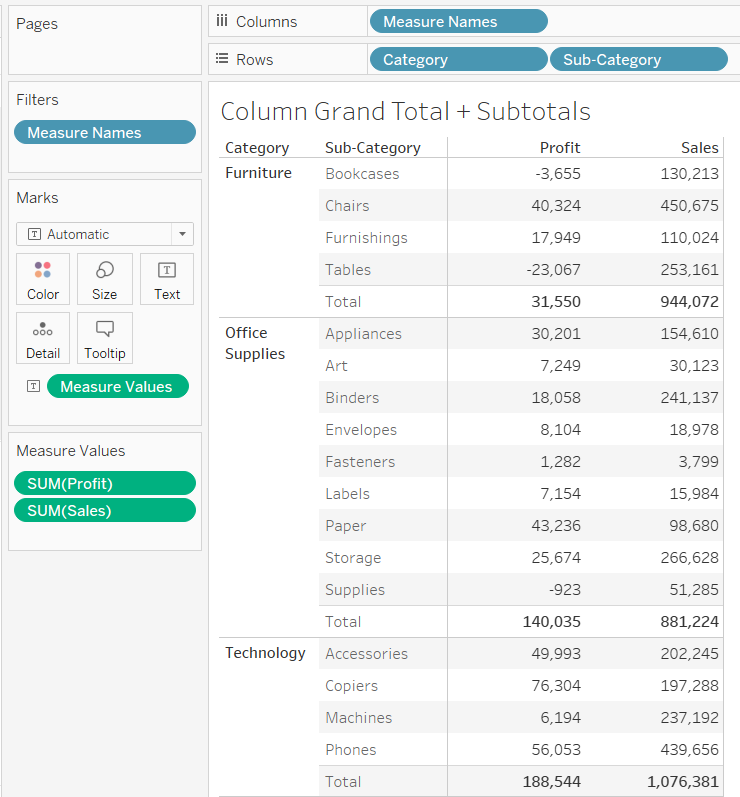
The output above shows that the subtotals are added per category. It is also possible to create and display column level grand total. Once again, go back to the Analysis tab and select Totals from the dropdown option, followed by Show Column Grand Totals.
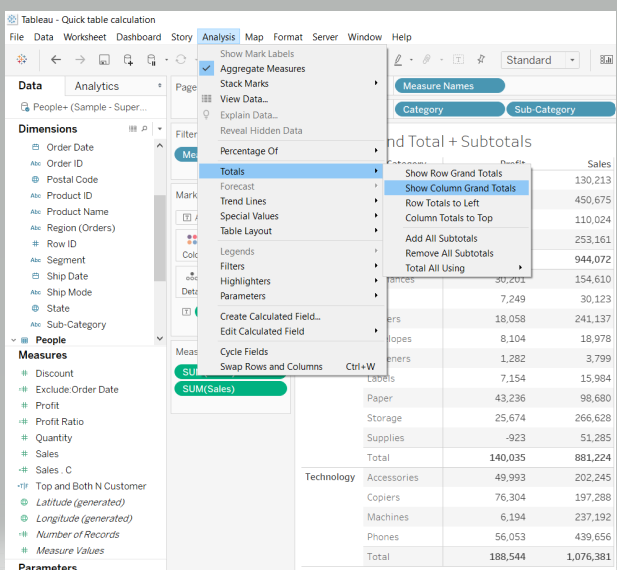
The above selection will generate the following output.
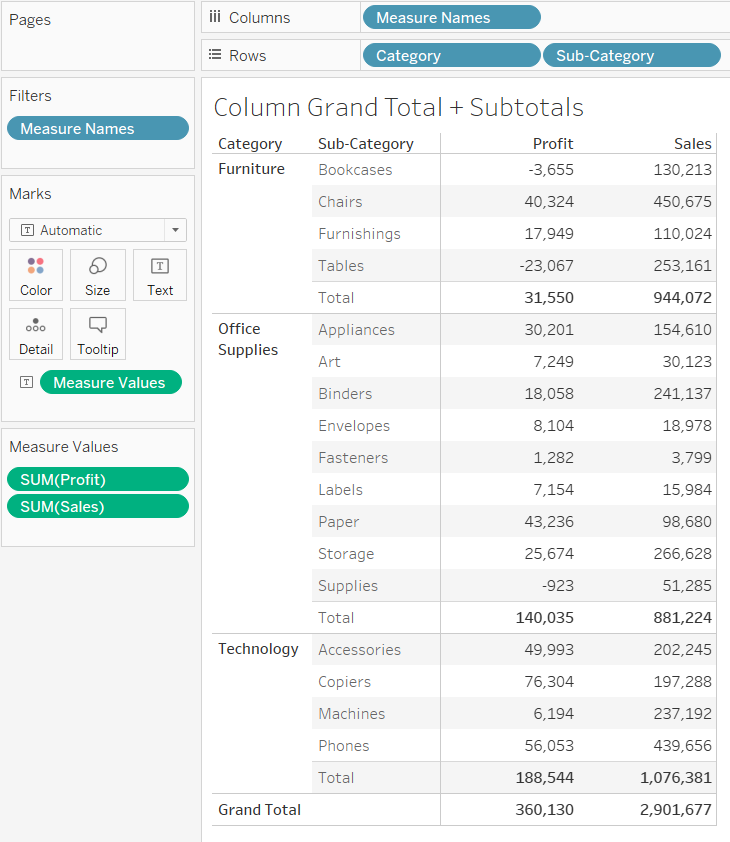
The output above displays the column level grand total.
Scenario 2: Row Level Totals and Sub-otals
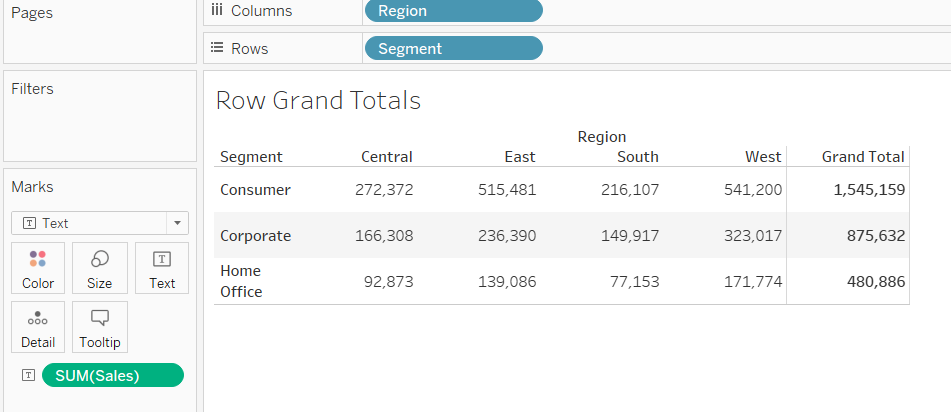
For the row level grand totals, make a new sheet and drag Segment into the Rows shelf and Region into the Columns shelf.
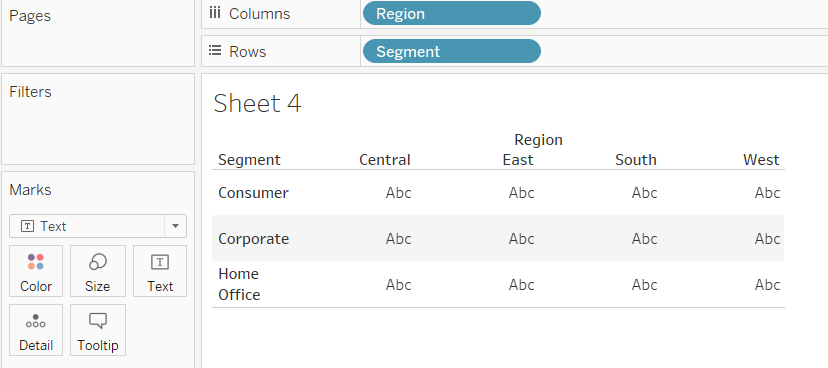
Next, drag the Sales field from the measure pane to the Text label in the Marks card.
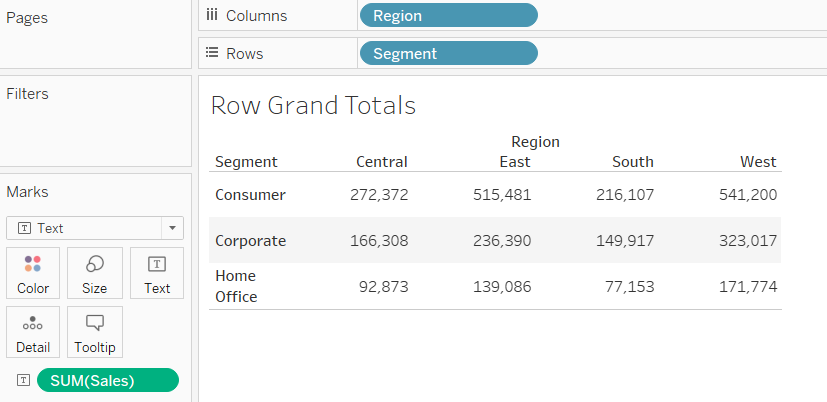
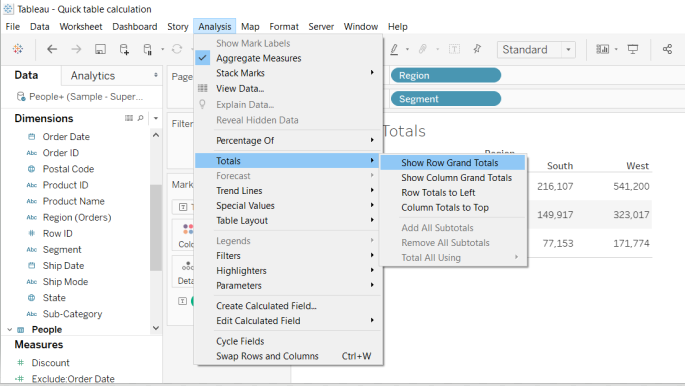
The next step is to go to the Analysis option and select Totals from the dropdown option, followed by Show Row Grand Totals.
The above steps will generate the following output.
Formatting and Customizing Grand Totals and Subtotals
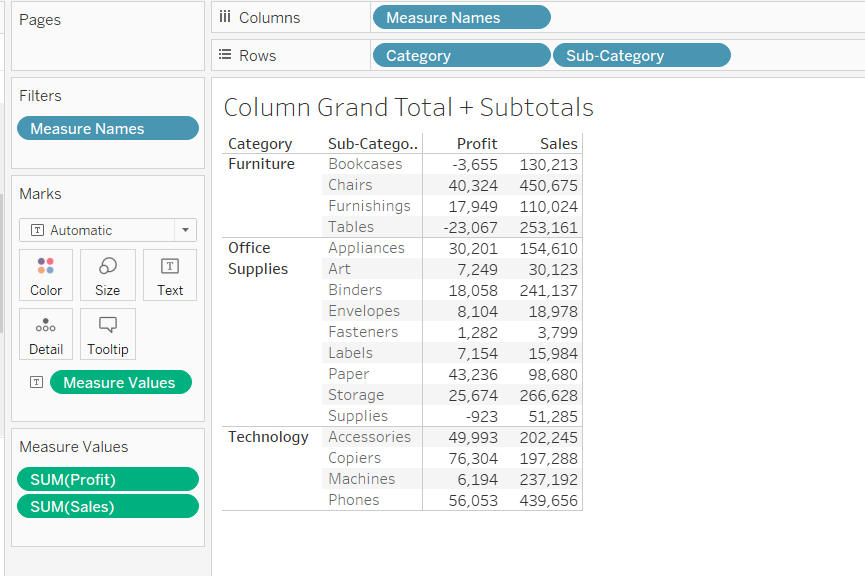
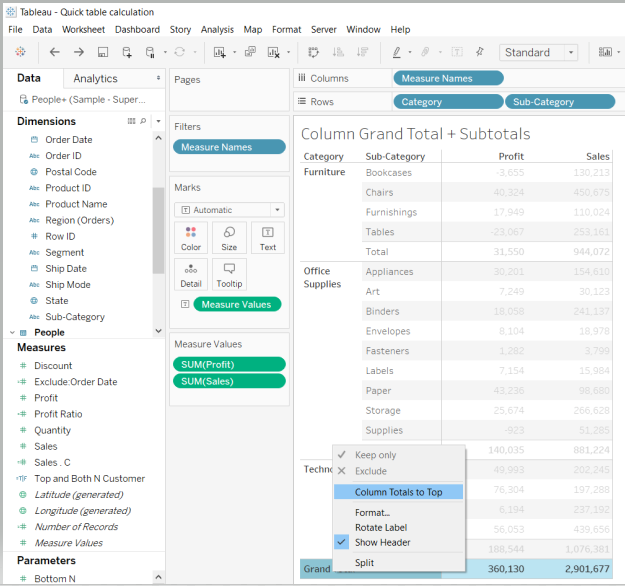
To understand how to format and customize grand totals and subtotals, use the example discussed in the first scenario of column level totals and subtotals. The image below displays the output.

By default, the grand total and subtotal are displayed at the bottom of the table. However, if you want to display the total at the top, then right click on Grand Total and select Column Totals to Top.
The above selection will generate the output below.
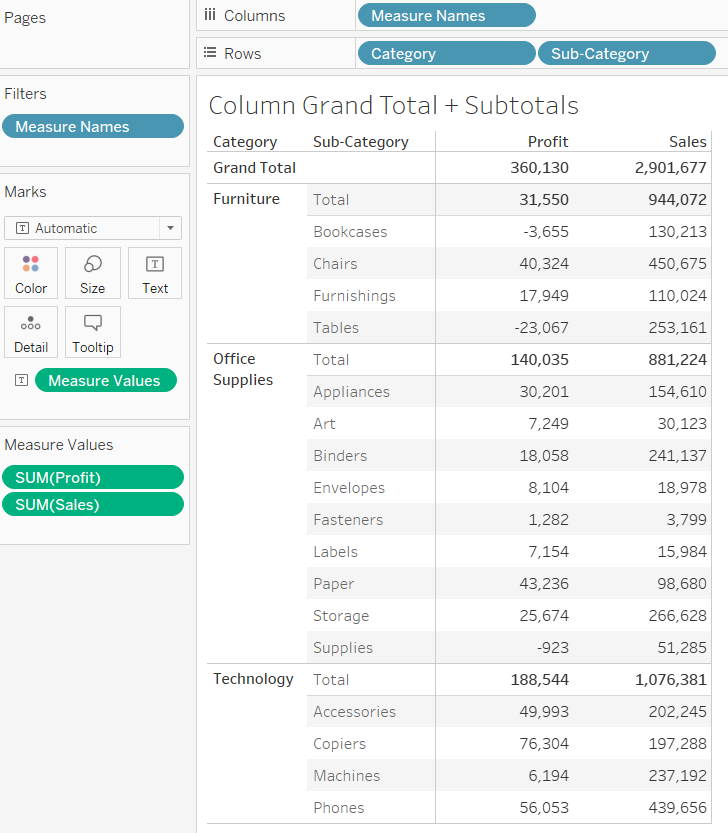
Formatting Options
There are various formatting options available in Tableau that can be used to highlight grand totals and subtotals to draw user attention. To start, right click on the Total and select Format, as shown below.
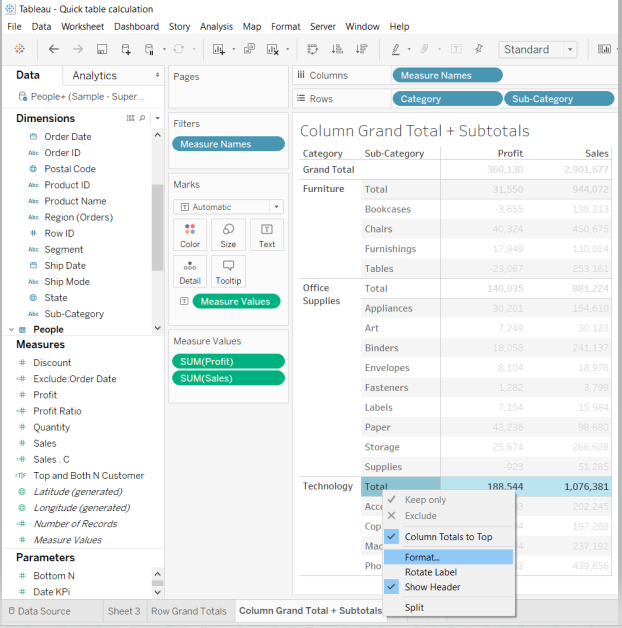
Completing the above step will open a format window that contains a section of totals and grand totals.
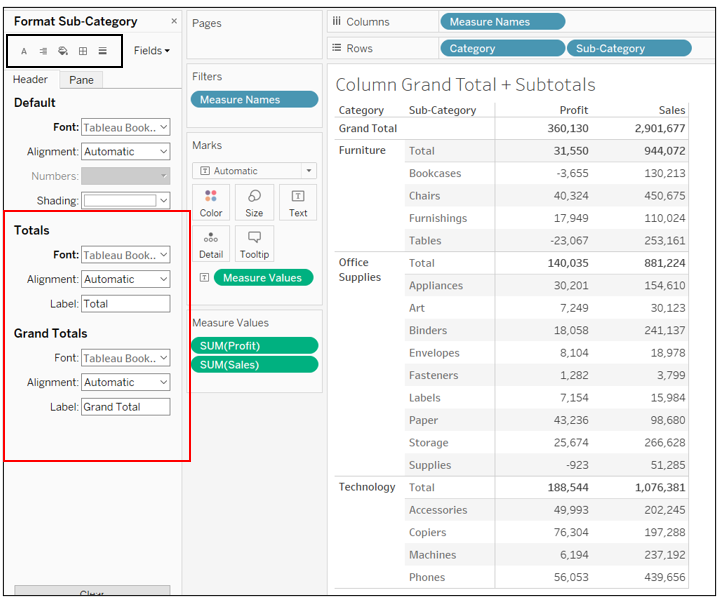
In the output above, the Format Sub-Category option takes care of various formatting options. Using the options available, you can format fonts, alignment, shading, and borders.
Conclusion
In this guide, you learned how to display grand total and subtotals in Tableau. You also learned about some different formatting options. This will strengthen your descriptive analytics capabilities.
To learn more about visualization and data analysis using Tableau, please refer to the following guides:
- Building Dual-Axis Combination Charts in Tableau
- Building a Box-and-Whisker Plot in Tableau
- Building a Time Series Chart in Tableau
- Building a Gantt Chart in Tableau
- Building a Bullet Graph in Tableau
- Use Built-In Statistical Modeling in Tableau
- Building a Burndown Chart in Tableau
- Adding Trend Lines to Continuous Charts in Tableau
- Create a Reference Band in Tableau
- Create a Reference Line in Tableau
Advance your tech skills today
Access courses on AI, cloud, data, security, and more—all led by industry experts.
