Data Literacy Essentials: Representing, Processing, and Preparing Data
Aug 24, 2020 • 11 Minute Read
Introduction
Nowadays, being able to understand raw data well is a crucial skill for all data and business professionals. Next comes choosing the correct data processing tools and handling data quality issues to prepare the data for business intelligence and analytics purposes. In this guide, you will learn about the different types of data, types of data representation, data processing tools, and data preparation processes to make data fit for business intelligence or data analytics use cases.
Types of Data
To begin with, there are fundamental classification categories for data sets that you should be aware of:
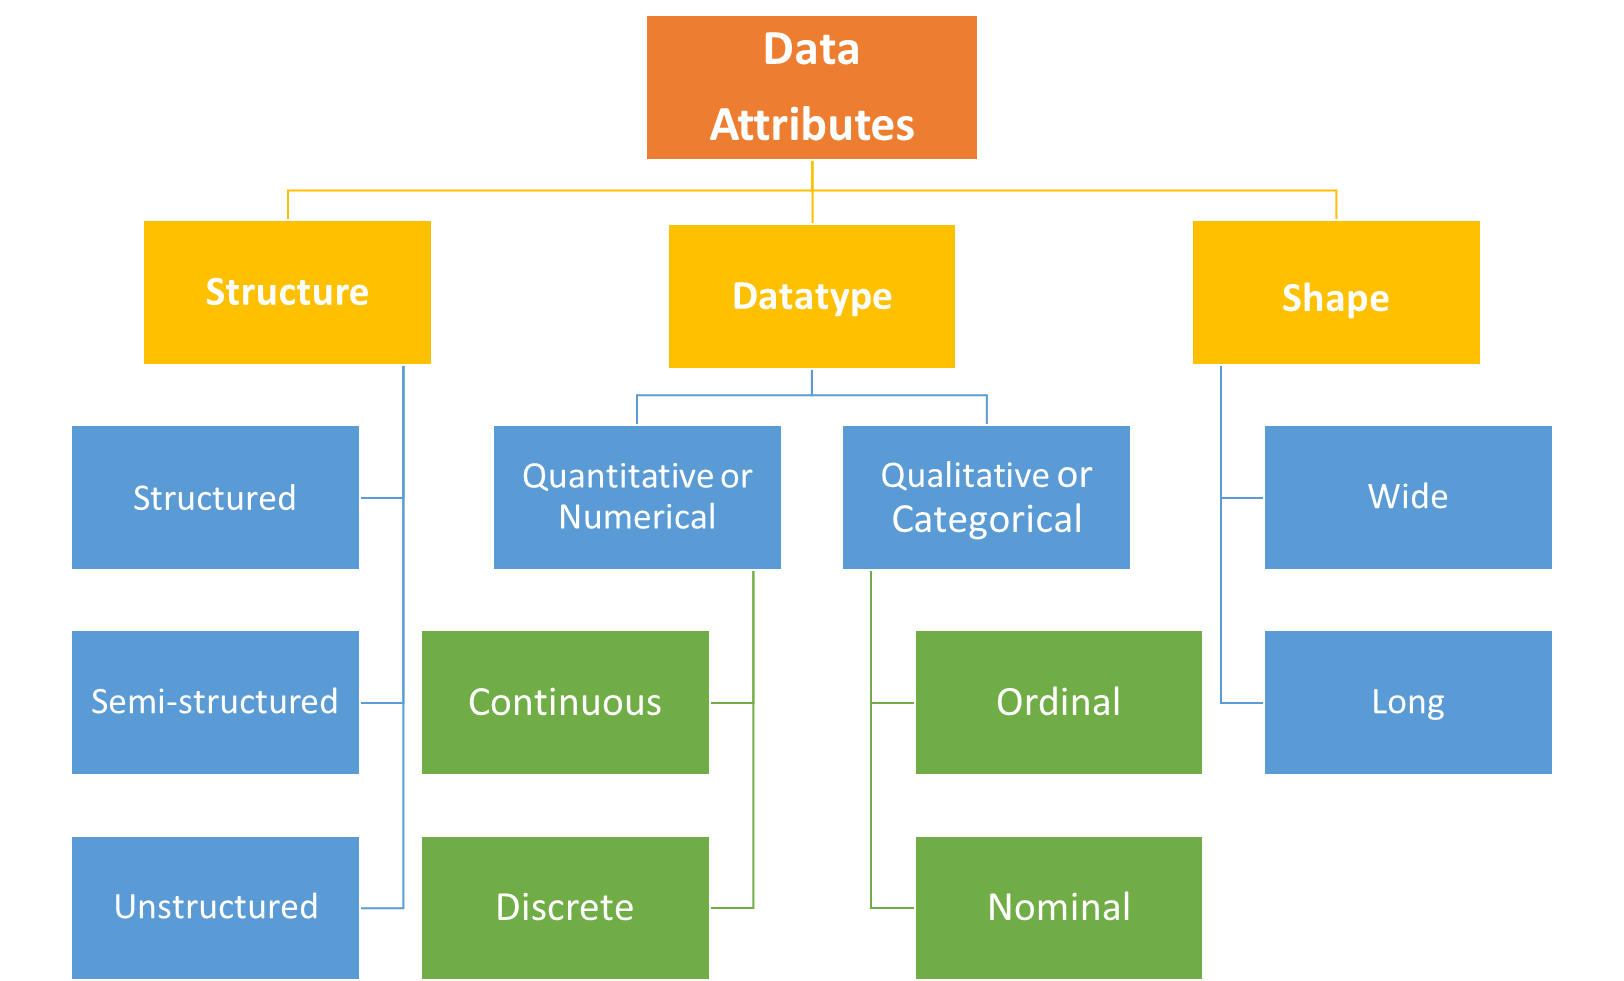
Based on a data set's structure, it can be classified as:
- Structured data – CSV Files, Database Tables, etc.
This type of data is what you will mostly encounter, since nearly all transactional systems and apps use a structured data store like a relational database as their backend. Since structured data has a schema/data model design that the complete data set adheres to, it is relatively easy to work with. CSV files (Comma Separated Value files) separate values using with commas as a delimiter to separate two fields. Other delimiters commonly used are tab, semi-colon, pipe, etc.
- Semi structured data – JSON, XML, HTML
JSON and XML are the data interchange formats that are mostly produced and consumed by APIs for data exchange or inter-module/system integration. JSON follows a key-value pair approach, whereas XML has a tag-based structure. These formats are more flexible in terms of data structure and a bit complex to work with. The HTML format, which is used for web development, is usually encountered in the case of a web-scraping requirement. For example, if a data table is required off of a Wikipedia webpage, the HTML code of the webpage is scrapped and parsed to obtain the required info.
- Unstructured data – Text, Images, Audio
Free-form text obtained from various sources like customer reviews of a product, social media posts, etc. and audio/video binary files don’t possess a defined structure. Because machine learning algorithms are based on statistics, unstructured data requires further processing to be converted into numerical format for deriving insights like topic detection, sentiment analysis, image segmentation, object detection, audio signal processing, etc. The hardware requirement for unstructured data is quite high—data size for images and audio files is far bigger compared to structured textual datasets, and more processing power is required. Such datasets are the most complex to work with since a large number of transformations and heavy processing is required.
Based on datatype, data can be classified as:
- Quantitative or Numerical – Continuous, Discrete
Data related to variables such as price of items, height/weight of individuals, number of orders, etc. is classified as numerical data. It is also referred to as a dependent variable, since numeric values on their own don’t make sense unless they are associated with a qualitative or categorical variable to give them context. If the numeric variable values are from a precise decimal scale, for example, the length of an item in centimeters, then they are referred to as a continuous variable. Otherwise, they are considered discrete variables, for example, number of orders placed.
- Qualitative or Categorical – Ordinal, Nominal
Data related to variables such as gender, color of vehicle, country name, etc. is classified as categorical data, and is also referred to as independent variables. Ordinal (or in-order) variables that have an inherent order, for example, temperature levels classified into high, medium, or low groupings, are called categorical variables. Categorical variables that don’t have an inherent order are known as nominal variables, for example, a variable like the color of an item could have any color value without inherent ordering.
The way a data set is arranged into rows and columns is referred to as the shape of data.
Based on its shape, data can be classified as:
- Long Data
Each row in a vertical or long data set represents one observation belonging to a particular category/instance. This makes it easier to work with for analytical purposes as it is granular in nature. Each column is considered a variable with multiple distinct values, across which you can derive certain insights and prepare reports from a data set.
- Wide Data
Usually reports are created in the form of a wide data format like pivot tables wherein statistical measures are taken across selected categorical variables. In contrast to long data, instead of individual observations in each row aggregations are stored across different categorical variables. It is coarse in nature since unit level or granular data is generally not there.
Representing Data

There are two phases for representing data in a business intelligence or data analytics life cycle:
Initial Representation Phase
The raw data set must be represented in a format that can be consumed by machine learning algorithms and/or business intelligence tools. For example, in the image processing use case in machine learning, the images are required to be represented as 3D numeric matrices since machine learning algorithms can only work with numerical values. Another challenge comes for categorical values, which are converted to numeric values using encoding techniques like one-hot encoding, label encoding, etc. In the case of free-form text data, the text is converted into vectors of numbers using a number of different natural language processing (NLP) techniques. This is also referred to as feature engineering in machine learning.
In the case of BI tools, the data is preferred to be in the vertical or long representation. These tools have provisions to unpivot the data inside the tool as well.
Final Representation Phase
In the final representation phase, insights are represented through visualizations in an intuitive manner. A few basic visual representation options for certain type of insights are:
- Comparison – Bar chart, column chart
- Composition – Tree map, pie chart
- Distribution – Histogram
- Relationships – Scatterplot
Depending on the user level, the dashboard can be:
- Exploratory
Preferred approach for analysts who require functionality to slice/dice and filter data, carry out what-if analysis, etc. as a part of the dashboard to explore the data further.
- Explanatory
Preferred approach for senior officials who need at-a-glance actionable insight represented in an intuitive way for policy making or business performance monitoring purposes with minimal interactivity.
Processing Data

There are multiple data processing techniques that are chosen as per the data type, data size, use case, and availability of underlying hardware/software. Either of them can be used individually or in a hybrid manner, as per the requirement.
- Spreadsheets – Excel, Google Sheets, etc.
Use case: If the amount of data is quite small (an Excel worksheet can work with at most 1 Million records), data transformations required are not too complex, and there is no concern over security/management of data.
- Databases – SQL, NoSQL, etc.
Use case: If the amount of data is larger and the data is required to be stored in a more reliable storage. Databases also provide control over the data management and security aspects.
- Programming Languages – Python, R, VBA, etc.
Use case: Automating the transformation workflow, data engineering pipelines, better transformation capabilities, macros, predictive analytics, etc.
- Data Preparation Tools – Alteryx, Tableau Prep, etc.
Use case: Enterprise-level data processing, GUI-based transformation workflow development and automation, self-service analytics, etc.
- Big Data Tools – Hive, Impala, etc.
Use Case: The amount of data is quite huge and low latency storage/retrieval/transformation is required.
Preparing Data

Data preparation is required to clean and transform the data into a format fit for business intelligence or data analytics. The data quality issues generally encountered are:
NULLs or Missing Data Values
Large number of missing data values or NULLs leads to ambiguity and impacts the model development in machine learning. There are two ways to deal with missing numeric values.
- Listwise Deletion
The complete record/row that has NULL value for a variable may be deleted, but this can result in bias if the data is not missing on random and may reduce sample size significantly in machine learning use cases.
- Imputation
Techniques like mean substitution, interpolation, and prediction can be used to fill in the NULLs, but each of these techniques has its own assumptions and implications. For example, mean substitution weakens the correlation between variables whereas the predicted values may strengthen the correlation.
Outliers
Numeric values a certain standard deviation away from the mean are known as outliers. Depending on the use case, more than three standard deviations from the mean may be considered the threshold to identify the outliers, or even 1.5 in some cases. The outliers can actually be valid values, but they could also be a result of wrong input. To deal with an outlier, any of these three techniques can be used: drop if erroneous, cap/floor to an upper value, or impute with the mean.
Incoherent Categorical Data Values
The issues encountered with categorical values are irregular letter case, spelling mistakes or non-standard inputs, numeric characters used within strings like zero for O, trailing, or preceding spaces. There are various techniques to resolve these depending on the processing medium being used. For example, there are functions like 'ISALPHA()', 'TRIM()', 'UPPER()', 'LOWER()', etc. available in databases for dealing with such issues. Tools like Alteryx and Tableau Prep have multiple modules for specifically cleaning categorical data. Invalid date and time values can also be dealt with using such techniques and tools.
Conclusion
In this guide, you learned about the essential concepts of representing, processing, and preparing data that are used in business intelligence and data analytics domains. These concepts will play a big role in your data literacy journey. For further learning, feel free to go through this amazing course.
Advance your tech skills today
Access courses on AI, cloud, data, security, and more—all led by industry experts.
