Discern the Three Types of Level of Detail (LOD) Calculations in Tableau
Jul 16, 2020 • 7 Minute Read
Introduction
An important feature in Tableau is Level of Detail expressions (also known as LOD expressions), which are used to compute values at the data source level and the visualization level. They are useful as they provide more control over the level of granularity you want to compute.
In this guide, you will learn how to discern the three different types of LOD calculations in Tableau:
- Fixed Level of Detail
- Include Level of Detail
- Exclude Level of Detail
In general, include LOD expressions are used to perform computations at a more granular level, whereas exclude LOD expressions are used for computations at a less granular level. Fixed LOD expressions are used when the level of granularity remains independent of the computation.
Data
This guide uses the sample superstore data source available in the Tableau repository.
Fixed Level of Detail
A fixed LOD expression is used to compute a value using specified dimensions without reference to the dimensions in the view. Follow the instructions below to create a fixed LOD expression to check the profit generated by each product category. In the view, you will have both product and sub-product categories. However, the profit will be displayed with respect to each product category, not subcategories.
Steps
-
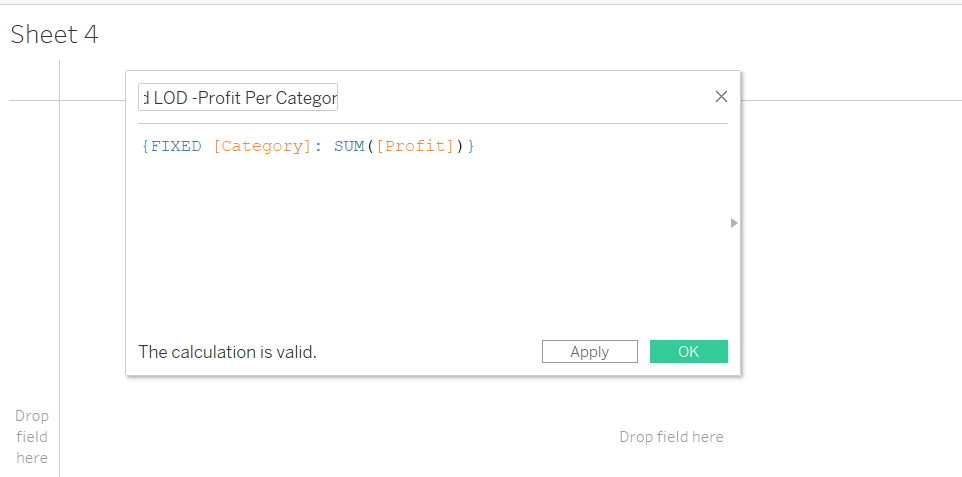
Click on the Analysis tab and select the Create Calculated Field option.
-
Write the fixed LOD expression to show the profit for every category. To do this, you’ll use the variables Profit and Category. This is shown below where the calculated field is named Fixed LOD - Profit Per Category.
-
Drag the Category and Sub-Category variables in the Rows shelf.
-
Drag the calculated field created in Step 2 into the Columns shelf.
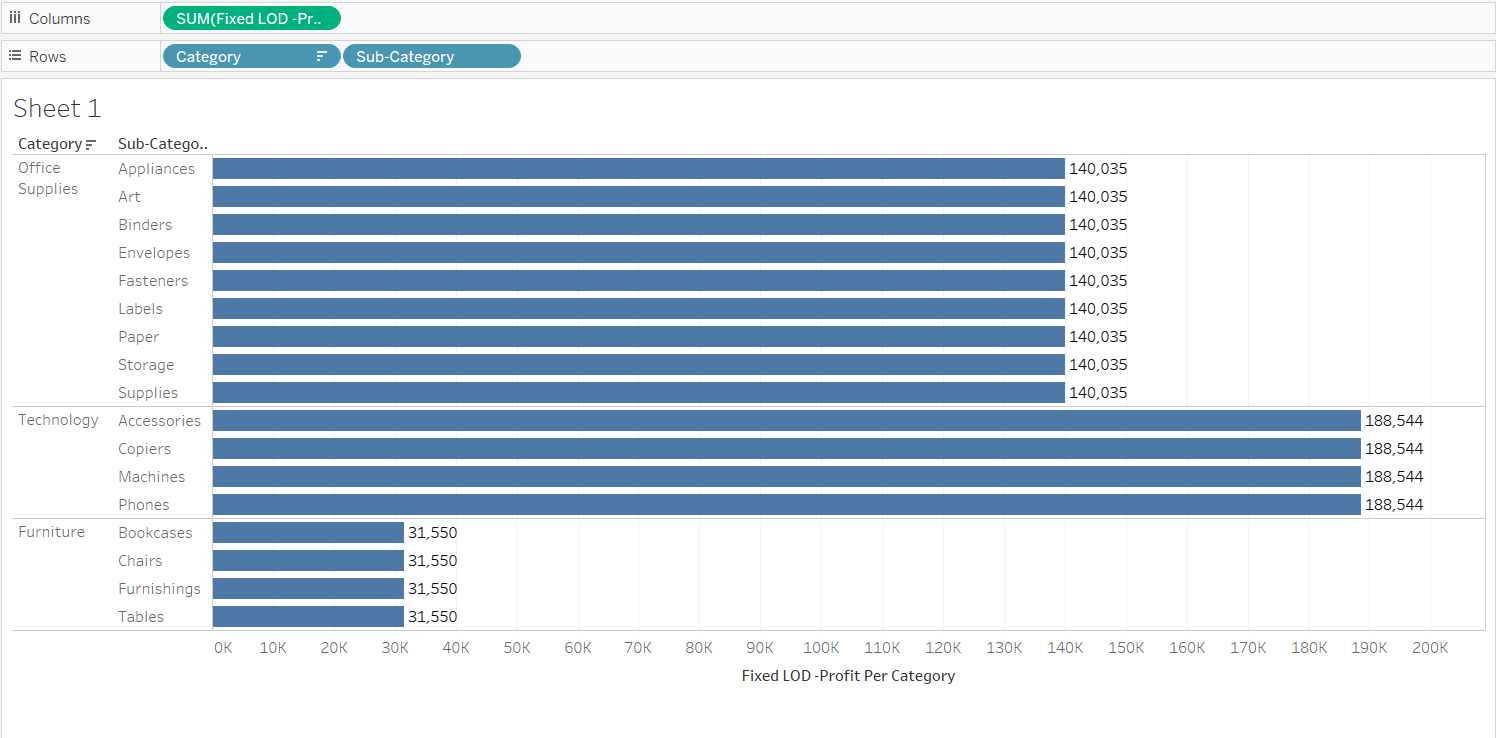
Even if you remove Category from the view, the measure will be calculated based on the dimensions specified in the expression. This means that the changes in the view do not impact the aggregation of the measure Profit, which is the feature of a fixed LOD expression.
Include Level of Detail
An include LOD expression is used to compute values using specified dimensions in addition to the dimensions available in the view. Create an include LOD expression to visualize the average sales per product across different segments.
Steps
-
To begin, click on the Analysis tab and select the Create Calculated Field option.
-
Write the include LOD expression to show the average sales per category. To do this, use the variables Sales and Product ID. The calculation is shown below where the calculated field is named Include LOD: Avg Sales Per Product.
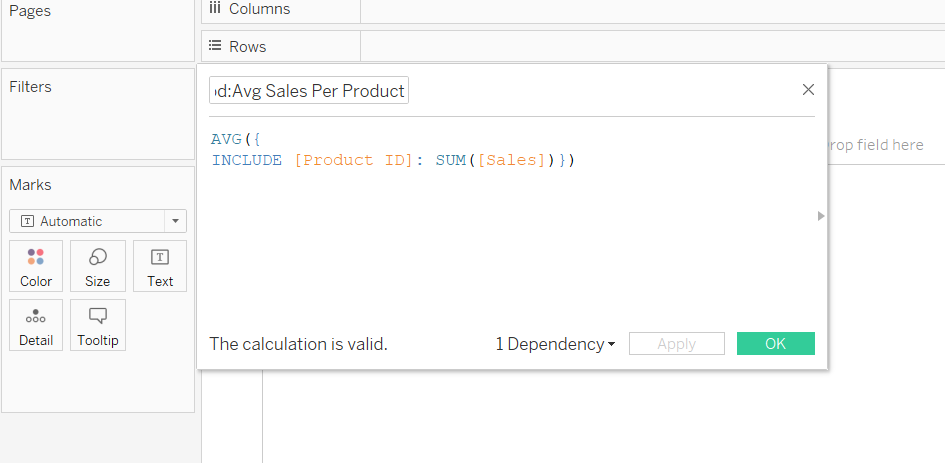
The calculation above expresses that at the granular Product ID level, summation of Sales will happen, while at the higher Segment level, aggregation will happen at the average level.
-
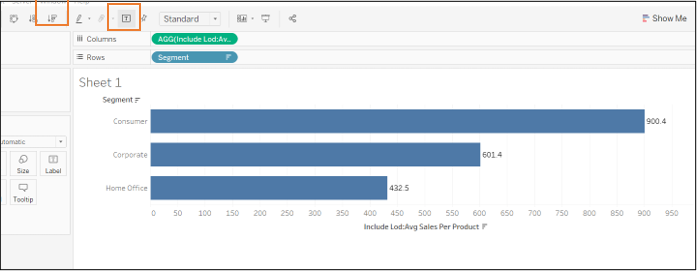
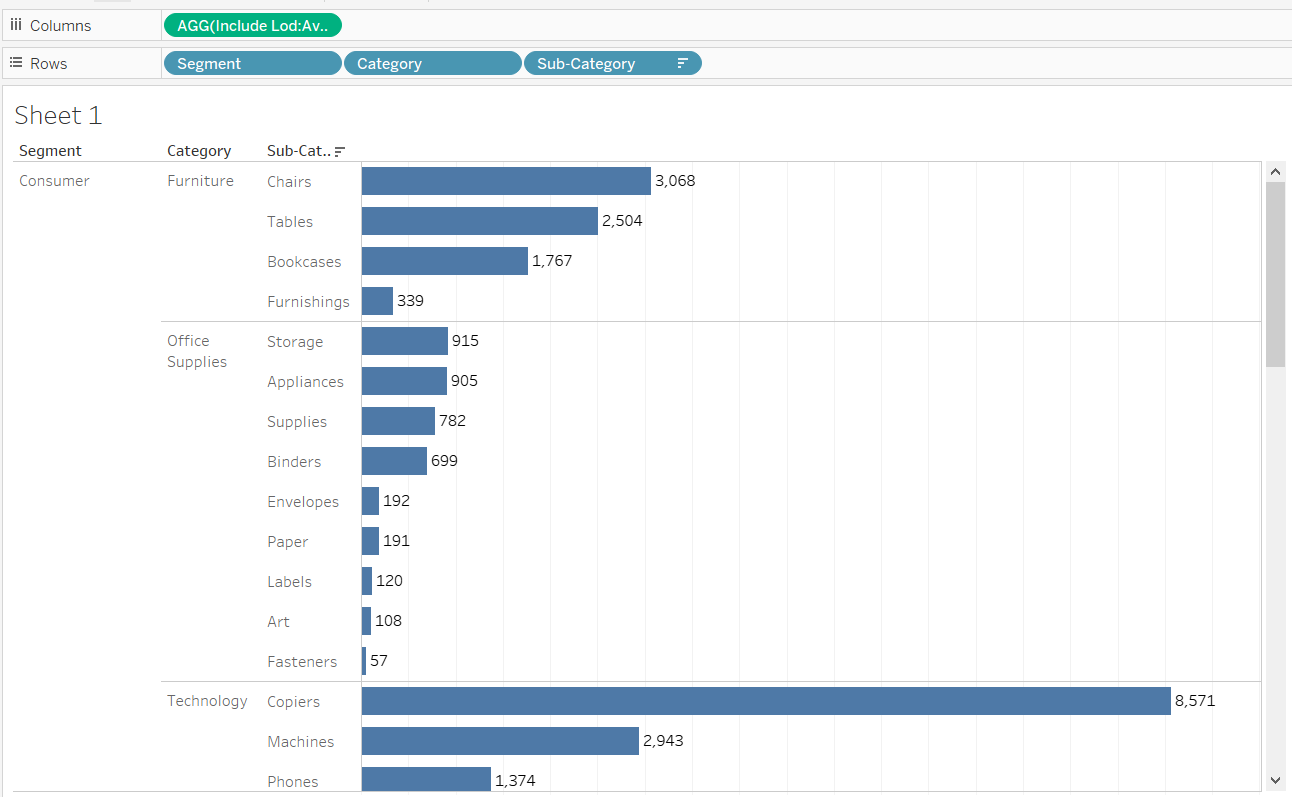
Drag the Segment variable into the Rows shelf and the calculated level of detail expression into the Columns shelf.
-
Turn the Text label on and sort in descending order. This will be fixed for each Segment as highlighted below.
- It is also possible to add more variables, like Category and Sub-Category, in the view along with the Segment variable. This will generate the following output.
Exclude Level of Detail
An exclude LOD expression is used to remove unwanted information from the data by creating an EXCLUDE function to omit the dimension at which aggregation is not required.
Create an exclude LOD expression to visualize the annual sales for each segment and category with respect to total sales while omitting the order date.
Steps
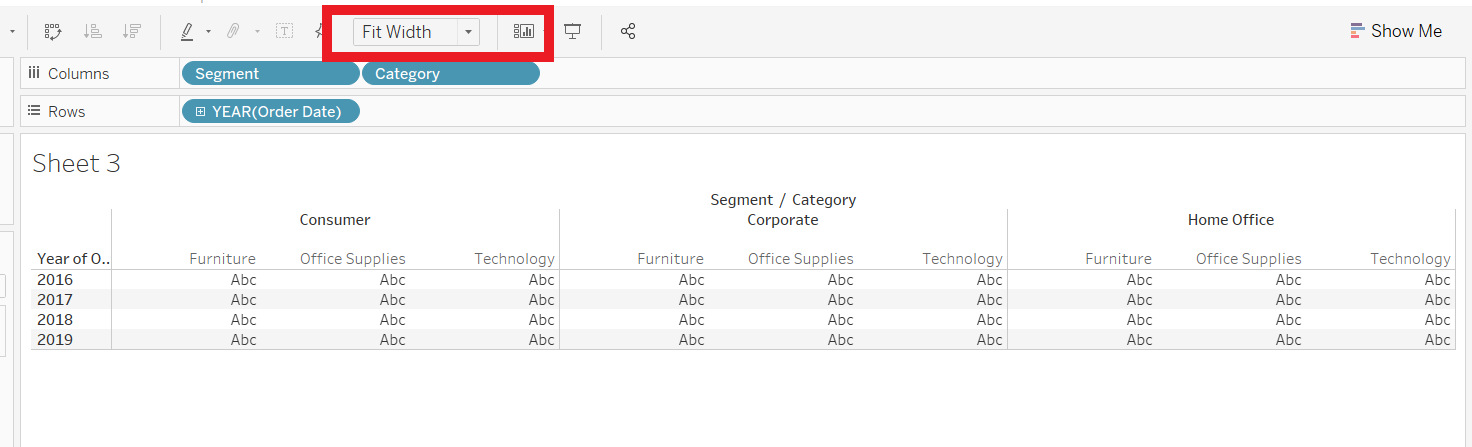
- Drag Segment and Category into the Columns shelf and Order Date into the Rows shelf.
-
Click on the Analysis tab and select the Create Calculated Field option.
-
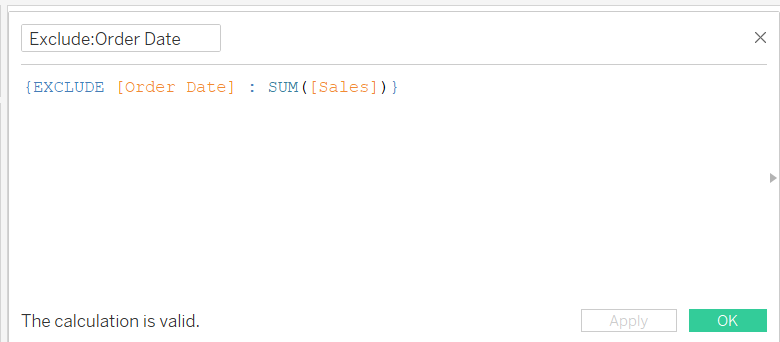
Write the exclude LOD calculation as shown below. This calculation will ignore the order date in the view.
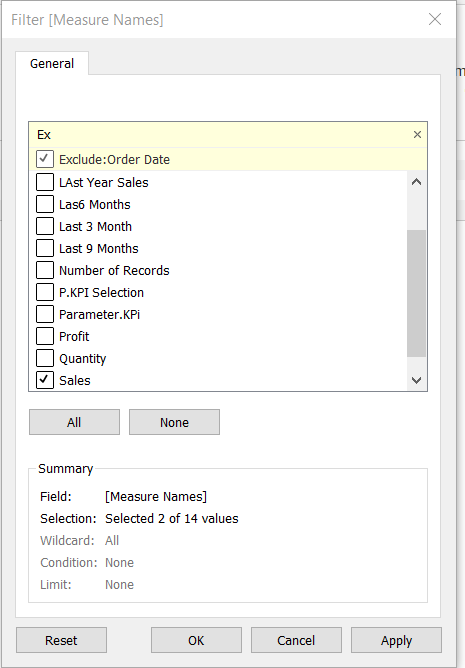
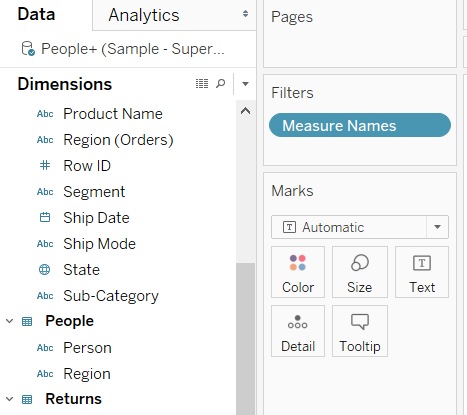
- Drag the measure names into Filter, select the options Sales and Exclude: Order Date, and click OK.
- After applying the filter, drag Measure Names into the Rows shelf, next to the Order Date variable, and Measure Values into the label of the Marks card. This is shown below.
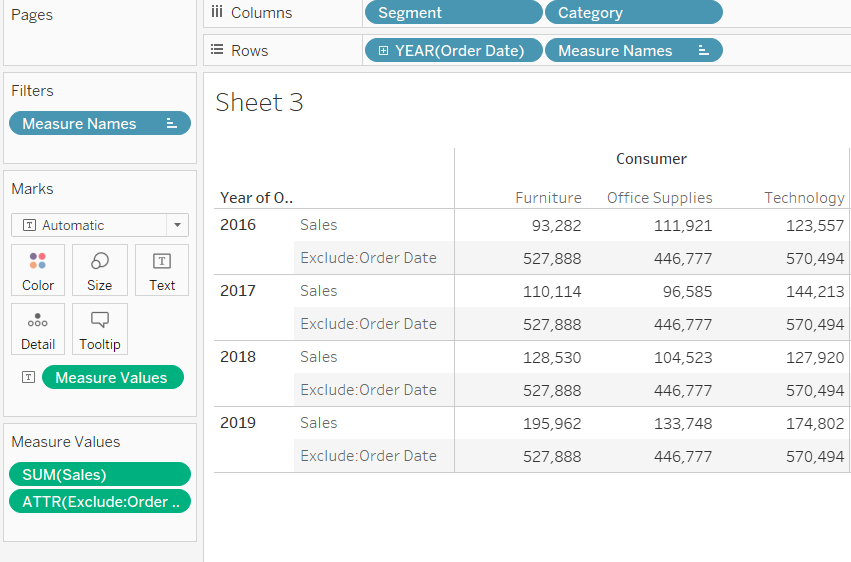
In the above output, you can see that the values of the excluded expression are replicated. This is because the total value remains the same as the Order Date is excluded. Also, this helps in comparing the contribution of individual year sales to the total sales across years.
Conclusion
In this guide, you learned how to create and discern the three different types of level of detail expressions—include, exclude, and fixed—in Tableau. This skill will help strengthen your descriptive as well as diagnostic analytics capabilities.
To learn more about visualization and data analysis using Tableau, please refer to the following guides:
Advance your tech skills today
Access courses on AI, cloud, data, security, and more—all led by industry experts.
