Building Features from Image Data in Python
Jun 16, 2020 • 10 Minute Read
Introduction
The increasing use of computer vision is making it important to know how to work with images. There is a lot of information stored in images, and pre-processing them helps extract useful information. This helps in image enhancement, image retrieval, image recognition, and visualization.
In this guide, you will learn techniques to extract features from images using Python. This has applications in medical image analysis, geospatial computing, robotic vision, and artificial intelligence.
Loading Images
In this guide, you will use the powerful scikit-image library to work with images. The scikit-image package is dedicated to image processing and uses native numpy arrays as objects to understand and store images. There are many inbuilt images in the package that you will use in this guide.
The first two lines of code below import the scikit-image package and the inbuilt data set. The last two lines of code plot the image.
      import skimage
from skimage import data, io
import numpy as np
from matplotlib import pyplot as plt
%matplotlib inline
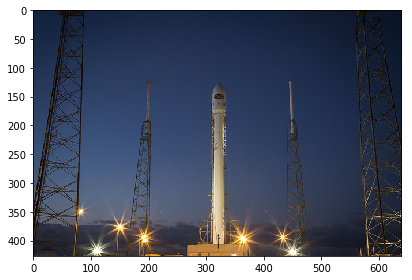
After loading the required libraries, the next step is to load some images. The first image you will plot is the image of a rocket. This is done with the code below.
      rocket = data.rocket()
io.imshow(rocket)
plt.show()
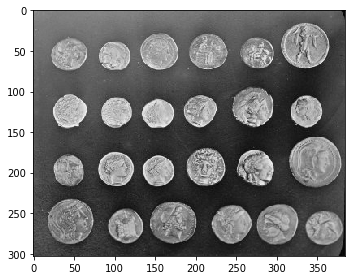
You will also load an image of coins with the code below.
      coins = data.coins()
io.imshow(coins)
plt.show()
You have loaded the images above and will learn a couple of important transformations next.
Color Transformation
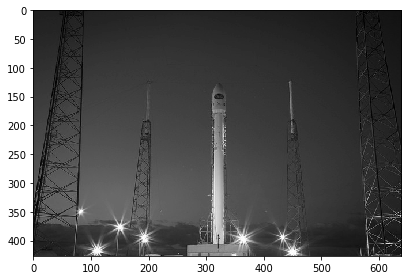
Sometimes you'll need to transform an image color to grayscale. This is done with the color module of skimage. The code below performs this transformation on the rocket image, using the color.rgb2gray() module .
      from skimage import color
grayscale = color.rgb2gray(rocket)

io.imshow(grayscale)
plt.show()
Flipping
You may also want to flip an image. The np.fluidup() function can be used for vertical flipping. The code below performs this task.
      # Flip the image in up direction
verticalflip = np.flipud(rocket)

io.imshow(verticalflip)
plt.show()
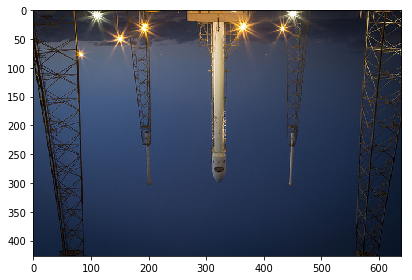
In this case, the image is inverted, but in many cases, you will receive the inverted image and need to flip it. This function will be handy in those cases.
Feature Extraction: Grayscale Pixel Values
Images are represented by pixels, which means that the simplest way to create image features is to use these raw pixel values as separate features. Start by printing the shape of the coins image.
coins.shape
Output:
(303, 384)
The number of features will be the same as the number of pixels, which in this case is the product of 303 times 384, or 116,352.
To arrange these pixels as features, you’ll use the reshape() function from numpy. The first line of code creates the features object using the reshape function, which takes image and its dimensions as input. The second line prints the shape and the features.
      features = np.reshape(coins, (303*384))
features.shape, features
Output:
((116352,), array([ 47, 123, 133, ..., 4, 10, 7], dtype=uint8))
The output above shows that you have the feature, which is a one-dimensional array of length 116,352.
Thresholding
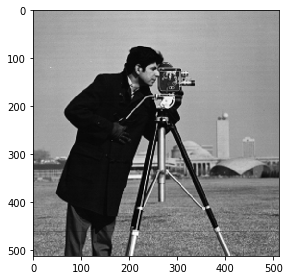
Thresholding is a technique used to partition an image into its foreground and background. This is the simplest method of image segmentation in which a cut-off is applied to the image pixel values to segment the background. To see how this works, start by loading an image of a camera with the code below.
      camera = data.camera()
io.imshow(camera)
plt.show()
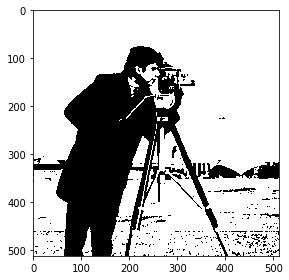
The next step is to apply the threshold value to segment the image. This is done with the code below. The first line arbitrarily assigns a threshold value of 100. The second line applies this to the image pixel values. The last four lines of code display the original and the thresholded image to show the difference.
      threshold_value = 100
camera_threholded = camera > threshold_value

# Show the original image
io.imshow(camera)
plt.show()

# Show the thresholded image
io.imshow(camera_threholded)
plt.show()
The importance of selecting the threshold value is illustrated by the example below, where the threshold is kept at 200.
      threshold_value = 200
camera_threholded = camera > threshold_value


io.imshow(camera)
plt.show()

io.imshow(camera_threholded)
plt.show()
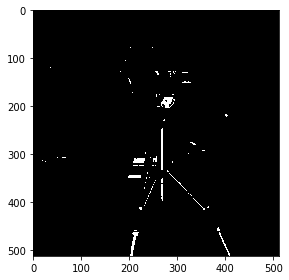
It’s obvious that selecting the wrong threshold value distorts the image to the point that it becomes useless.
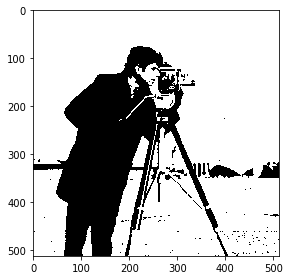
The solution is that instead of an arbitrary threshold value, you can use the Otsu method, which uses a simple heuristic method for finding the optimal threshold.
To do this, the first step is to import the threshold_otsu module, which is done in the first line of code below. The second line uses the threshold_otsu() function to obtain the optimal threshold value, while the third line applies it to the image. The last four lines of code display the original and the thresholded image to show the difference.
      from skimage.filters import threshold_otsu

threshold_value = threshold_otsu(camera)

camera_threholded = camera > threshold_value

# Show the original image
io.imshow(camera)
plt.show()

# Show the thresholded image
io.imshow(camera_threholded)
plt.show()
Edge Detection
One of the advanced image processing applications is a technique called edge detection, which aims to identify points in an image where the brightness changes sharply or has discontinuities. These points are organized into a set of curved line segments termed edges. You will work with the coins image to explore this technique using the canny edge detection technique, widely considered to be the standard in edge detection technique.
The first line of code imports the canny edge detector from the feature module. The second line converts the image to grayscale, which is a requirement for canny detector. The third line applies the canny edge detector module to the coins image. The last four lines of code plot the original image and the resulting image with edges.
      from skimage.feature import canny
coins = color.rgb2gray(coins)

# Apply Canny detector
coins_edges = canny(coins)

io.imshow(coins)
plt.show()

io.imshow(coins_edges)
plt.show()
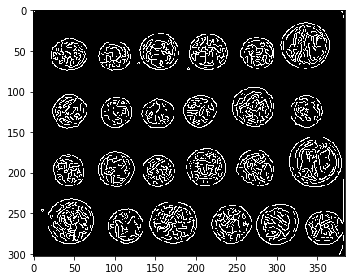
In the above image, you can now see the edges more clearly. Edge detection is widely used in applications like face detection, fingerprint matching, and medical diagnosis.
Conclusion
In this guide, you learned about building features from image data in Python. You learned techniques including transforming images, thresholding, extracting features, and edge detection. Finally, you learned how to perform these tasks using the popular and powerful scikit-image library in Python.
To learn more about data science using Python, please refer to the following guides.
Advance your tech skills today
Access courses on AI, cloud, data, security, and more—all led by industry experts.
