Explore the Analytics Pane in Power BI
Nov 20, 2020 • 7 Minute Read
Introduction
In visualization and BI, once you've got your report and visuals ready, you might still want to do some further analysis. For example, you might want to highlight a line indicating the minimum, mean or maximum values in the chart. In Power BI, the analytics pane captures all the analytical options available for any selected chart at your disposal. In this guide, you will learn how to explore and implement the analytics pane in Power BI desktop.
Data
In this guide, you will work with a fictitious data set of bank loan disbursal across years. The data contains 3,000 observations and 17 variables. You can download the dataset here. The variables to be used in this guide are described below:
-
Loan_disbursed: Loan amount (in US dollars) disbursed by the bank.
-
Month: Month of loan disbursal.
Start by loading the data.
Loading Data
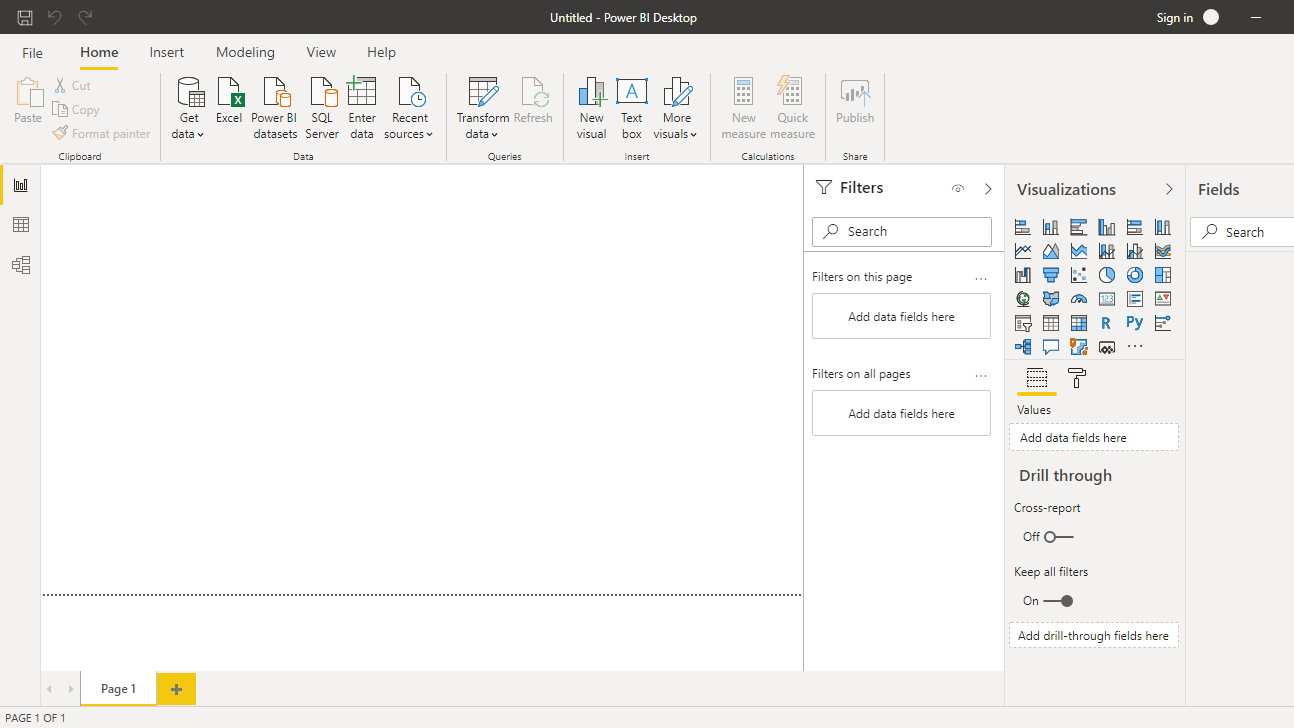
Once you open the Power BI Desktop, the following output is displayed.
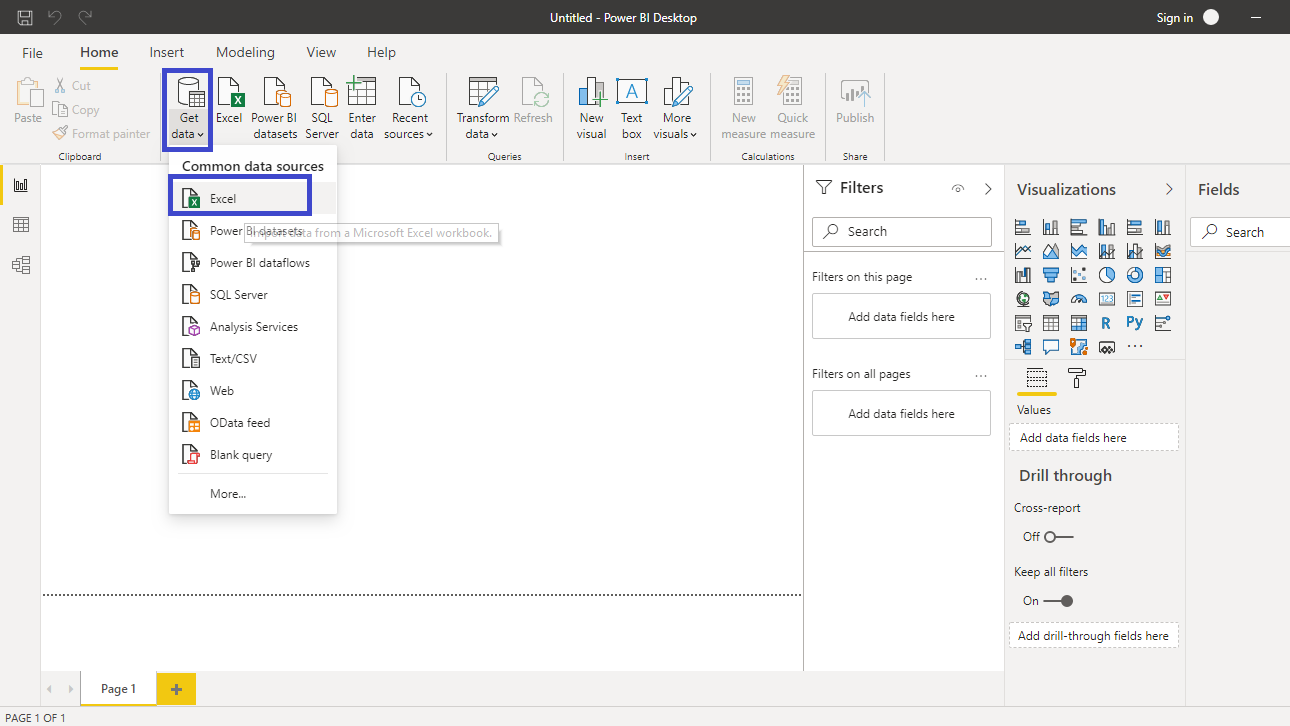
Click on Get data option and select Excel from the options.
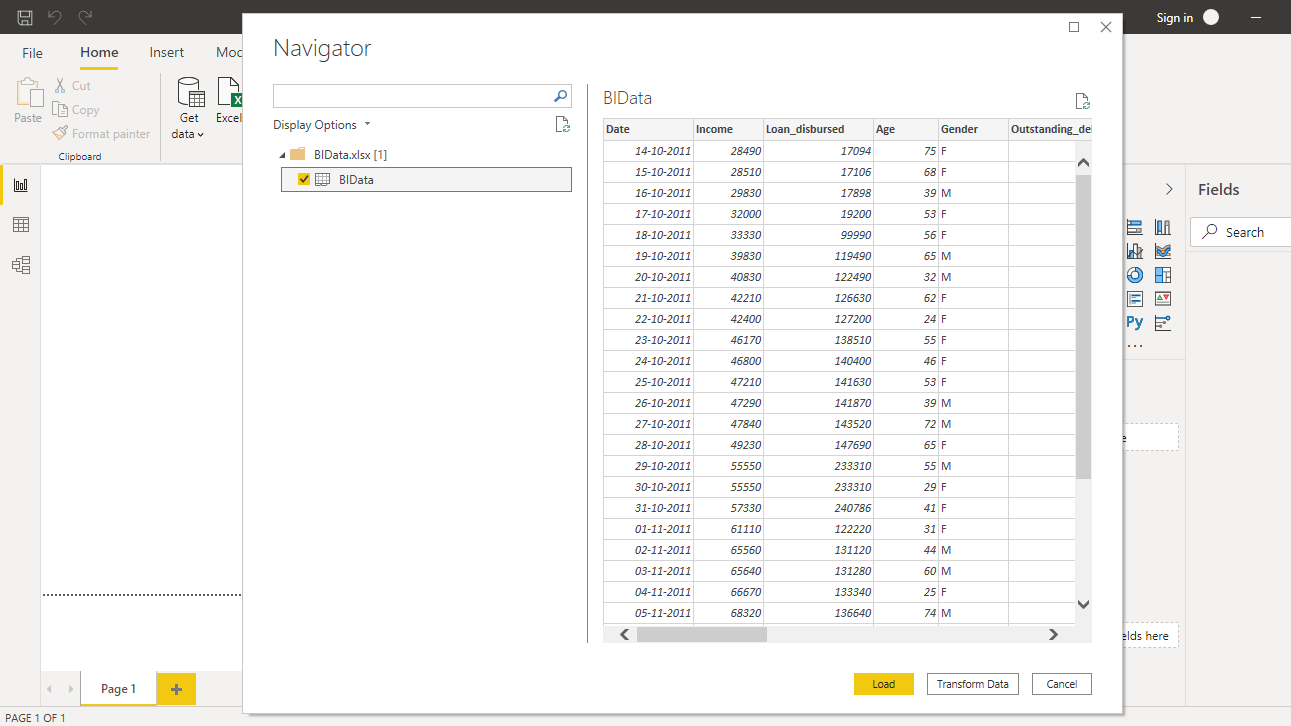
Browse to the location of the file and select it. The name of the file is BIdata.xlsx, and the sheet you will load is BIData sheet. The preview of the data is shown, and once you are satisfied that you are loading the right file, click Load.
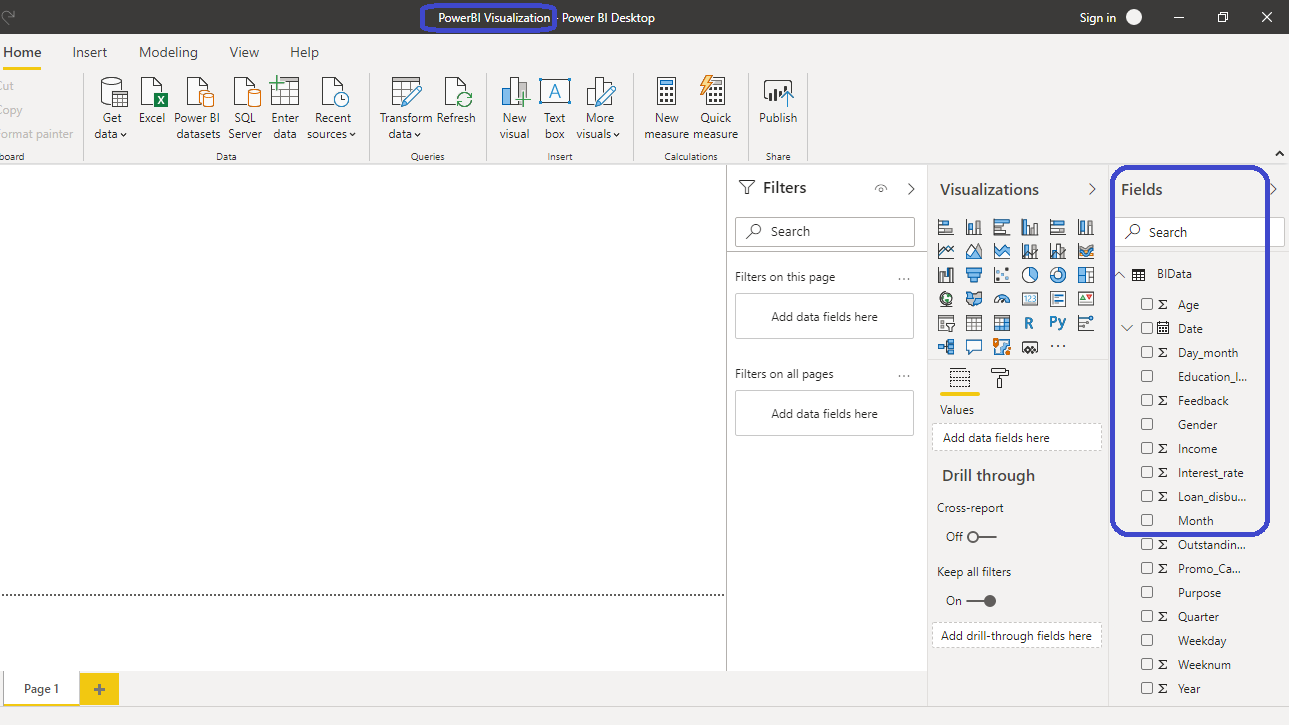
You have loaded the file, and you can save the dashboard. It is named PowerBI Visualization. The Fields pane contains the variables of the data.
Adding Visualization
To begin, you will need a chart, table, or matrix. You will create a clustered column chart in this guide. You can locate it in the Visualizations pane. Click on the chart and it will create a chart box in the canvas. Nothing is displayed because you haven't yet added the required visualization arguments.

You can resize the chart on the canvas. The next step is to fill the visualization arguments under the Fields option as shown below. Drag the variable Month into the Axis field, and Loan_disbursed in the Values field.

The output above shows the Loan_disbursed by Month chart. You can perform some formatting options. For example, you can turn on the Data labels option as shown below.

You can also increase the size of the labels. Set the Text size to 12.

The desired chart is created, and you can now explore the analytics pane.
Analytics Pane
Once you have a chart selected, you might want to perform several analytical operations on it. To look at the options available, select the chart, and look at the Analytics option. This looks like a little magnifying glass.

You can see all the analytical options available for this chart.
Plotting Minimum and Maximum Lines to the Chart.
Click on the Min line option as shown above and click Add. You can change the Color and Transparency as shown below. This will create the resulting output.

Repeat the process for Max line option and you can keep a different color for contrast.

The above output shows that the minimum and maximum values are $24 million and $49 million, respectively.
Adding Average Line to the Chart
The minimum and maximum lines are good, but often as analysts you want to look at the average line. Click on the Average line and click Add. You can change the Color and Transparency as shown below. This will create the resulting output.

The average monthly loan disbursed stands at $37 million.
Adding Percentile Lines to the Chart
Outlier detection is an important task in business intelligence and machine learning. One of the common techniques of doing this is to cap the outlier points with certain percentile values. In this case, you will select the tenth and ninetieth percentile point for outlier detection.
Start by removing the lines by clicking on the x sign. This is not necessary, but you can do it to understand the percentile line better.

Once you have removed the lines, it will result in the following output.

Click on the Percentile line and click Add. Set the percentile value to 90.

The output shows that the line around the ninetieth percentile value is plotted in the chart.

To add the tenth percentile value, click again on Add as shown above, and set the percentile value to 10.

Now you have the chart with required percentile values. The values outside these two percentile lines will be considered outliers. In this case, the values $24 million, $48 million, and $49 million are outliers.
Conclusion
Analytical skills are one of the most sought after and in-demand skillsets of this decade. It is a sector agnostic skill and is used in every organization across sectors. Power BI Desktop provides many useful analytical features in the analytics pane, and this knowledge will help you strengthen your analytics and business intelligence capabilities.
To learn more about building powerful visualization in Power BI desktop, please refer to the following guides:
Advance your tech skills today
Access courses on AI, cloud, data, security, and more—all led by industry experts.
