Getting Data in Power BI
Nov 24, 2020 • 6 Minute Read
Introduction
Power BI supports several visualization charts. However, before building these visualizations, you will be required to get the data. Organizations have data stored in different formats and in different places. This guide will demonstrate how to get and load data in Power BI Desktop from different sources.
Load Excel Data to Power BI
To start, open the Power BI Desktop and save it as PowerBI Visualization.
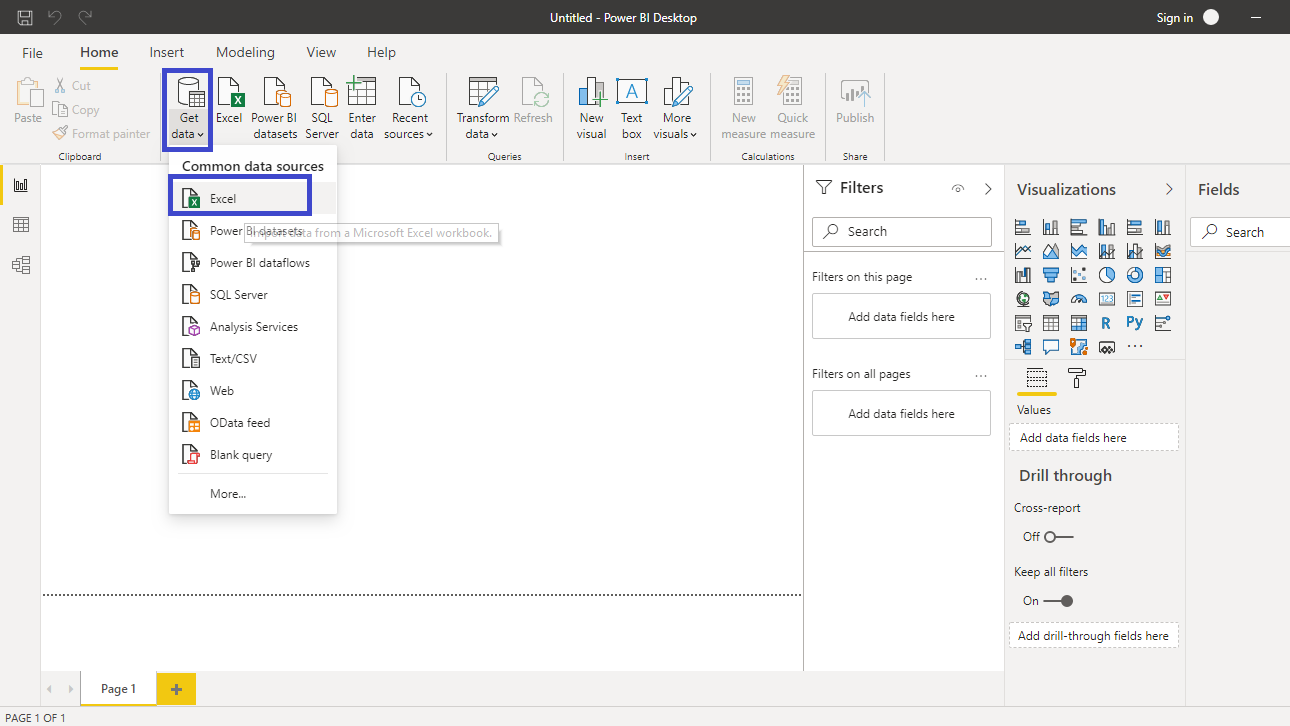
Click on Get data option and select Excel from the options.
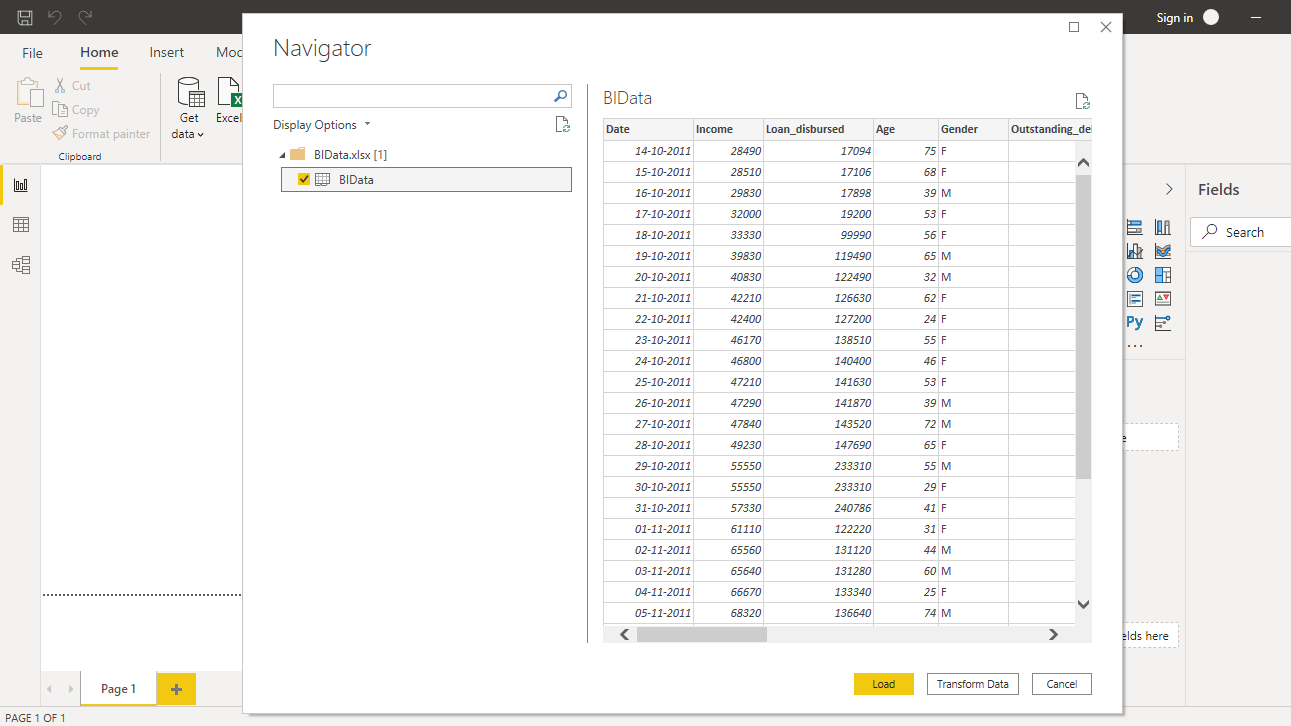
Browse to the location of the file and select it. The name of the file is BIdata.xlsx, and the sheet you will load is BIData sheet. The preview of the data is shown, and once you are satisfied that you are loading the right file, click Load.
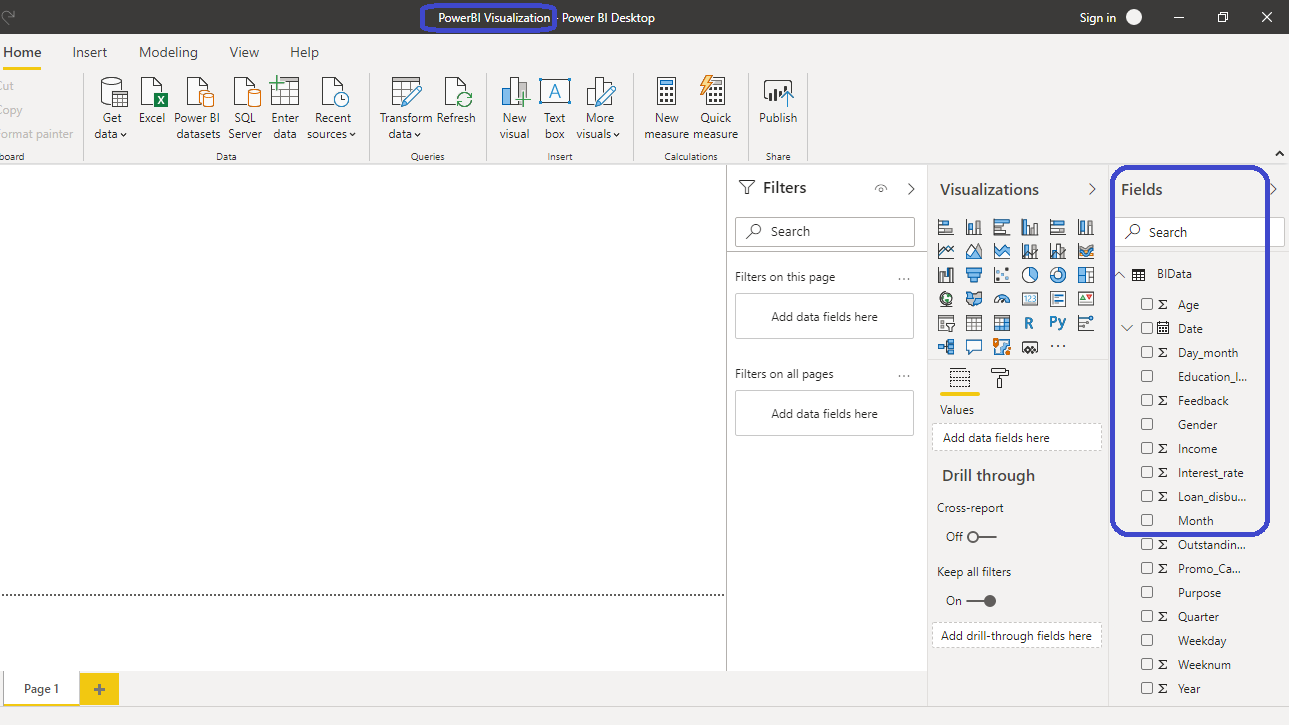
You have loaded the Excel file in the canvas, and the Fields pane contains the variables of the data. This is a fictitious data set of bank loan disbursal across years. You can download the dataset here.
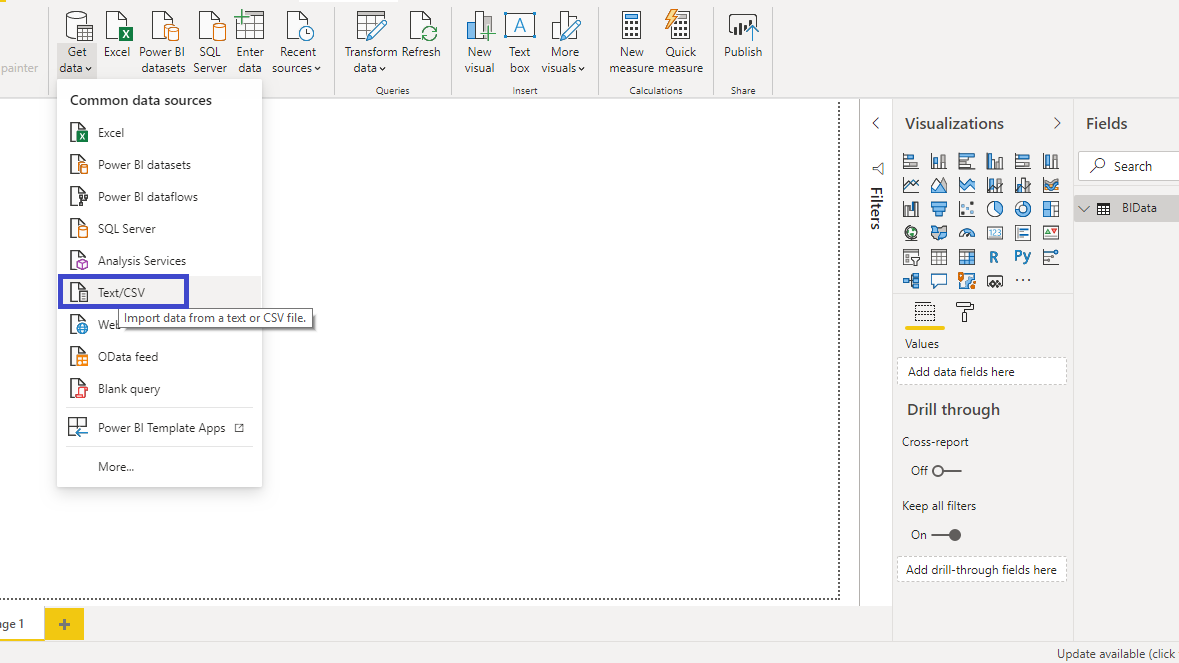
Load Text or CSV Data to Power BI
Comma separated or CSV files are a common file format in data science and machine learning. You can import this file type by clicking on Get data option and select Text/CSV from the options.
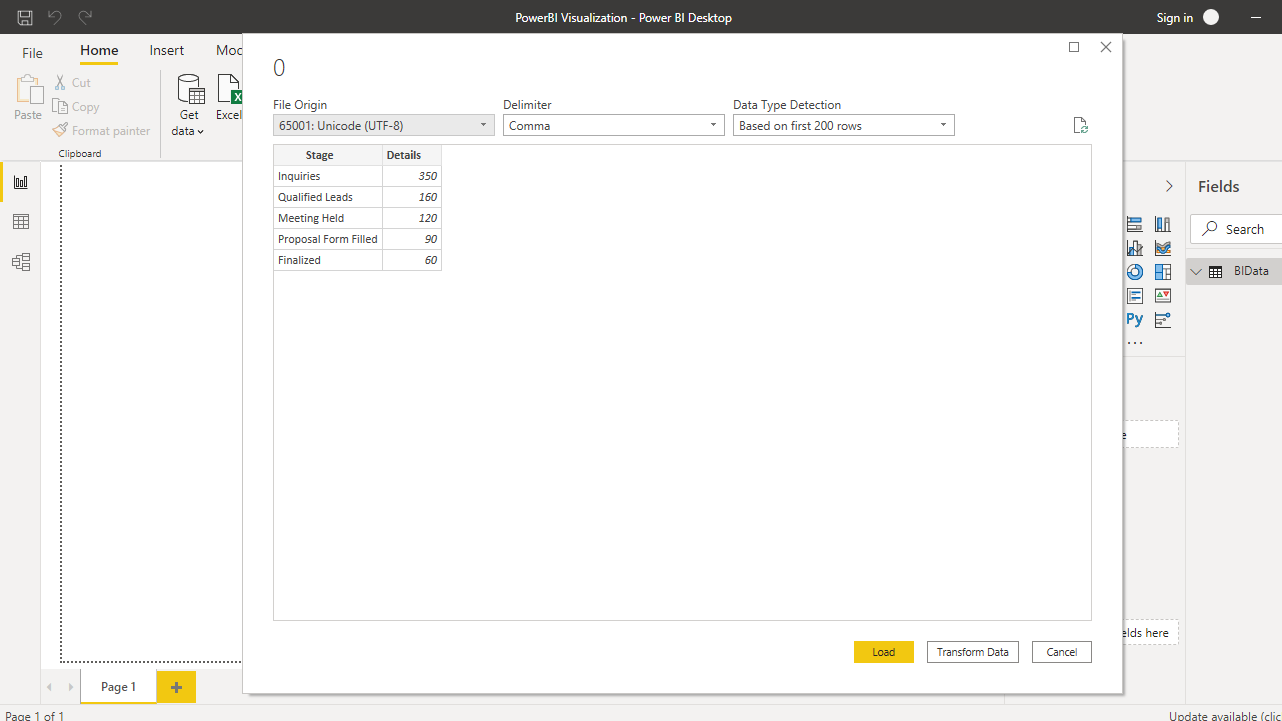
Browse to the location of the file and select it. The preview of the data is shown, and once you are satisfied that you are loading the right file, click Load. The file name is funnelchartdata, which is a fictitious sales conversion data. You can download the dataset here.
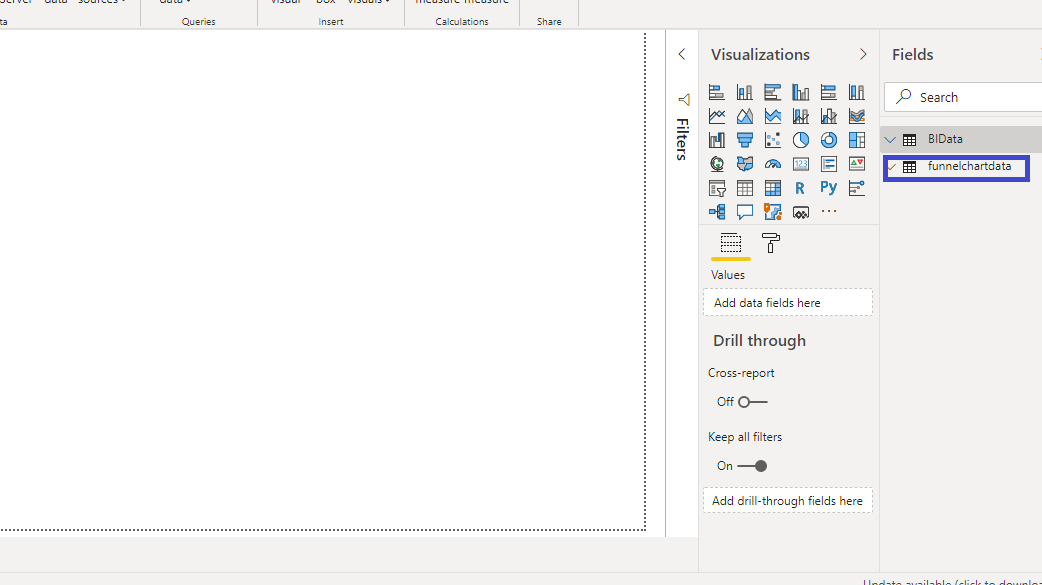
You have loaded the file, and the data is now available in the canvas.
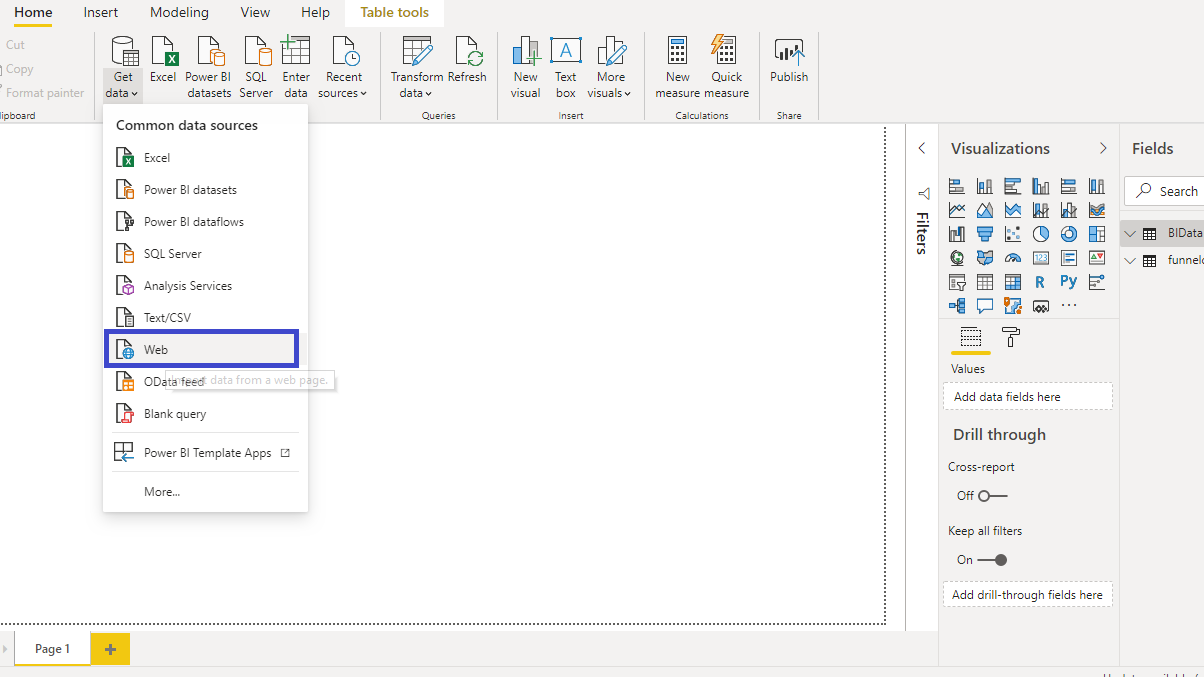
Get Data from the Web
Sometimes you are required to load data directly from the web. Power BI provides the option to get data from the web. To begin, click on Get data option and select Web from the options.
This will open a tab where you can enter the web link as shown below. The data comes from Wikipedia, and you can visit the link here.
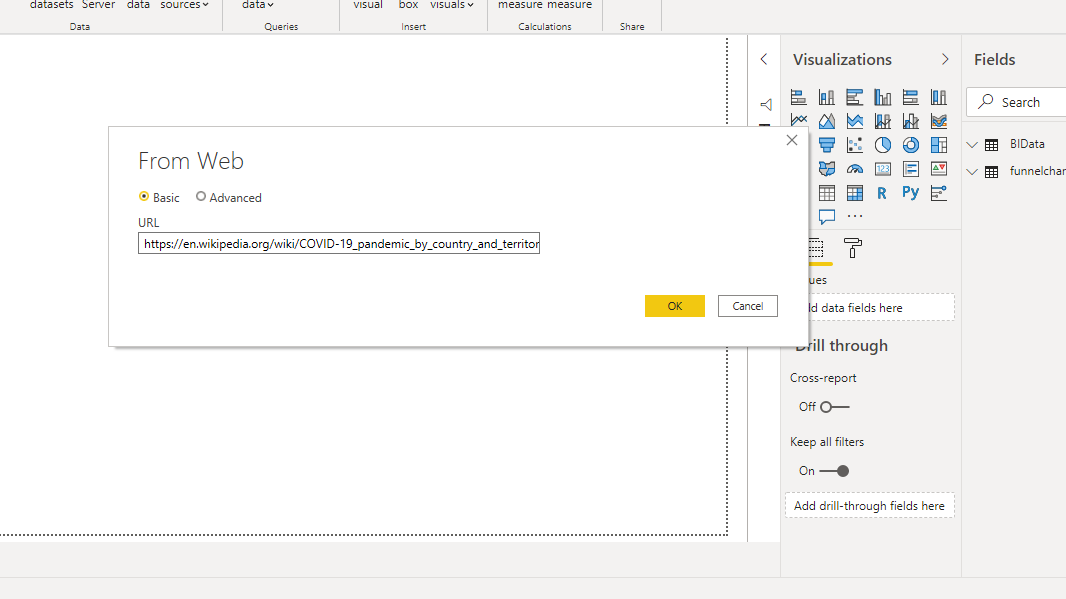
Click OK to open a new window.
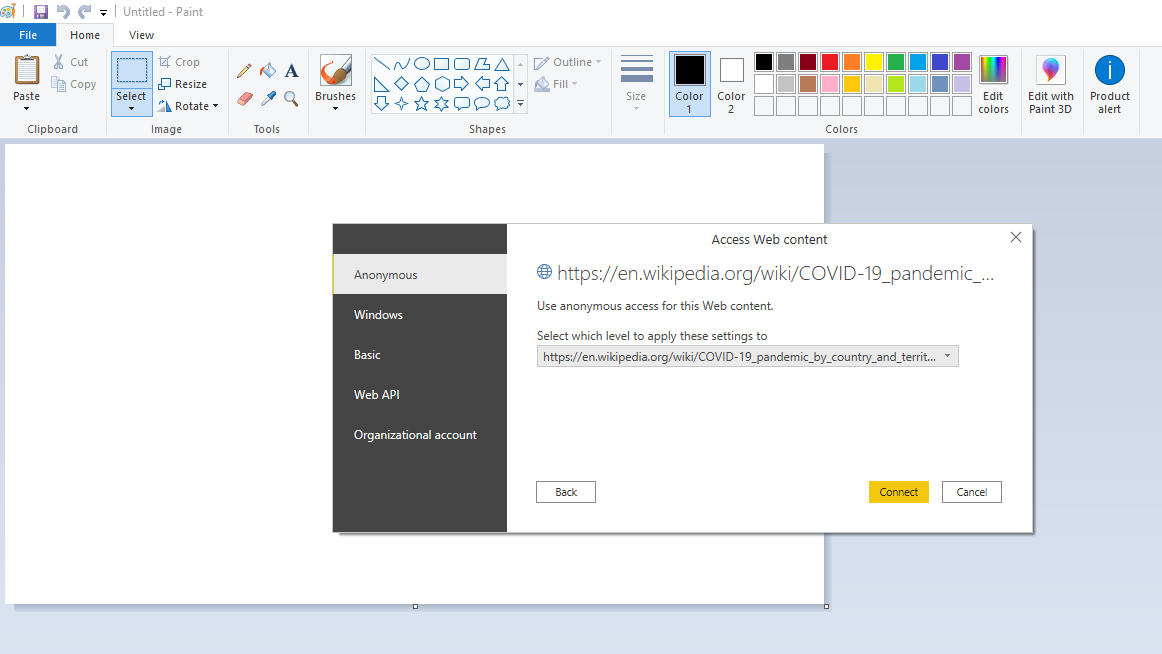
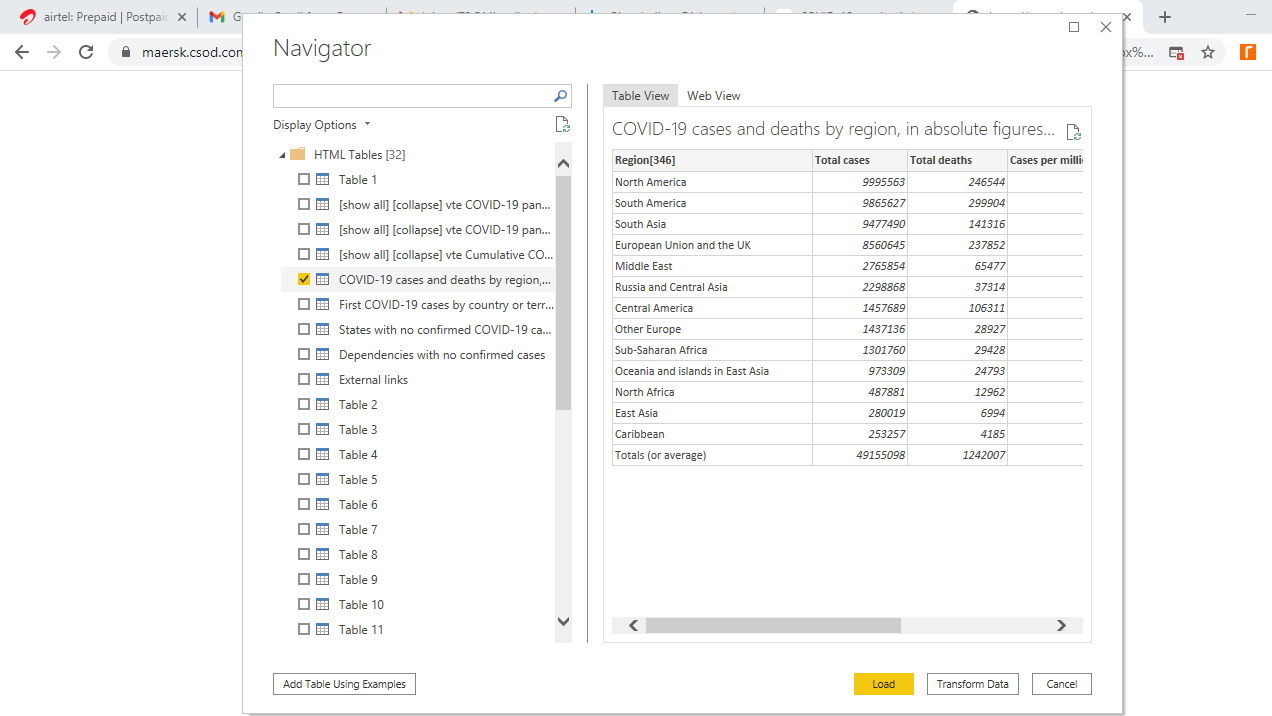
Click Connect to open a page that previews the data. Click Load to load the data.
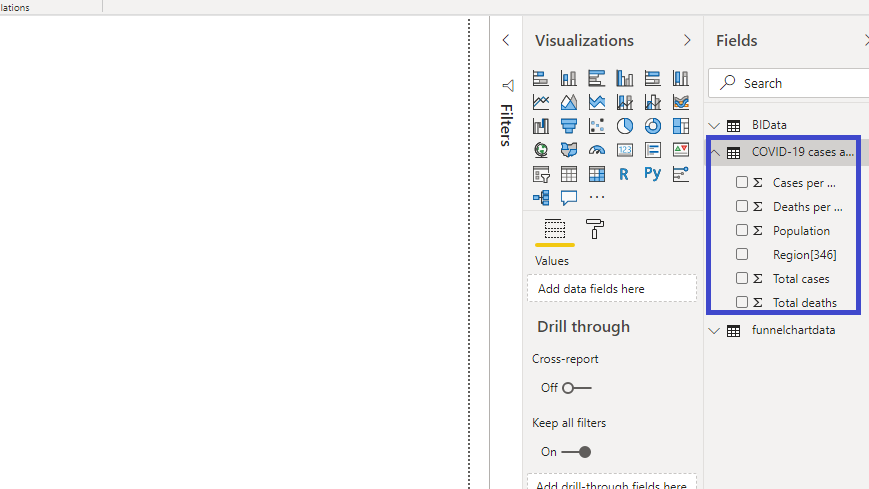
You have loaded the web file in the canvas, and the Fields pane contains the variables of the data.
Other Options to Load Data
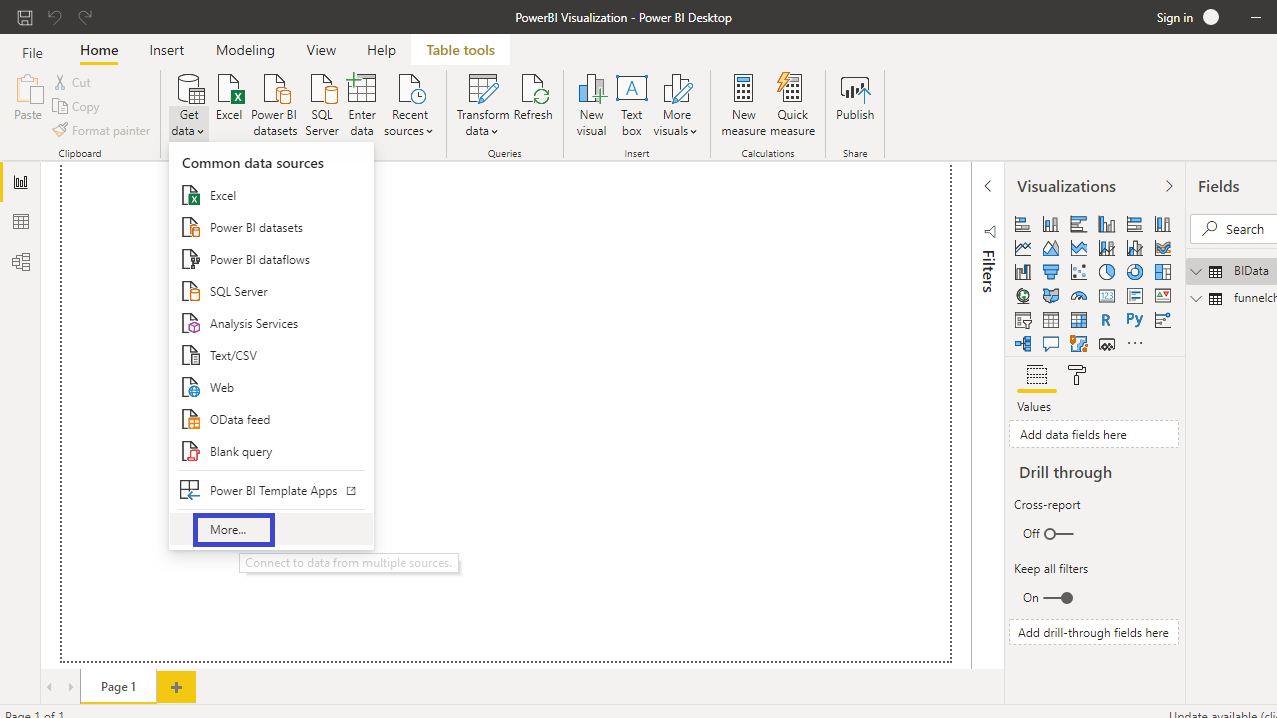
Apart from the common options to get data in Power BI Desktop, there are a variety of other options also available in Power BI. To view these options, click on Get data option and select More from the options.
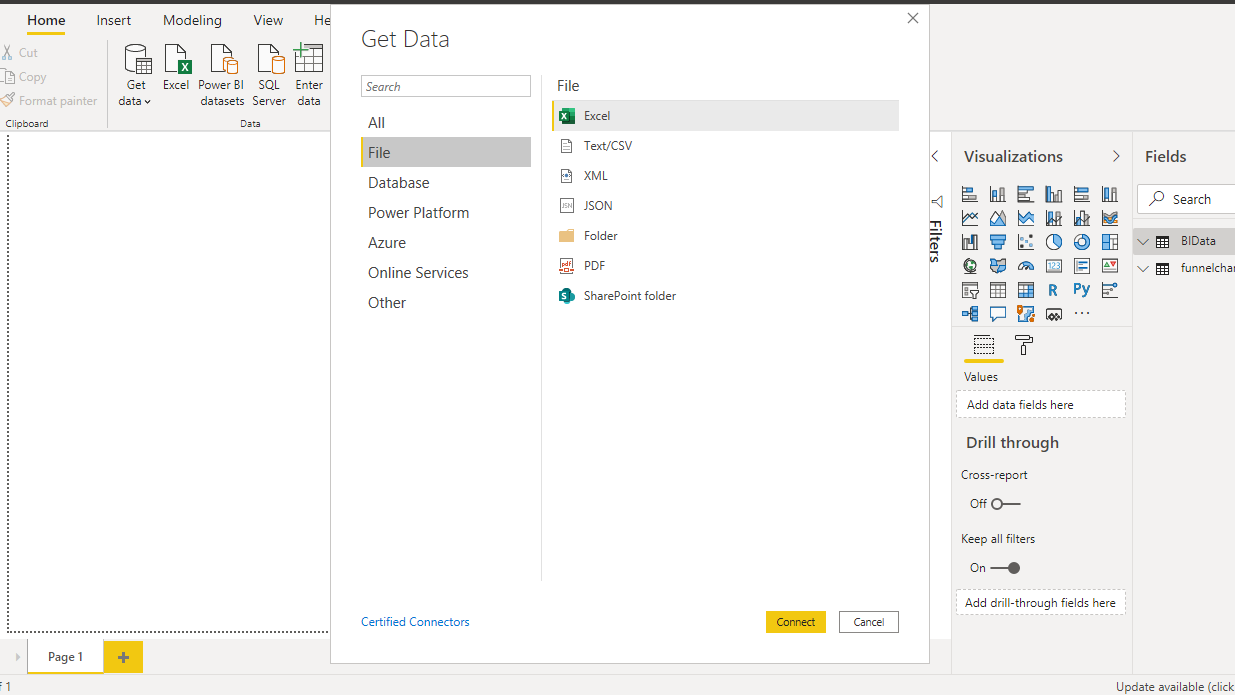
A new window is opened, where on the left side it shows a category of all available data sources.
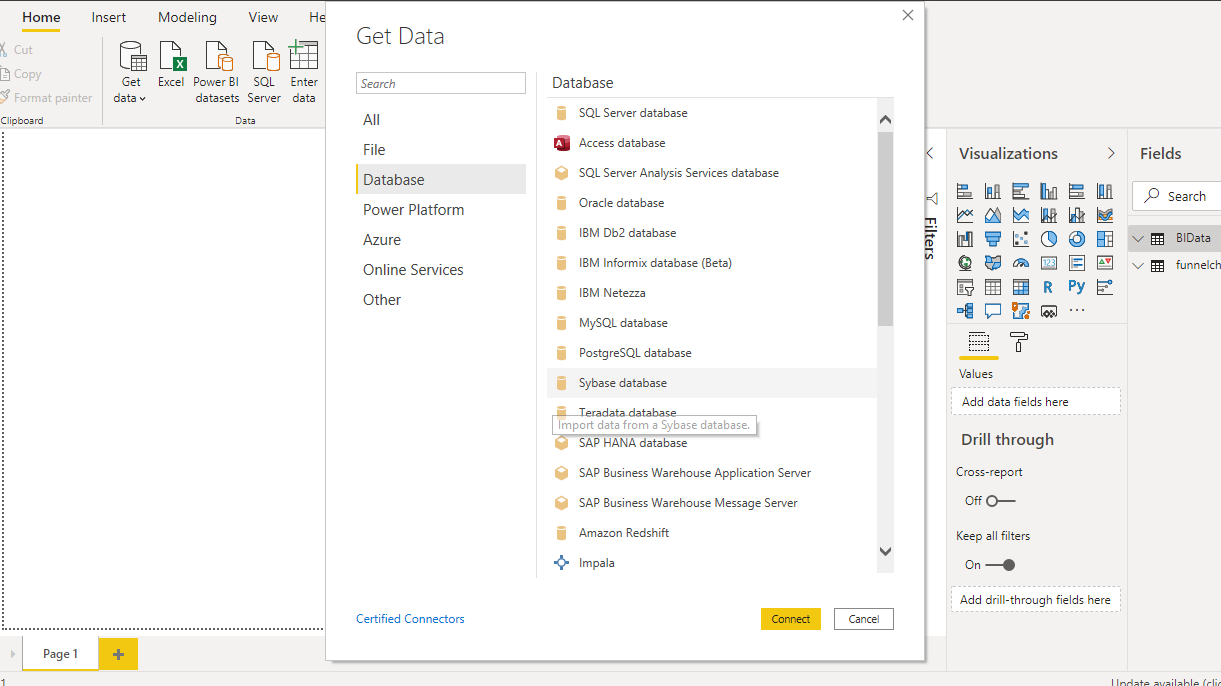
If the data you want to load is in a database, select the Database option, and then you can import data from the relevant database.
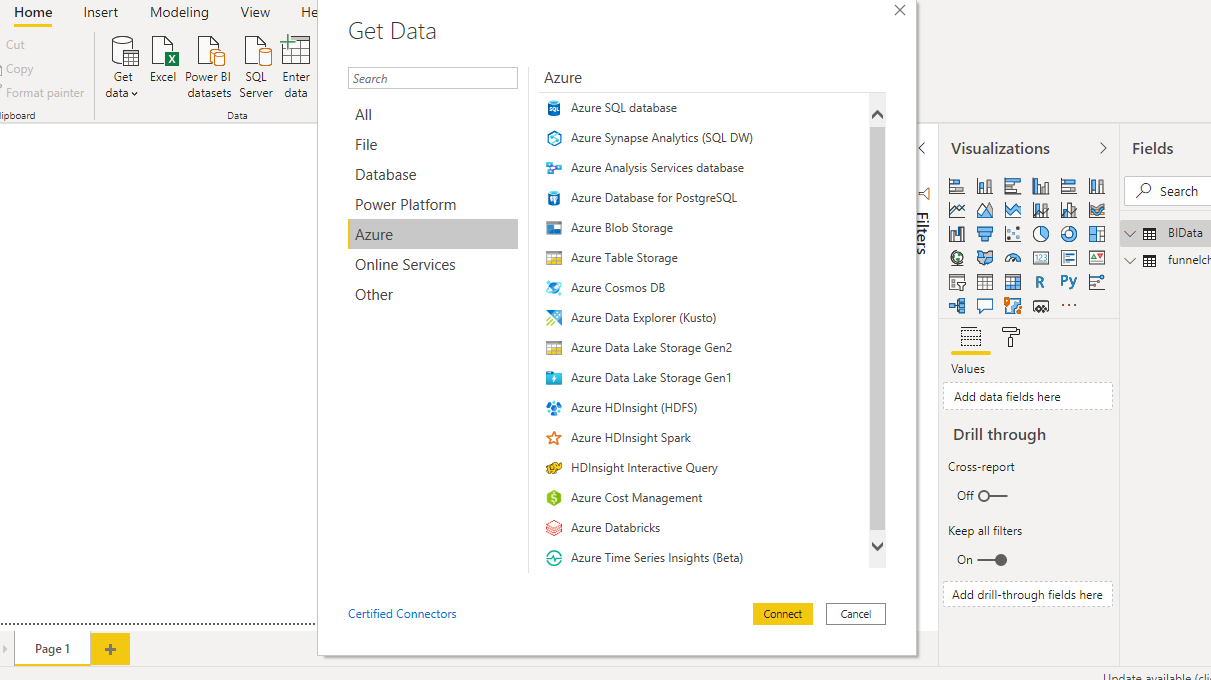
Many organizations are moving their data to cloud providers like Azure. You can click on Azure and Connect to the relevant storage path to get the required data.
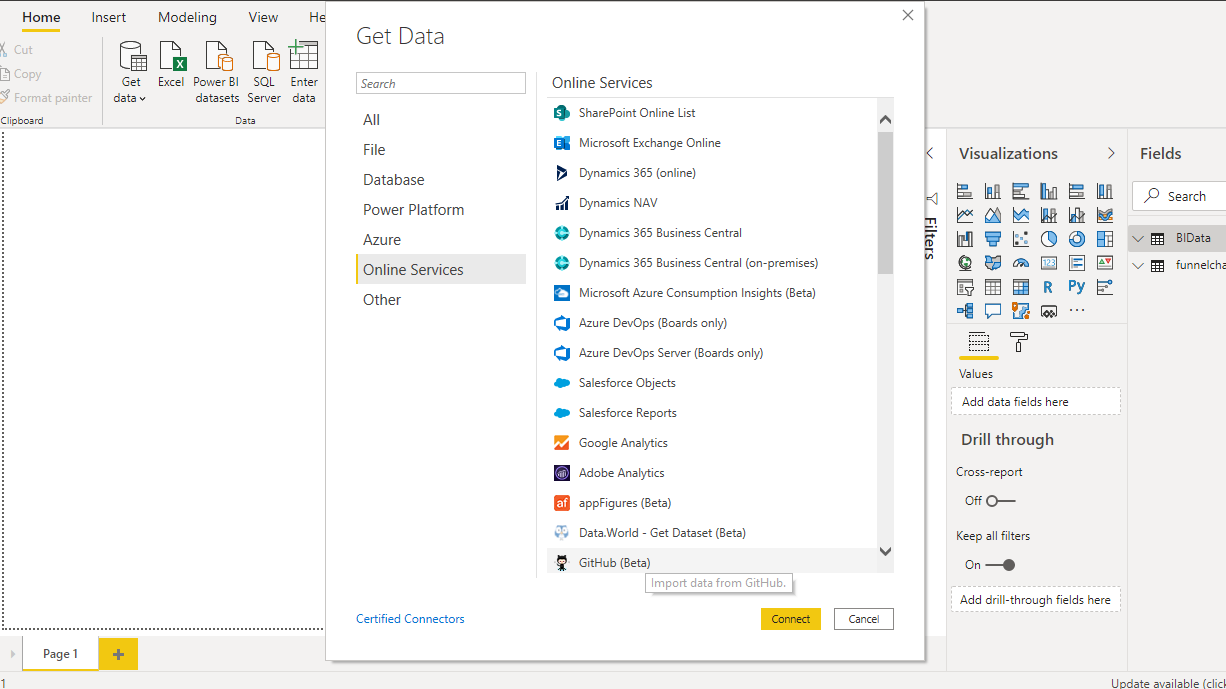
You also have a lot of other options to load data from online services. You can have a look at these options with the Online Services option.
Conclusion
Organizations are storing data in different avenues. As analytics and business intelligence professionals, you will be required to possess the skill to acquire data from different sources, and then translate it into dashboards and reports. Adding this knowledge into your tool kit will improve your business intelligence and reporting capabilities.
To learn more about building powerful visualization in Power BI desktop, please refer to the following guides:
Advance your tech skills today
Access courses on AI, cloud, data, security, and more—all led by industry experts.
