Getting Started with BigML
Import and configure datasets and build/evaluate models in BigML, which can perform data preprocessing and visualization and build machine learning models.
Oct 16, 2020 • 7 Minute Read
Introduction
BigML is a machine learning software hosted on BigML.com. You can use this platform to perform basic data preprocessing and visualization, and build machine learning models even without coding experience. Both supervised models (linear regression, logistic regression, deepnets, etc.) and unsupervised models (clusters, anomalies, associations, etc.) can be trained and tested on this platform.
For beginners, BigML provides flexibility to build models on a dataset with a maximum size of 10KB free of cost. This guide will demonstrate how to create an end-to-end project on time series data forecasting to give you a clear idea of how you can initiate your own BigML project. The major steps involved in this project are:
- Importing the time series dataset
- Data preprocessing
- Building a machine learning model
- Applying the model on the test dataset
Importing the Time Series Dataset
Export the AirPassengers dataset from R or download it from Kaggle as a CSV file. This dataset has two columns, Month and **#Passengers **. None of the features have any missing or invalid value. The data format of the Month column is YYYY-MM. Here's a sneak peek of the data:
| Month | #Passengers |
|---|---|
| 1949-01 | 112 |
| 1949-02 | 118 |
| 1949-03 | 132 |
| 1949-04 | 129 |
| 1949-05 | 121 |
To upload the dataset in your BigML dashboard, start by creating a new project and name it Time Series Forecast.
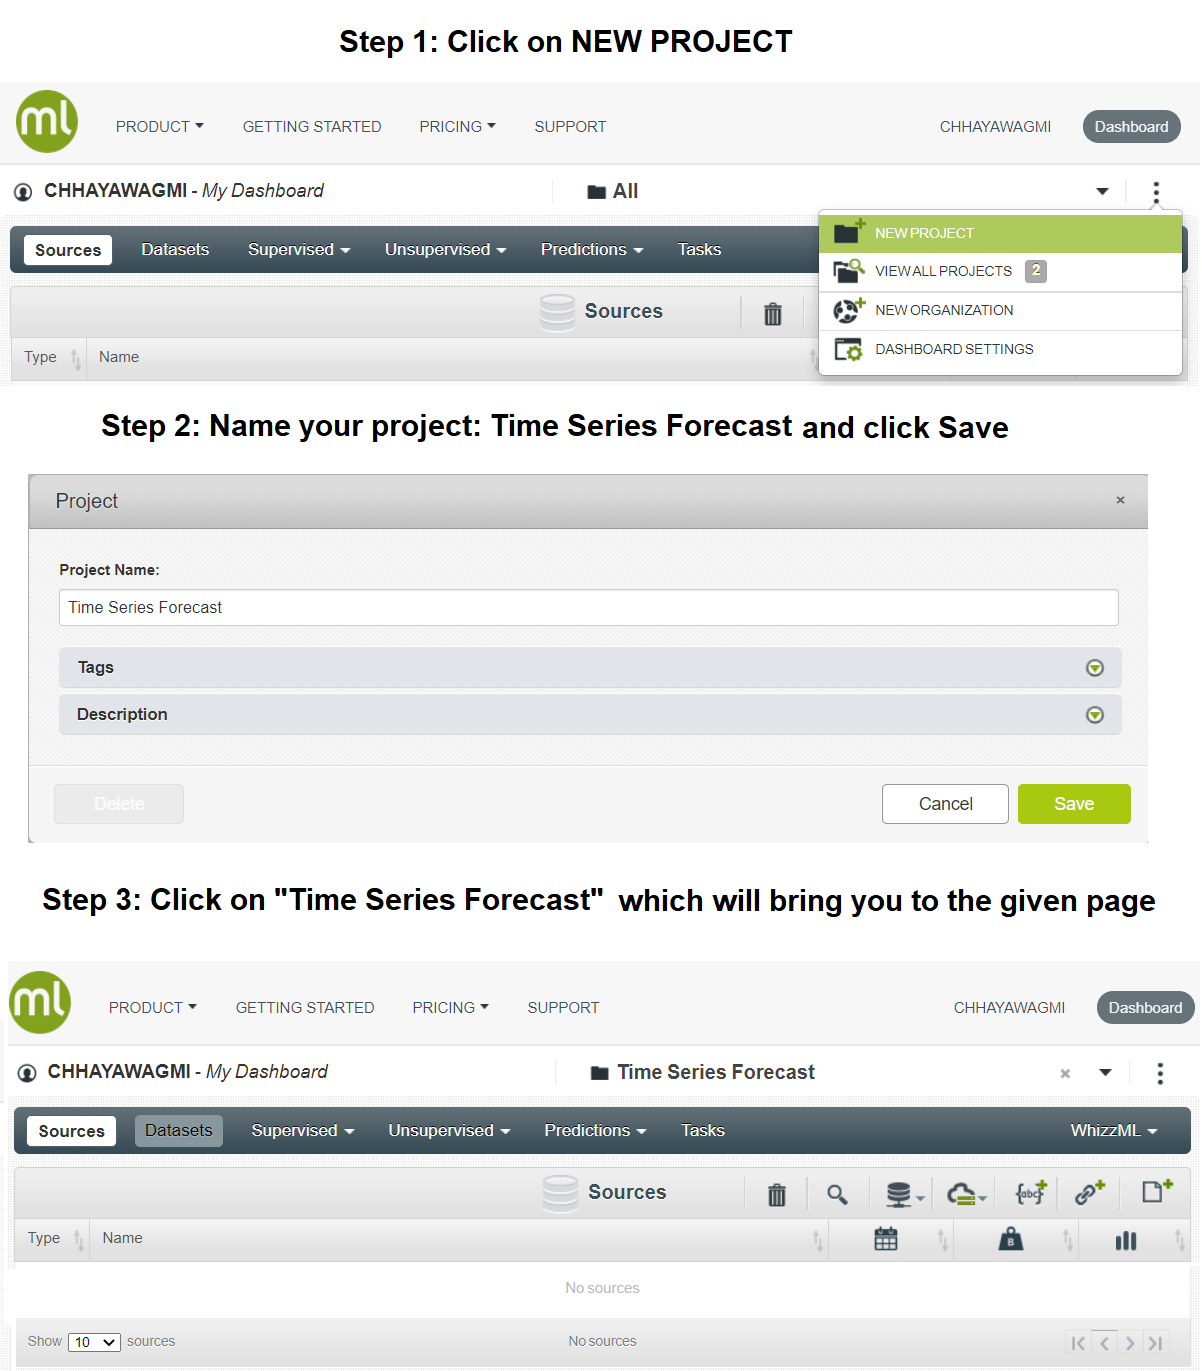
As you can observe in the above image, there are currently no available sources in your project. To bring the dataset inside Sources, click on the extreme right icon and upload the Airpassengers.csv file. This will open a green bar pop-up.
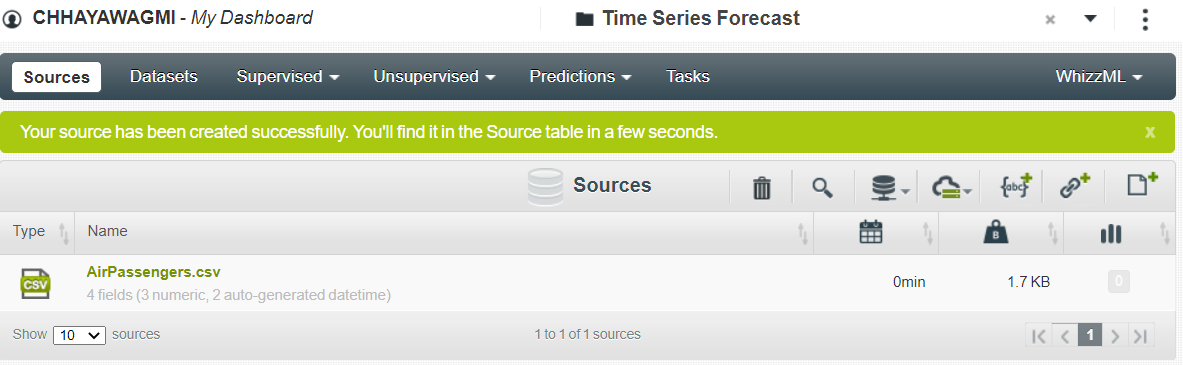
The dataset has a size of only 1.7KB and therefore you can proceed ahead for data preprocessing.
Data Preprocessing
Click on the dataset and you should see the following screen, which consists of four features:
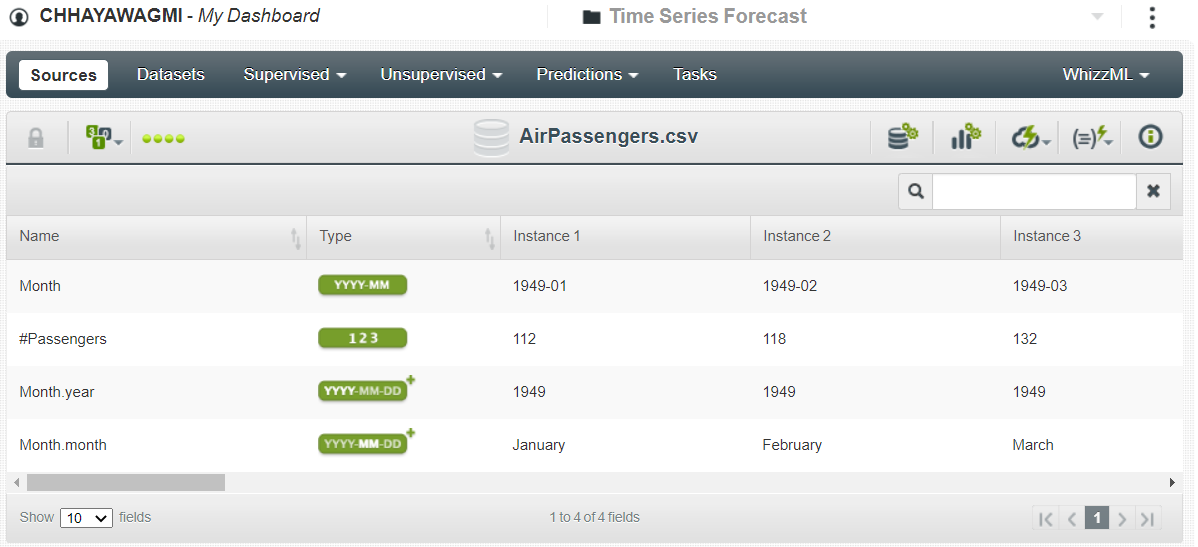
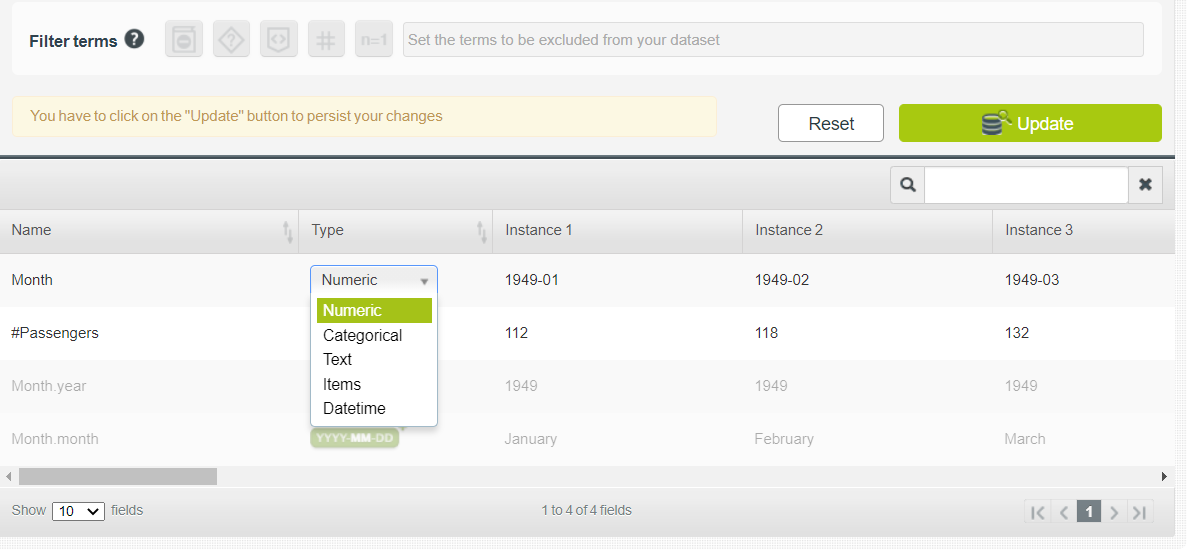
You only had two features at the start but now BigML has broken the first feature, Month, into Month.year and Month.month. To keep only the first two features, click on the Configure source button and change the data type of Month from Datetime to Numeric. Once the data type is set, click Update.
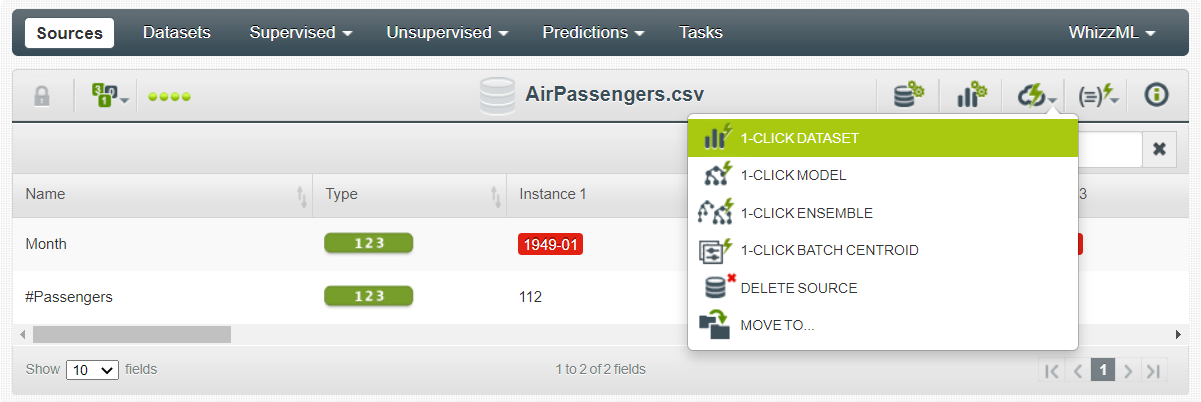
Have you noticed that you are still working in Sources? To create a dataset of the given two features, click on 1-CLICK DATASET button.
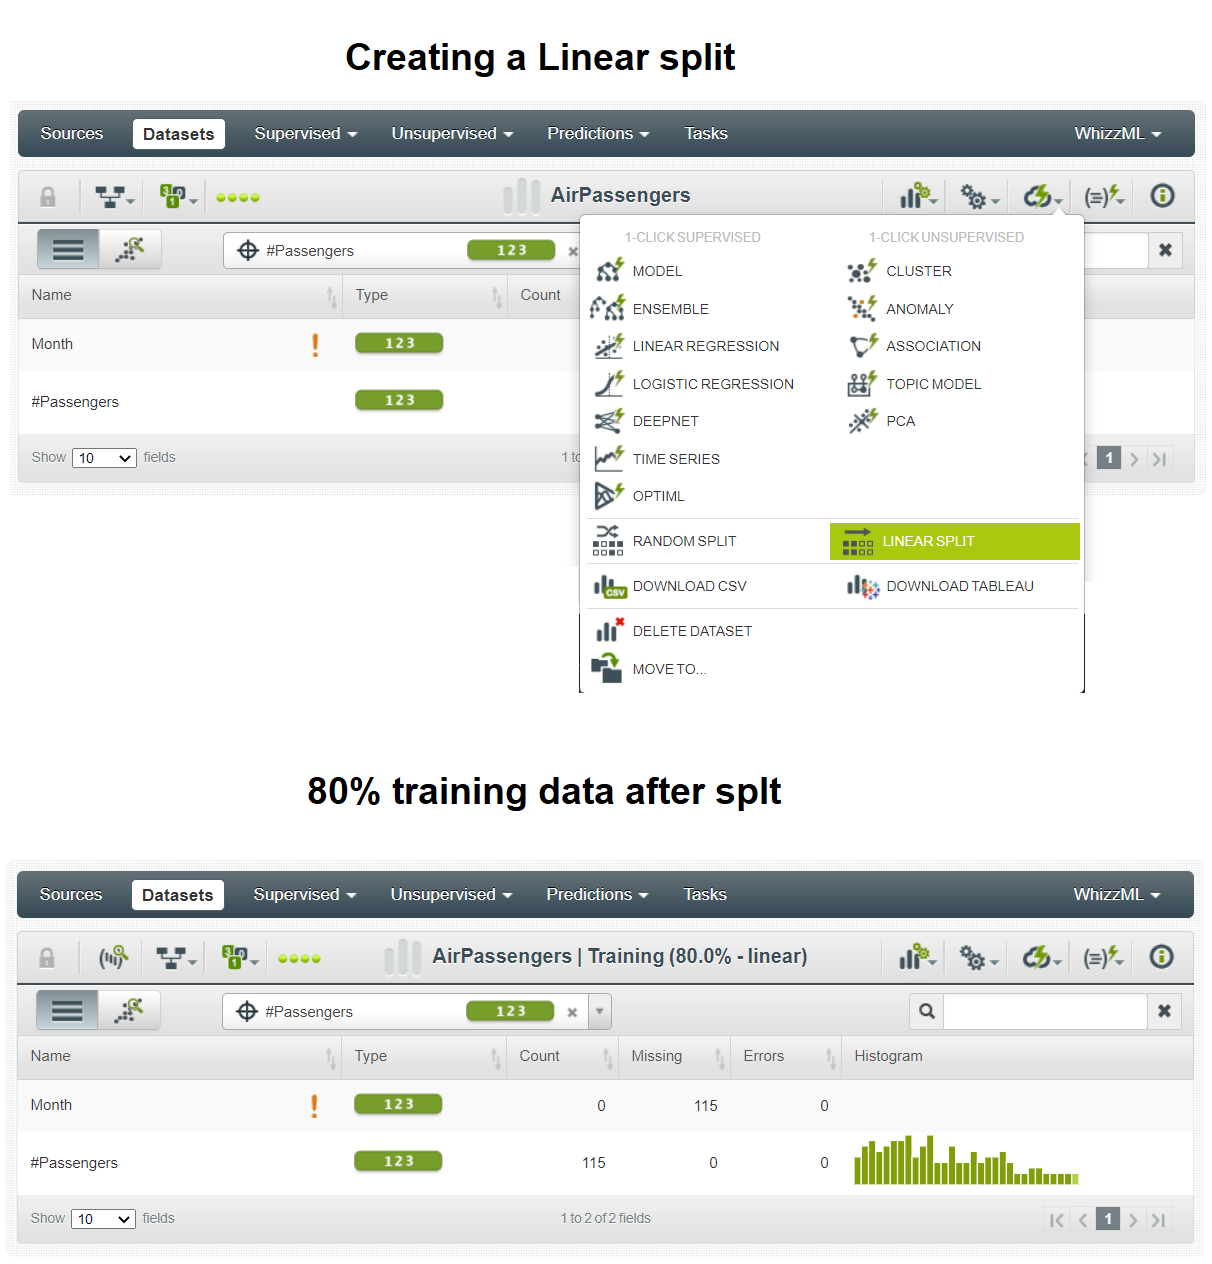
This will migrate you from Sources to Datasets tab. Next, you need to split the complete dataset into two separate datasets, one for training the model and another for testing the model. Since you are currently working on a time series dataset, you should only perform a linear split (strict no to random split). To do so, click on the LINEAR SPLIT button, which will initiate the splitting process. After the split, the training data receives 80% of the total observations (115 out of 144).
Building a Machine Learning Model
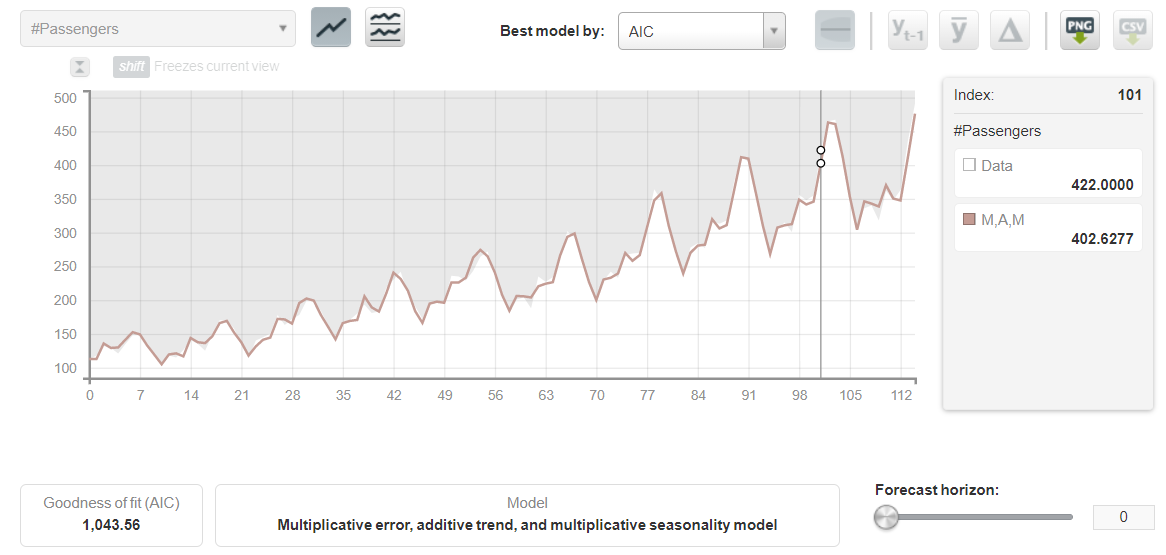
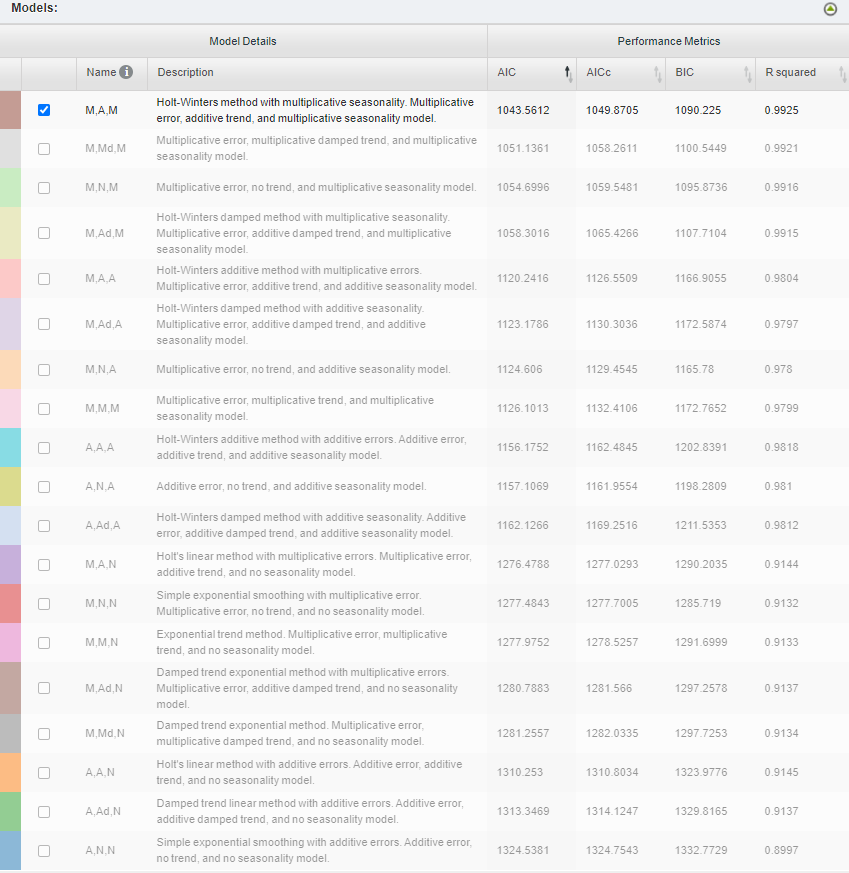
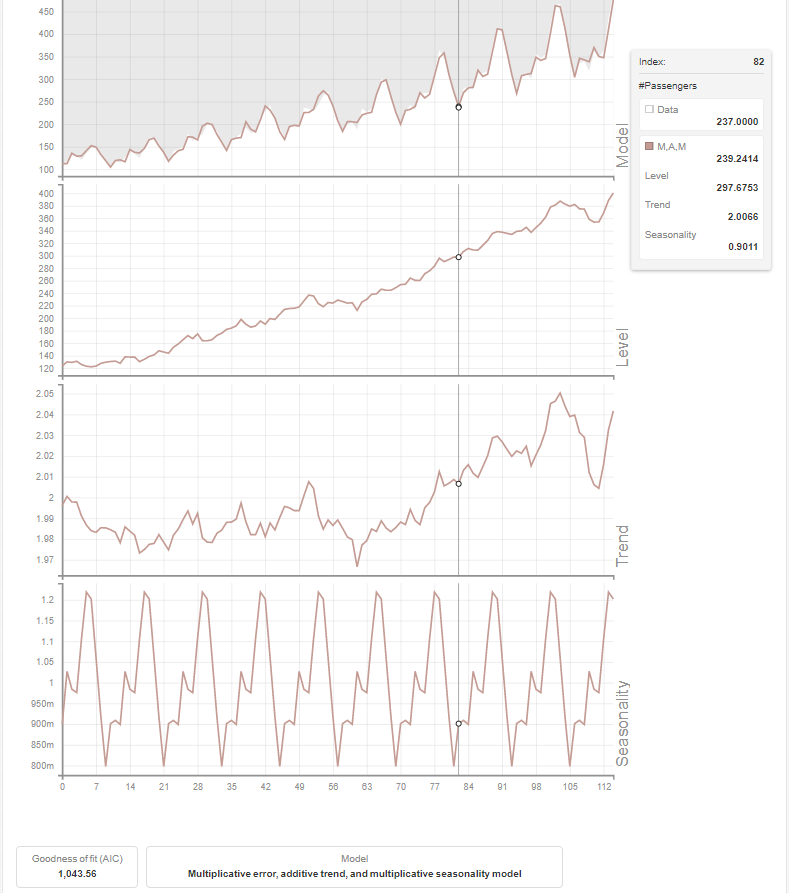
If you have ever worked on forecasting a time series data in R then you must be familiar with the auto.arima() function, which presents the best fit model out of various models. BigML also creates multiple forecasting models on a dataset and initially chooses the one that has the best metrics. You can also compare the best fit model with the rest of the models based on metrics like AIC, AICc, BIC, and R squared. Apart from presenting the best fit model, you can also visualize the decomposed model with its level, trend, and seasonality.
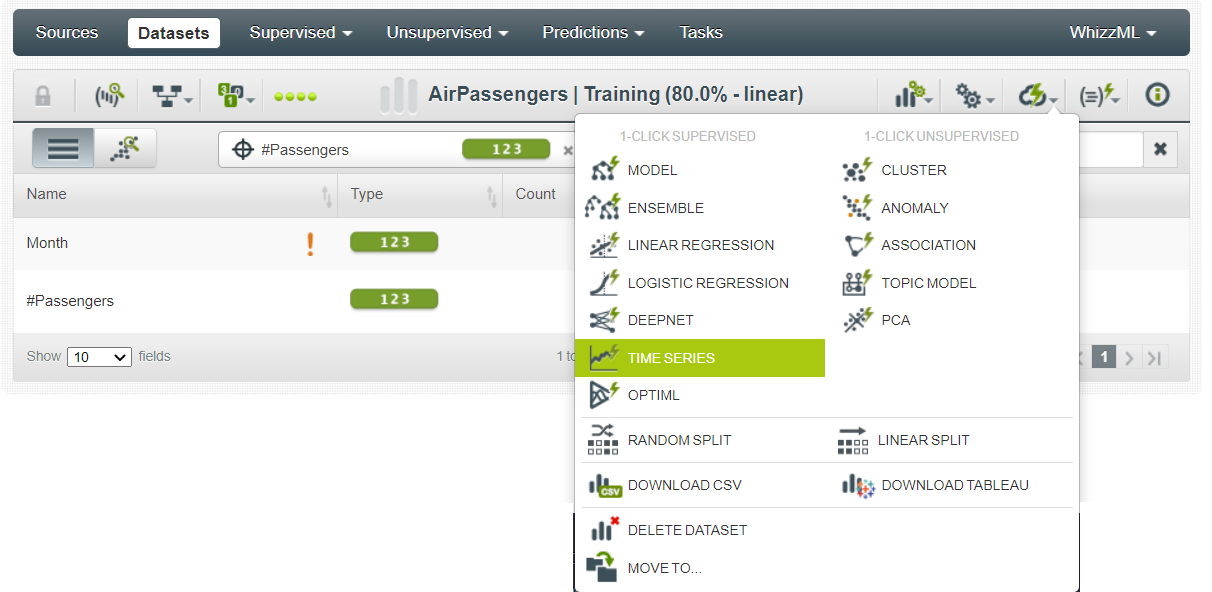
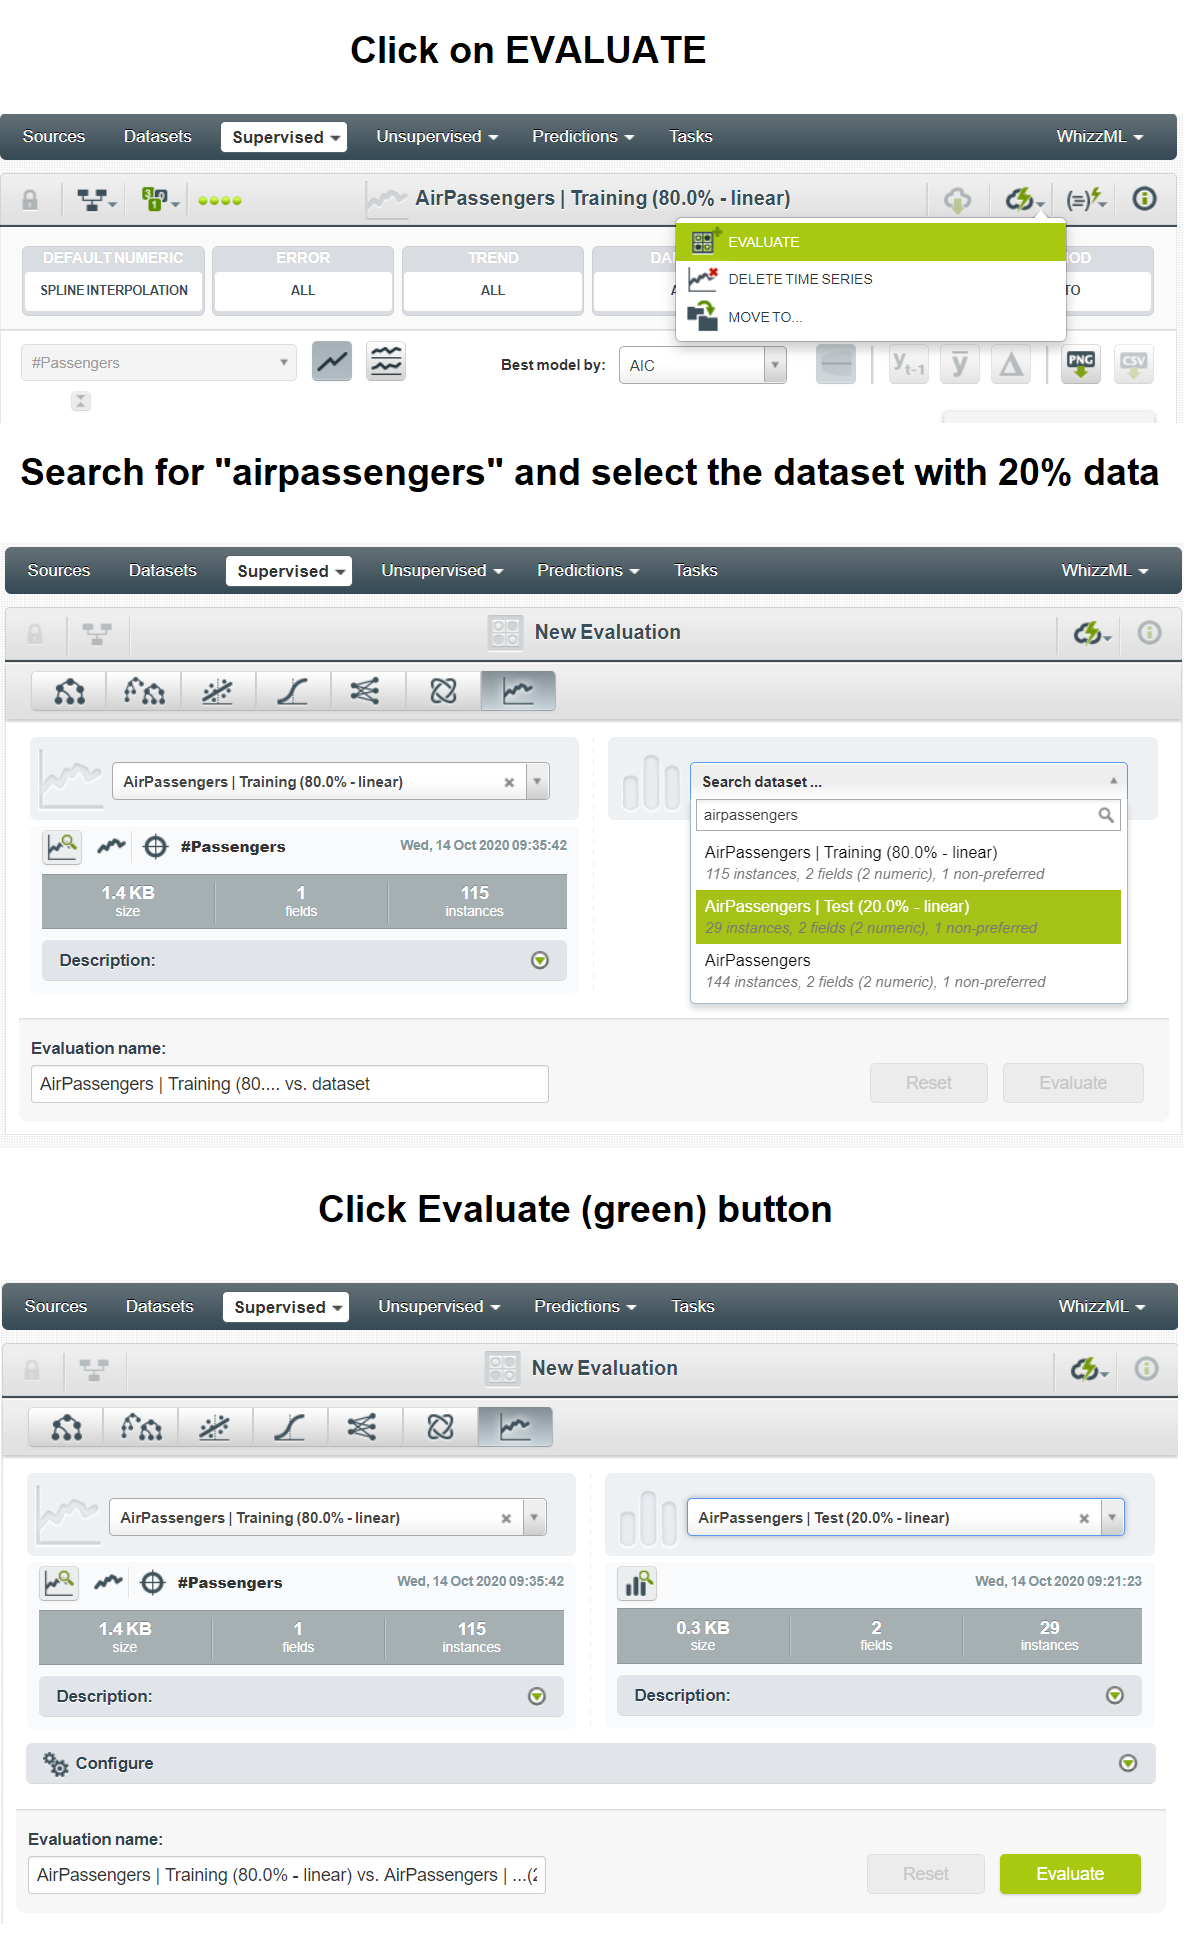
To start building the forecasting models on your dataset, click the TIME SERIES button.
This will present you with a dashboard with all the information about the best model, other models, and the decomposed model.
Applying the Model on the Test Dataset
So far you have built the model on your training dataset. Now, you need to apply this model on the remaining 20% of data that is inside the testing dataset. To do so, click on the EVALUATE button, select the testing dataset, and then click the green Evaluate button.
After the evaluation, you will receive a dashboard with the original training, testing, and forecasting data. Given below is the forecast for the first three best models. The testing data is differentiated in the highlighted area.
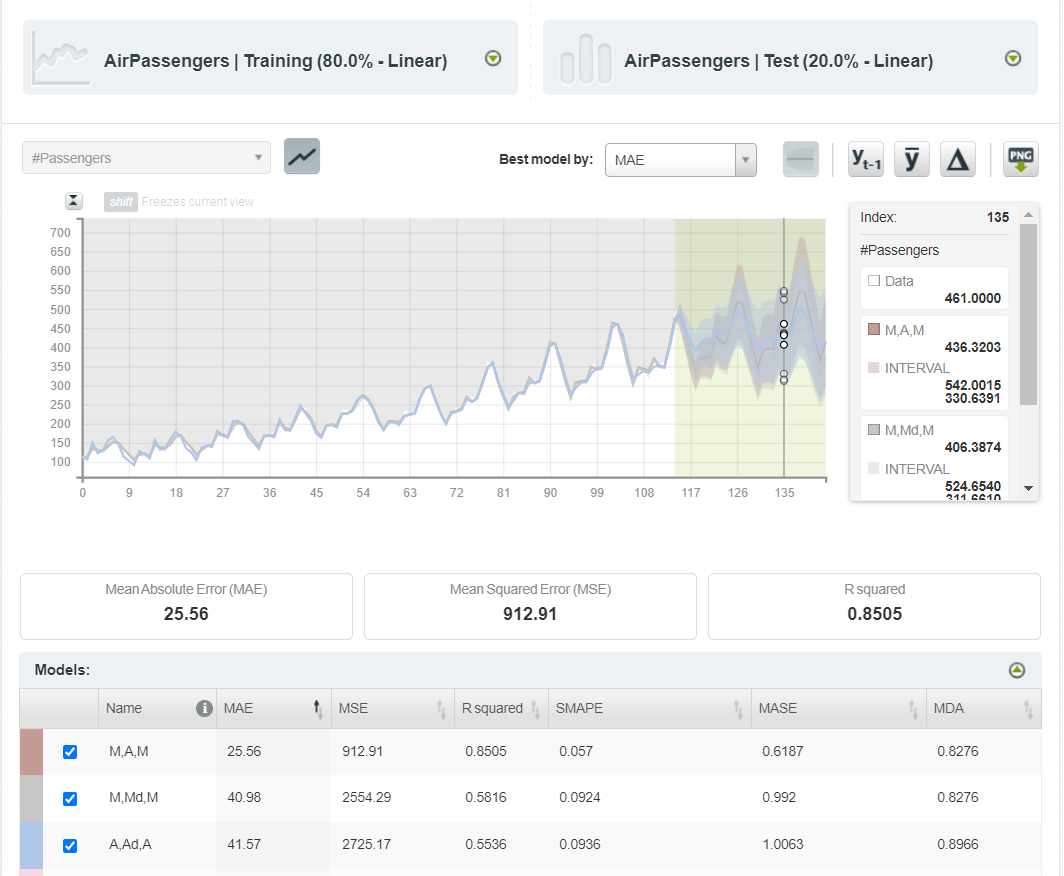
You can forecast the original data based on any of the available models and, if needed, export the chart in a PNG image with or without legends.
Conclusion
BigML has an efficient, state-of-the-art infrastructure to support data processing, visualizations, and building supervised/unsupervised machine learning models. Currently, it has nine built-in datasets and even gives you the flexibility to upload your own datasets (maximum size 10KB) for your practice, free of cost. This guide presented an end-to-end project (importing/configuring a dataset and building/evaluating models) to get you started with BigML. The Pluralsight course Leveraging Online Resources for Python Analytics also covers BigML for building and sharing analytics. For a more detailed study, you can always refer to BigML documentation.
Advance your tech skills today
Access courses on AI, cloud, data, security, and more—all led by industry experts.
