How to Install React Data Grid with NPM
Jul 30, 2020 • 6 Minute Read
Introduction
Rendering data in a grid can be a hassle, especially in frameworks such as React. To solve this problem, in this guide, we will discuss how to install and use React Data Grid, a lightweight, Excel-like grid component capable of rendering a large amount of data, and see its actual implementation in a project.
Installation
To install react-data-grid, run the following command in your project's root directory.
$ npm install --save react-data-grid
Importing React Data Grid
You can easily import the React Data Grid component using the import statement.
import ReactDataGrid from 'react-data-grid';
Using with Minimum Configuration
Here is how you can use React Data Grid with minimum configuration.
      <ReactDataGrid
  columns={columns}
  rowGetter={i => rows[i]}
  rowsCount={3} />
Props
There are many props that you can pass inside the <ReactDataGrid /> component to modify the grid, but these three are the required props that must be passed in order to render the grid.
- columns is an array of objects that represent each column in the grid.
      const columns = [
    { key: "id", name: "ID" },
    { key: "name", name: "Name" },
    { key: "amount", name: "Amount" }
  ];
-
name is the name of the column, and key acts as a unique identifier of each column.
-
rowGetter is a function that calls for each object in rows array and renders them as a row of the grid.
rowGetter={i => rows[i]}
- rowsCount is the number of rows to be rendered.
-
It should be equal to the total number of elements inside the rows array if you want to render every element as a row.
-
If less than the number of elements in rows array, then that number of elements are rendered starting from index 0 of the array.
-
If more than the elements of rows array, all the array elements are rendered.
-
You can set it to 0 if you want to render a grid without any row.
-
Complete code:
      import React from "react";
import ReactDataGrid from "react-data-grid";

export default function DataGrid() {

  const columns = [
    { key: "id", name: "ID" },
    { key: "name", name: "Name" },
    { key: "amount", name: "Amount" }
  ];

  const rows = [
    { id: 0, name: "row1", amount: 10 },
    { id: 1, name: "row2", amount: 20 },
    { id: 2, name: "row3", amount: 30 }
  ];

  return (
    <ReactDataGrid
      columns={columns}
      rowGetter={i => rows[i]}
      rowsCount={3}
    />
  );
}
.png)
Example
In actual projects, you might need to request the data to render through an API call.
This example will use Rick and Morty API, a free REST/GraphQL based API that provides information about characters, episodes, and locations of the Rick and Morty TV show.
This example will use the Episode endpoint. Here is the schema of the response from that endpoint:
| Key | Type |
|---|---|
| id | int |
| name | string |
| air_date | string |
| episode | string |
| characters | array (urls) |
| url | string (url) |
| created | string |
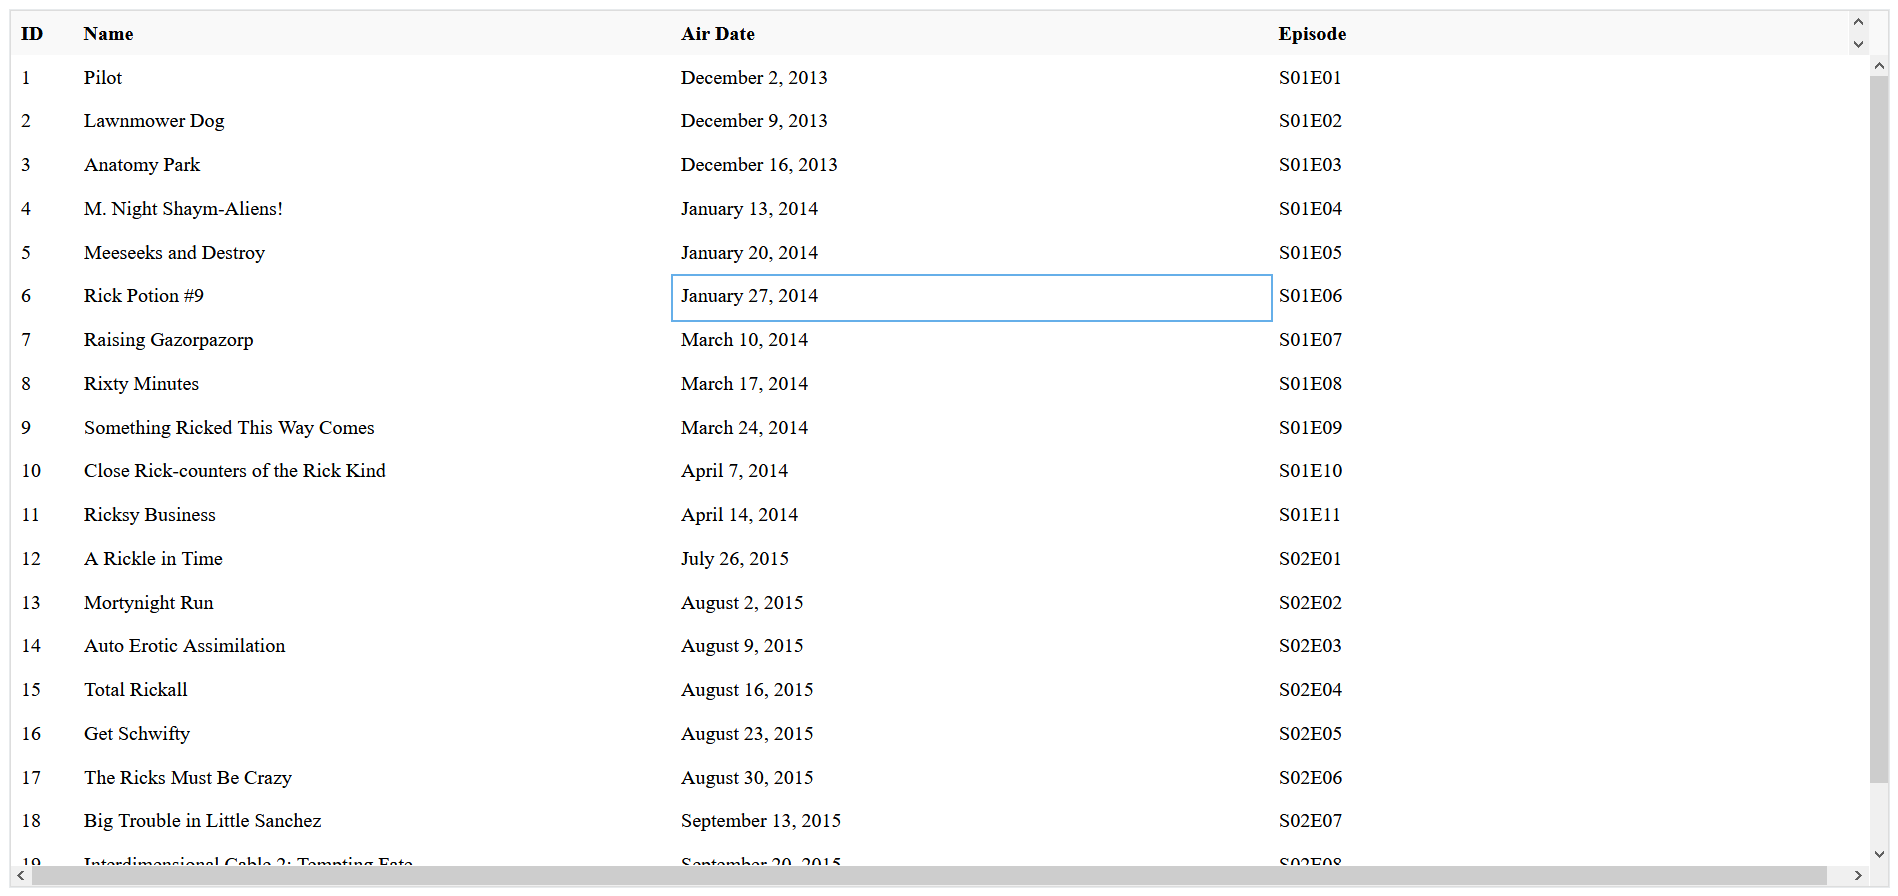
Here is how you can make a grid of the endpoint response:
- First, you need to request data from /episode endpoint; one way would be using fetch() inside useEffect() hook and storing the data in the state variable. Providing an empty array as a second argument to useEffect() ensures that the request is made only after the initial render.
      const [data, setData ] = useState([]);

useEffect(() => {
    fetch("https://rickandmortyapi.com/api/episode/")
      .then(res => res.json())
      .then(data => setData(data.results));
  }, []);
- Now, you need to define the columns of the grid. Based on the schema of the response, you can choose what fields to render.
      const columns = [
    { key: "id", name: "ID" },
    { key: "name", name: "Name"},
    { key: "air_date", name: "Air Date"},
    { key: "episode", name: "Episode" },
  ];
- As the last step, you need to provide the data from the endpoint in rowGetter, which is stored inside the state variable.
      <ReactDataGrid
      columns={columns}
      rowGetter={i => data[i]}
      rowsCount={data.length}
      minHeight={800}
    />
minHeight is another prop that you can use to set the height of the grid.
With this, you have successfully created a grid consisting of the information that you received from the API endpoint.
Conclusion
This guide was an introduction to the awesome React Data Grid library. There are many features like Cell Formatting, Filtering, Sorting, Grouping, etc. that you can use and customize the grid. And since this is an open source project, you can even create custom features and get them merged in the official library.
React Data Grid is perfect for displaying extensive data in tabular format. You can even use it in your side projects like an E-commerce platform where inventory, customer information, etc. can be rendered using React Data Grid.
You can read more about this in the official docs.
Advance your tech skills today
Access courses on AI, cloud, data, security, and more—all led by industry experts.
