
- Course
Applying the Mathematical MASS Model with R
This course focuses on capabilities, models, and datasets available within the MASS package in R. Along the way, you will gain knowledge of estimating survival probabilities and working with hazard rates in multi-state model.
Beginner
- Course
Applying the Mathematical MASS Model with R
This course focuses on capabilities, models, and datasets available within the MASS package in R. Along the way, you will gain knowledge of estimating survival probabilities and working with hazard rates in multi-state model.
Beginner
Get started today
Access this course and other top-rated tech content with one of our business plans.
Try this course for free
Access this course and other top-rated tech content with one of our individual plans.
This course is included in the libraries shown below:
- Data
What you'll learn
Before machine learning and Python made statistics a subject of MASS popular appeal, an entire generation of applied statisticians learned their craft from the famous textbook named “Modern Applied Statistics with S” by Venables and Ripley. The “S” referred to in the book’s title is the precursor of the R statistical software, which is so popular and effective for statistical analysis. The influence of this seminal work is so strong, that R actually contains a package named MASS, an acronym for the book’s title.
In this course, Applying the Mathematical MASS Model with R, you will gain the ability to use the datasets, predictive models, and specialized functions available in the MASS package in R.
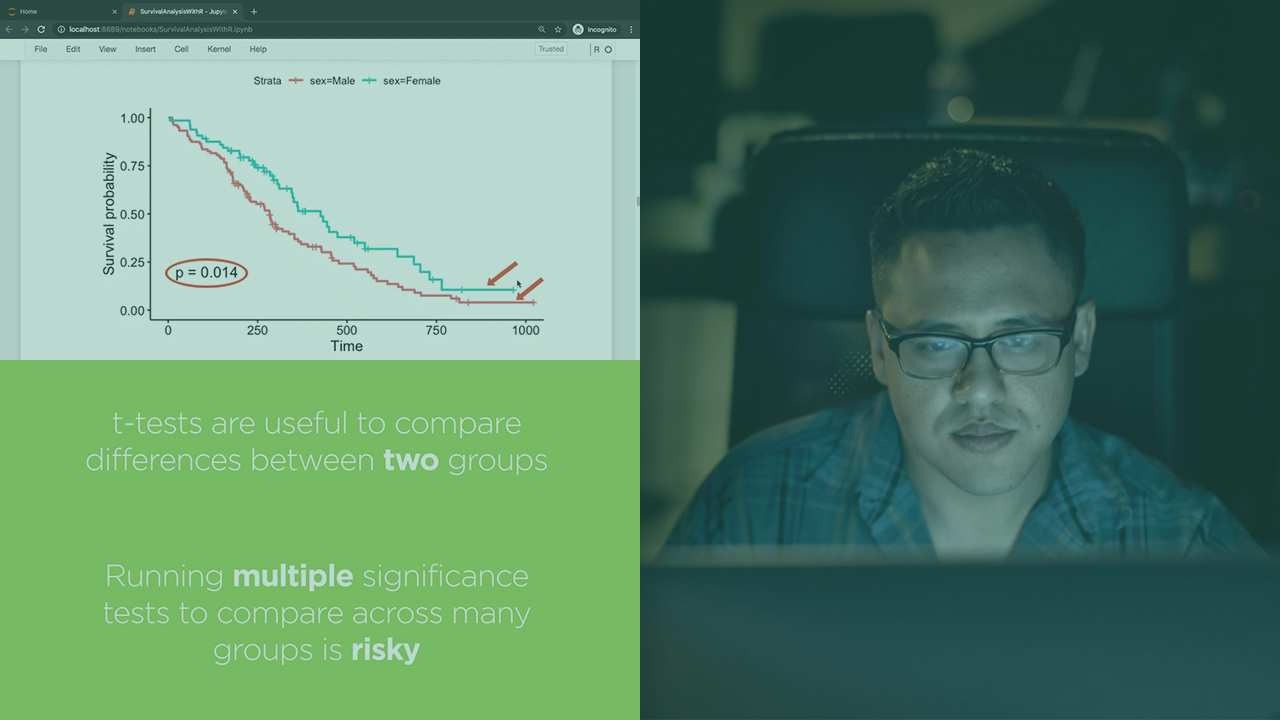
First, you will learn how the classic t-test can be used in a variety of common scenarios around estimating means and also learn about using ANOVA, a powerful statistical technique used to measure statistical properties across different categories of data. This exploration will involve variants of the t-test such as one-sample and two-sample t-tests, as well as one-way ANOVA, which is used to compare means of a target variable across different groups, based on the value of a single categorical variable.
Next, you will discover about three powerful techniques in data analysis, namely linear discriminant analysis (LDA), quadratic discriminant analysis (QDA), and robust regression. LDA and QDA are classification techniques that both seek to re-orient the original data using new, optimized axes such that points belonging to different classes lie as far apart as possible. QDA is preferable to LDA when the x-variables that correspond to different y-variable values have differing covariances. MASS includes support for three powerful robust regression techniques, Huber, Bisquare, and Hampel; each of these is a useful way to fit a regression model even when data is heavily contaminated by outliers.
Finally, you will explore how to model complex systems using multi-state models, which represent the result of a stochastic process as a succession of states. You will understand the differences - and similarities - between transition probabilities and transition intensities, and then apply all of that knowledge to a special class of multi-state models: survival models. Such models find wide applications in medical domains such as modeling outcomes of different treatment regimens, and you will learn how to do so, and also how to model hazard rates and survival probabilities. When you’re finished with this course, you will have the skills and knowledge of several specialized statistical techniques that are featured in the MASS library in R.
Applying the Mathematical MASS Model with R
Beginner
Table of contents
-
Version Check | 15s
-
Prerequisites and Course Outline | 2m 19s
-
Introducing the MASS Package | 1m 41s
-
Qualitative and Quantitative Data | 2m 37s
-
Hypothesis Testing Using t-tests | 6m 11s
-
Hypothesis Testing Using ANOVA | 2m 41s
-
Demo: Integrating with the MASS Package | 3m 50s
-
Demo: Quantitative and Qualitative Analysis of Birthweight Data | 7m 47s
-
Demo: Running t-tests on Birthweight Data | 4m 4s
-
Demo: Quantitative and Qualitative Analysis of Cars Data | 3m 28s
-
Demo: Executing ANOVA Analysis on Cars Data | 3m 58s
-
Demo: Paired Sample t-test on Anorexia Data | 3m 38s
A problem solver at heart, Janani has a Masters degree from Stanford and worked for 7+ years at Google. She was one of the original engineers on Google Docs and holds 4 patents for its real-time collaborative editing framework.
