
- Course
Build Your First Data Visualization with Chart.js 2
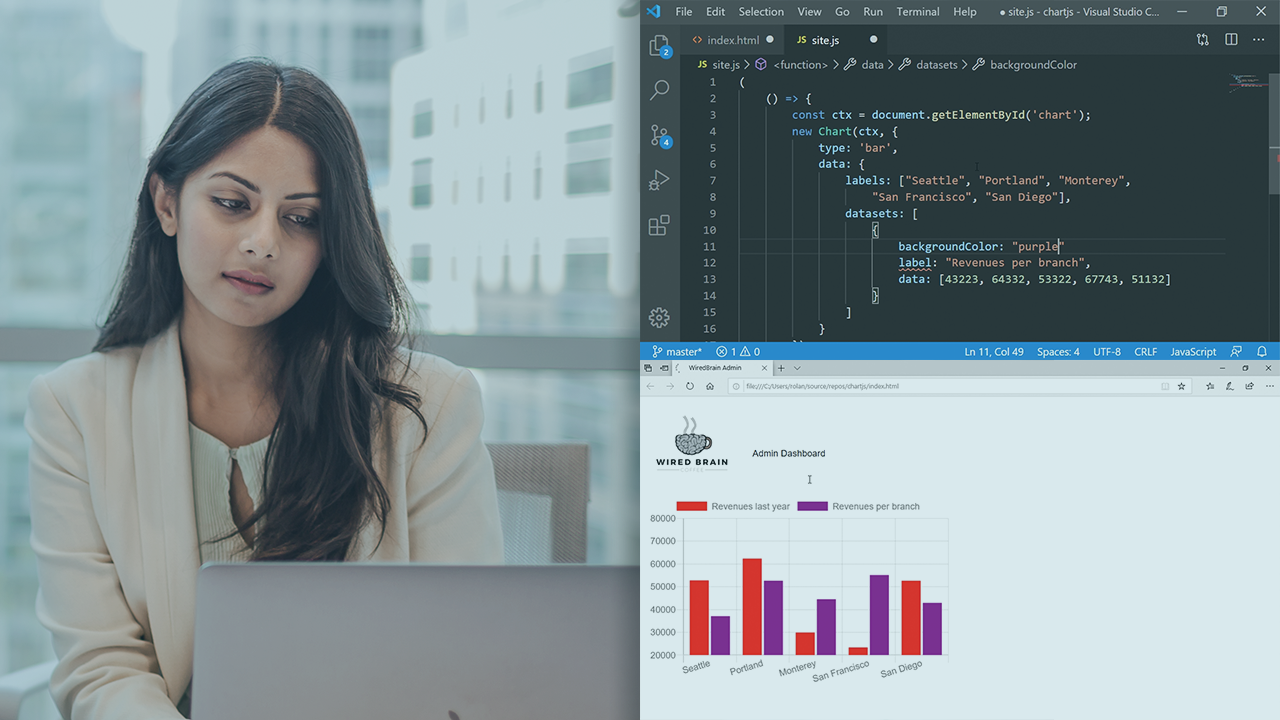
A picture is worth a thousand words. This course will teach you chart.js, a JavaScript library to create data visualizations in a straightforward manner.
Beginner
- Course
Build Your First Data Visualization with Chart.js 2
A picture is worth a thousand words. This course will teach you chart.js, a JavaScript library to create data visualizations in a straightforward manner.
Beginner
Get started today
Access this course and other top-rated tech content with one of our business plans.
Try this course for free
Access this course and other top-rated tech content with one of our individual plans.
This course is included in the libraries shown below:
- Data
What you'll learn
Drawing charts by hand in JavaScript is error prone and tedious, there’s a great library for that called chart.js. In this course, Build Your First Data Visualization with Chart.js, you’ll learn to create a multitude of chart types with minimal effort. First, you’ll explore how to create a simple chart. Next, you’ll discover the different types of charts chart.js offers. Finally, you’ll learn how to customize the visualizations. When you’re finished with this course, you’ll have the skills and knowledge of creating good looking data visualizations needed to entice your users.
Build Your First Data Visualization with Chart.js 2
Beginner
Table of contents
Roland is a Microsoft MVP enjoying a constant curiosity around new techniques in software development. His focus is on all things .Net and browser technologies.
