- Course
Build Your First Dashboard with Geckoboard
This course will teach you how to create a simple dashboard using Geckoboard.

- Course
Build Your First Dashboard with Geckoboard
This course will teach you how to create a simple dashboard using Geckoboard.
Get started today
Access this course and other top-rated tech content with one of our business plans.
Try this course for free
Access this course and other top-rated tech content with one of our individual plans.
This course is included in the libraries shown below:
- Data
What you'll learn
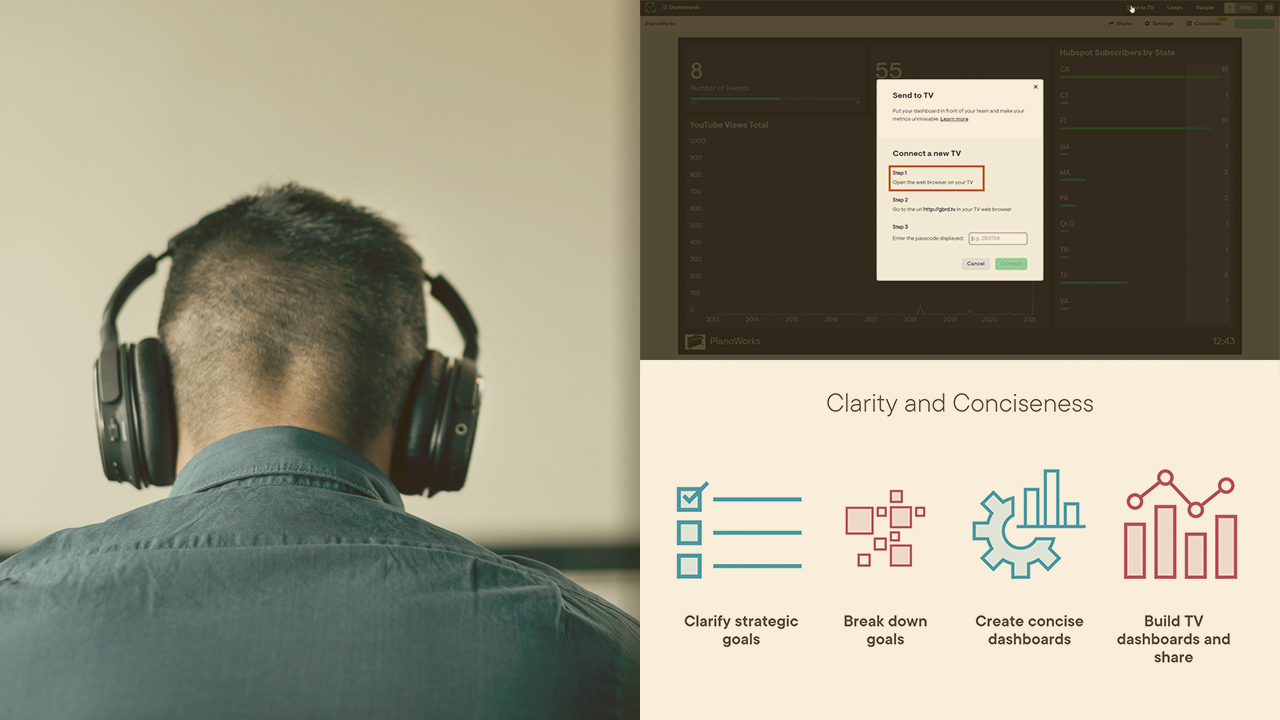
Want to build visualizations with Geckoboard? In this course, Build Your First Dashboard with Geckoboar, you’ll learn to create a simple visualization using Geckoboard. First, you’ll explore the basic requirements, dependencies and context to build the visualization. Next, you’ll discover how to load a simple data source. Finally, you’ll learn how to add a data series to the visualization. When you’re finished with this course, you’ll have the skills and knowledge of building and formatting visualizations needed to create a simple dashboard and visualization using Geckoboard.

