
- Course
Build Your First Data Visualization with ggplot2
Explore the power of ggplot2 and how it makes R a great choice for data visualization.
Beginner
- Course
Build Your First Data Visualization with ggplot2
Explore the power of ggplot2 and how it makes R a great choice for data visualization.
Beginner
Get started today
Access this course and other top-rated tech content with one of our business plans.
Try this course for free
Access this course and other top-rated tech content with one of our individual plans.
This course is included in the libraries shown below:
- Data
What you'll learn
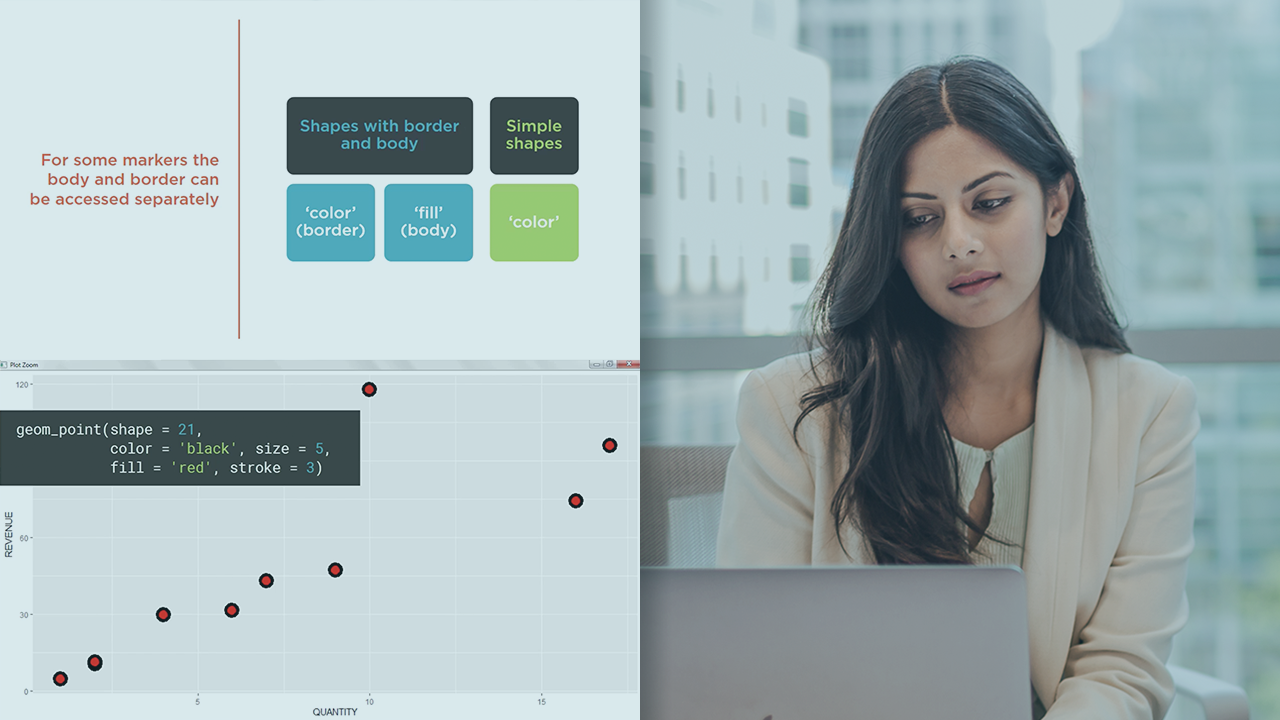
Do you want to explore the famous ggplot2 package? Each year more and more data scientists are using ggplots in their daily work. This is a great choice since ggplots are extremely flexible yet consistent in the code structure. Pretty much any common chart type can be created in ggplot2. In this course, Build Your First Data Visualization with ggplot2, you’ll learn foundational knowledge of the ggplot2 charting tool of R. First, you'll be shown how ggplot code is structured. Then, you'll understand how different chart types can be created and modified. Finally, you'll learn how to work on chart titles, legends, axes, and layouts. When you’re finished with this course, you’ll have the skills to create and modify a standard ggplot.
Build Your First Data Visualization with ggplot2
Beginner
Table of contents
Martin is a trained biostatistician, programmer, consultant and data science enthusiast. His main objective: Explaining data science in a straightforward way. You can find his latest work over at: r-tutorials.com
