
- Course
Build Your First Data Visualization with ng2-charts 2
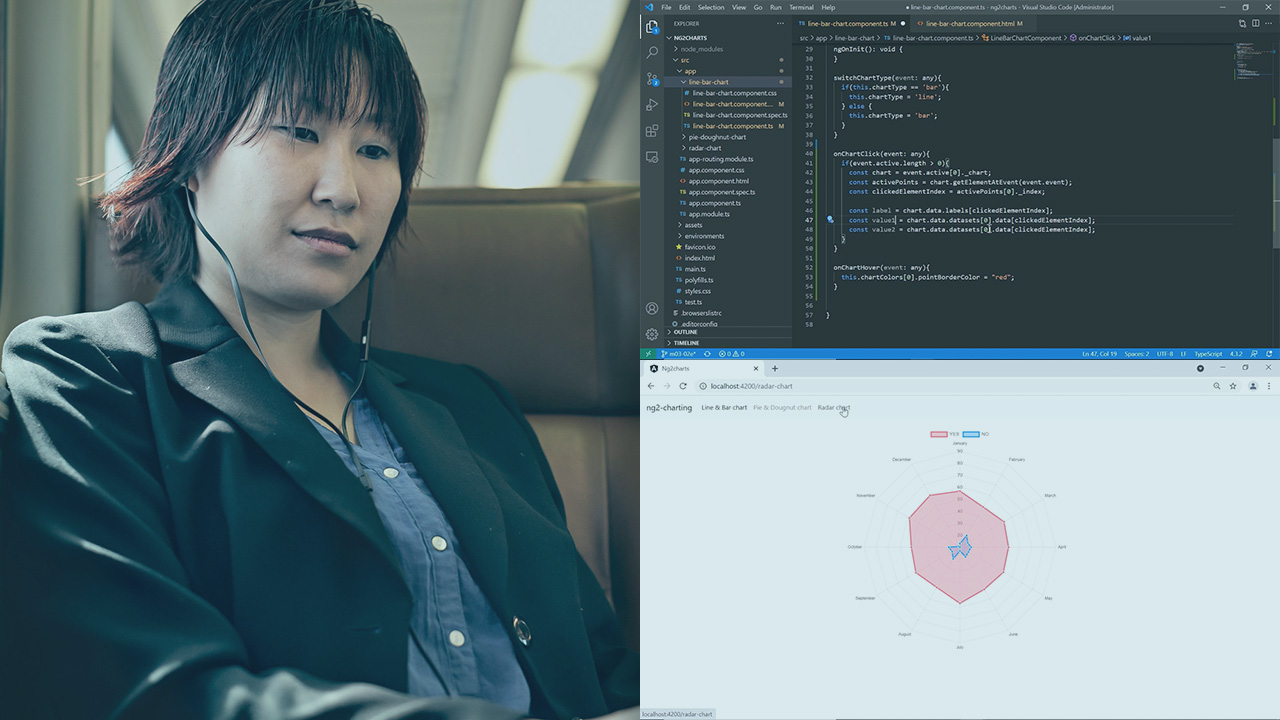
Understanding your data is key to building a successful business. This course will teach you how to effectively visualize your data using ng2-charts by integrating Line, Bar, Pie, and Radar charts in your Angular Web Applications
Beginner
- Course
Build Your First Data Visualization with ng2-charts 2
Understanding your data is key to building a successful business. This course will teach you how to effectively visualize your data using ng2-charts by integrating Line, Bar, Pie, and Radar charts in your Angular Web Applications
Beginner
Get started today
Access this course and other top-rated tech content with one of our business plans.
Try this course for free
Access this course and other top-rated tech content with one of our individual plans.
This course is included in the libraries shown below:
- Data
What you'll learn
Having a lot of data, but not being able to read/understand it is no different than having no data at all. In this course, Build your First Data Visualization with ng2-charts, you’ll learn to better understand your data by integrating charts into your Angular web applications. First, you’ll explore what ng2-charts are and how to set them up in an Angular 2+ web application. Next, you’ll discover how to use ng2-charts to generate a Line, Bar, Pie, and Radar chart to work with data. Finally, you’ll learn how to customize your charts. When you’re finished with this course, you’ll have the skills and knowledge of the ng2-charts library needed to build a highly efficient and interactive chart to get a better insight into your data.
Build Your First Data Visualization with ng2-charts 2
Beginner
Table of contents
Ervis is a professional web developer with a strong focus on simplicity. He has a strong hunger for knowledge and a passion for teaching others.
