
- Course
Build Your First Data Visualization with NVD3
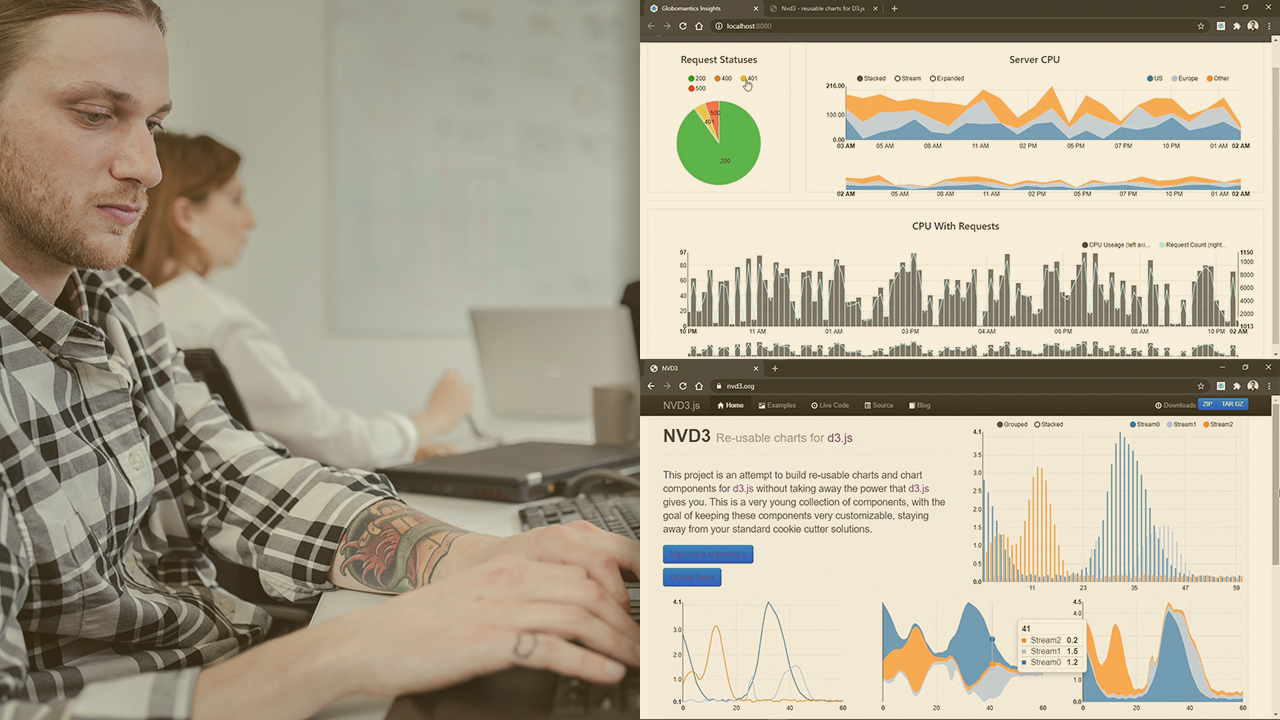
This course will teach you how to use NVD3 to build reusable charts and chart components for d3.js without taking away the power that d3.js gives you as well as visualize different datasets on your web applications.
Beginner
- Course
Build Your First Data Visualization with NVD3
This course will teach you how to use NVD3 to build reusable charts and chart components for d3.js without taking away the power that d3.js gives you as well as visualize different datasets on your web applications.
Beginner
Get started today
Access this course and other top-rated tech content with one of our business plans.
Try this course for free
Access this course and other top-rated tech content with one of our individual plans.
This course is included in the libraries shown below:
- Data
What you'll learn
Almost any application needs to visualize some data. When it comes to data visualization, you need to use a third party library since building data visualization components from scratch is time-consuming and unnecessary. In this course, Build Your First Data Visualization with NVD3, you’ll learn how to leverage the power of d3.js charts through the NVD3 library. First, you'll explore how to build reusable charts and chart components for your application. Next, you'll learn how to install and configure the NVD3 library, then display time series data retrieved from API into charts so that your users can understand how the application is performing. Next, you'll learn how to customize your data, NVD3 charts, and HTML content, and make them interactive. Finally, you’ll learn how to update graph data and customize data update settings for your charts to handle data that changes quickly. By the end of this course, you'll have the knowledge about NVD3 data visualization to design and customize your own NVD3 data charts.
Build Your First Data Visualization with NVD3
Beginner
Table of contents
Nertil is a independent software consultant working with different teams around the world to bring products to market. He is focused on using the right tools for the job.
