
- Course
Build Your First Data Visualization with Seaborn
This course aims to build and solidify your understanding of what data visualization is, why it is important and eventually, how to build visualizations from your own datasets using Seaborn.
Beginner
- Course
Build Your First Data Visualization with Seaborn
This course aims to build and solidify your understanding of what data visualization is, why it is important and eventually, how to build visualizations from your own datasets using Seaborn.
Beginner
Get started today
Access this course and other top-rated tech content with one of our business plans.
Try this course for free
Access this course and other top-rated tech content with one of our individual plans.
This course is included in the libraries shown below:
- Data
What you'll learn
If you’re a data analyst or are involved in data-driven decision making for your organization, understanding data becomes crucial.
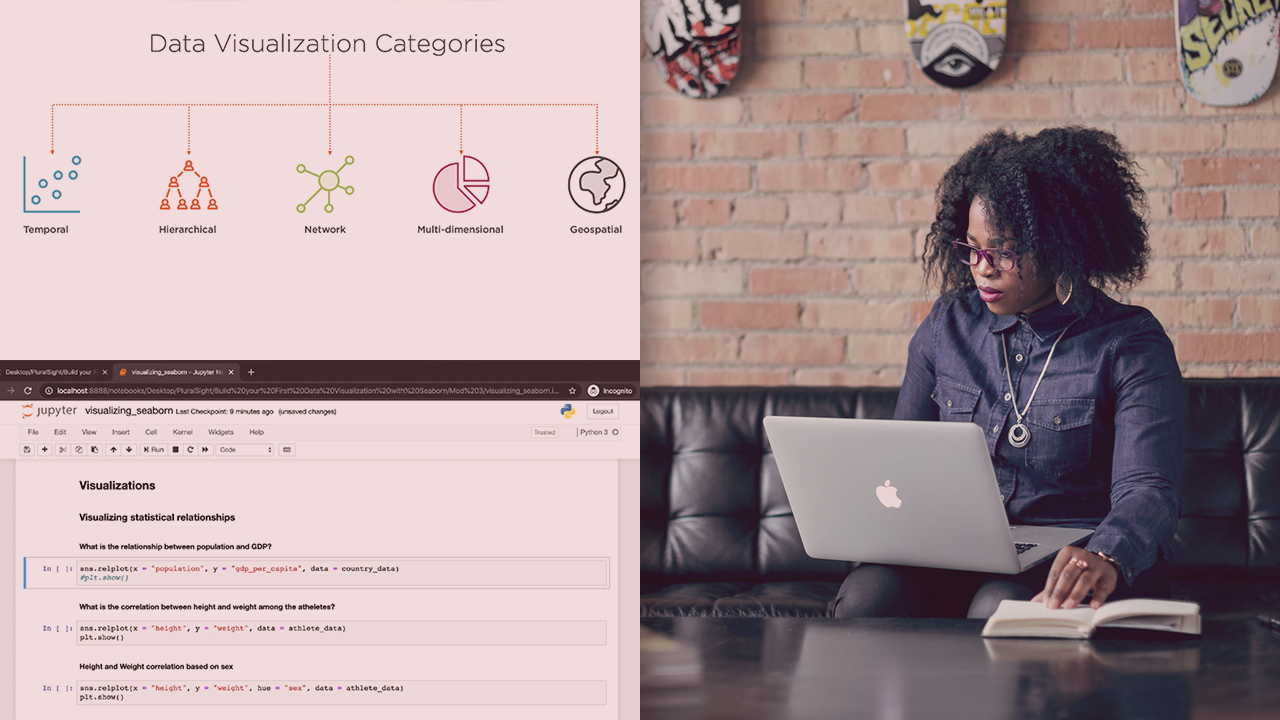
A key component in understanding your data is data visualization. You can find a plethora of tools to do this, and Python’s Seaborn library is one of the big ones.
In this course, Build Your First Data Visualization with Seaborn, you'll gain an introductory understanding of Seaborn.
First, you’ll deal with the what’s and the why’s of seaborn. You’ll hear about what it is, why it is needed and the things you can do with it.
Then, you will focus on creating actual visualizations using Seaborn and learn how to load a dataset, in addition to creating and customizing visualizations.
Finally, when you're finished with this course, you'll have the knowledge and skills to build visualizations from your own datasets with Seaborn.
Build Your First Data Visualization with Seaborn
Beginner
Table of contents
Pratheerth is a freelance Data Scientist who has entered the field after an eclectic mix of educational and work experiences.
