
- Course
Build Your First Data Visualization with vis.js
Graphical charts are one of the most effective ways to gain insight into large datasets. This course will teach you how to use vis.js to create effective charts and add them to your web applications.
Beginner
- Course
Build Your First Data Visualization with vis.js
Graphical charts are one of the most effective ways to gain insight into large datasets. This course will teach you how to use vis.js to create effective charts and add them to your web applications.
Beginner
Get started today
Access this course and other top-rated tech content with one of our business plans.
Try this course for free
Access this course and other top-rated tech content with one of our individual plans.
This course is included in the libraries shown below:
- Data
What you'll learn
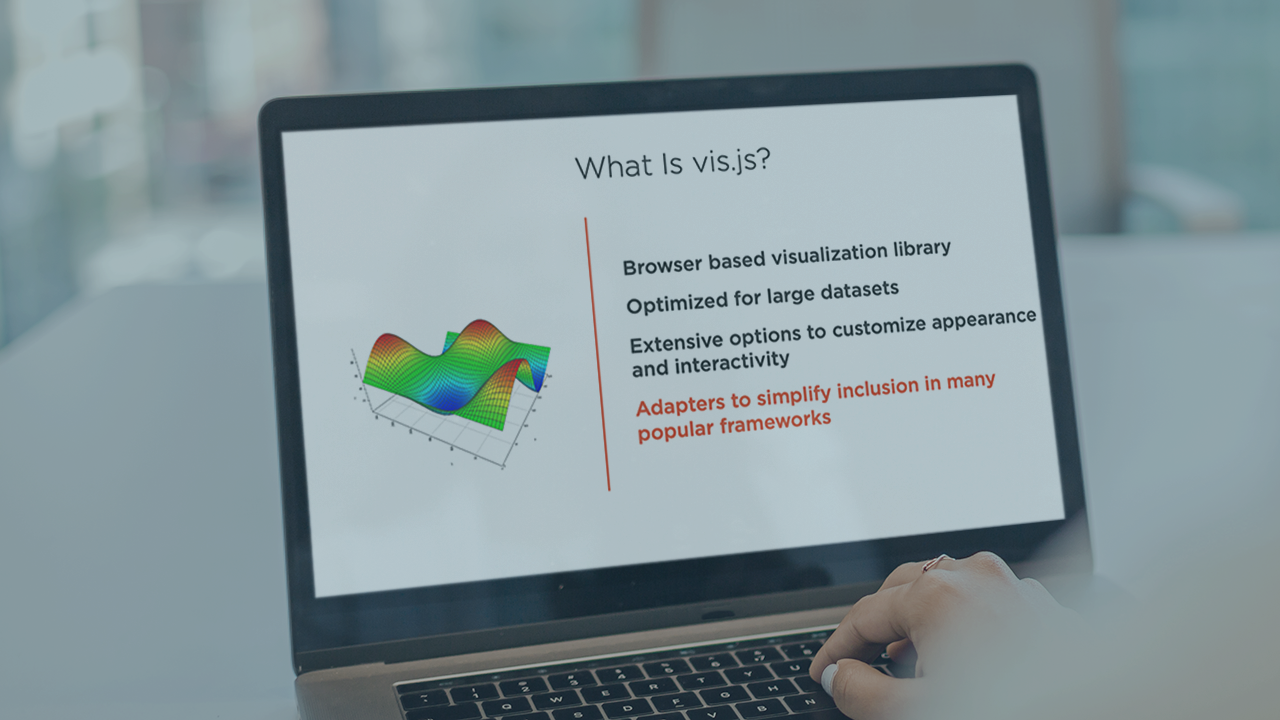
Data has never been so plentiful or easy to gather as it is today. There is so much data in the world, however, that deriving meaning from it is more challenging than ever. In this course, Build Your First Data Visualization with vis.js, you’ll learn to use graphics and charts to communicate meaning from your datasets. First, you’ll explore how to create 2D graphs. Next, you’ll discover how to use the rich set of options that vis.js offers to customize your charts to maximize their impact. Finally, you’ll learn how to use the other chart types that vis.js offers, including 3D graphs, timelines, and networks. When you’re finished with this course, you’ll have the skills and knowledge of vis.js needed to clearly communicate meaning from your data.
Build Your First Data Visualization with vis.js
Beginner
Table of contents
Michael VanSickle is an application architect in Akron, Ohio. He is a mechanical engineer by training and a software engineer by choice. He is passionate about learning new programming languages and user experience design.
