
- Course
Build Your First Time Series Visualization with Dygraphs 2
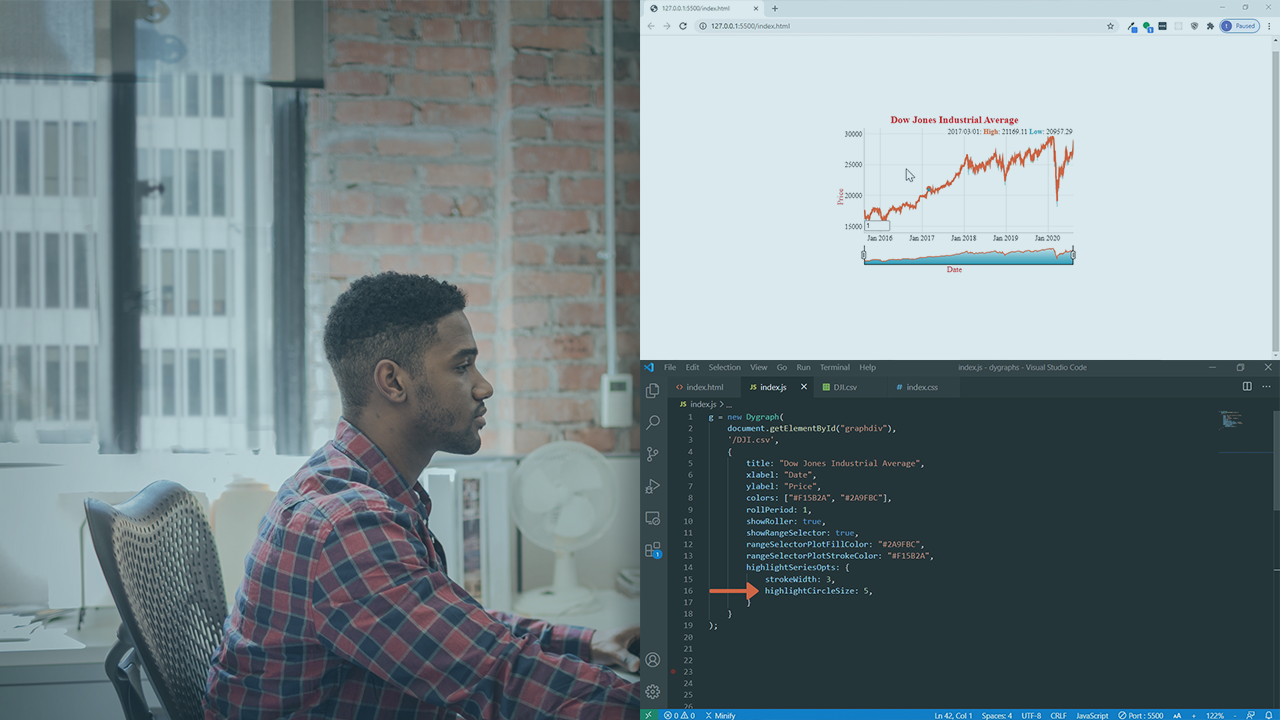
This course will teach you how to build customized time-series charts with Dygraphs.
Beginner
- Course
Build Your First Time Series Visualization with Dygraphs 2
This course will teach you how to build customized time-series charts with Dygraphs.
Beginner
Get started today
Access this course and other top-rated tech content with one of our business plans.
Try this course for free
Access this course and other top-rated tech content with one of our individual plans.
This course is included in the libraries shown below:
- Data
What you'll learn
Dygraphs is a robust JavaScript charting library that enables us to harness the power of time series data by creating beautiful and functional visualizations. In this course, Build Your First Time Series Visualization with Dygraphs 2, you’ll learn to build impressive time-series visualizations. First, you’ll explore how to set up Dygraphs to create a simple time-series visualization. Next, you’ll discover how to load data and debug some common errors. Finally, you’ll learn how to how to customize your charts with annotations, interactions, and other options. When you’re finished with this course, you’ll have the skills and knowledge of Dygraphs and time-series data needed to create professional visualizations customized to fit your needs.
Build Your First Time Series Visualization with Dygraphs 2
Beginner
Table of contents
Trent McMillan has a master's degree in information systems from Brigham Young University, and a love for all things data.
