
- Course
Build Your First Dashboard with ClicData
This course will teach you how to create a simple dashboard using ClicData.
Beginner
- Course
Build Your First Dashboard with ClicData
This course will teach you how to create a simple dashboard using ClicData.
Beginner
Get started today
Access this course and other top-rated tech content with one of our business plans.
Try this course for free
Access this course and other top-rated tech content with one of our individual plans.
This course is included in the libraries shown below:
- Data
What you'll learn
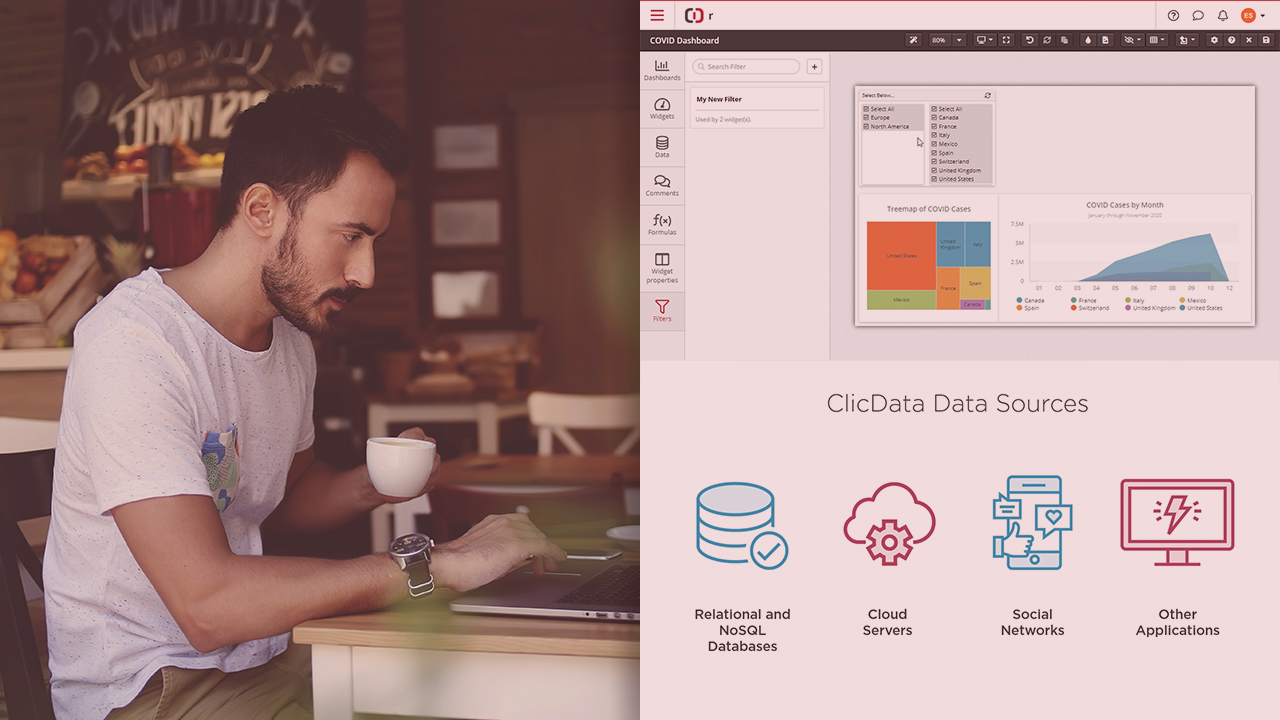
Dashboards can help organizations make decisions based on facts and on current data that is refreshed periodically. Save time and frustration by having all your data analytics on one screen, instead of flipping between screens, digging through databases, or signing into multiple analytics applications. In this course, Build Your First Dashboard with ClicData, you’ll learn to create a simple visualization using ClicData. First, you’ll explore the basic requirements, dependencies, and context to build the visualization. Next, you’ll discover how to load a simple data source. Finally, you’ll learn how to add a data series to the visualization. When you’re finished with this course, you’ll have the skills and knowledge of building and formatting visualizations needed to create a simple dashboard and visualization using ClicData.
Build Your First Dashboard with ClicData
Beginner
Emmanuel Segui is a data scientist and instructor of biostatistics. He is an R enthusiast and supports students and medical doctors in research design and statistical analysis.
