
- Course
Building Visualizations with MATLAB
This course aims to build and solidify your understanding of what data visualization is, why it is important, and eventually, how to build visualizations and customise them from your own datasets using MATLAB.
Beginner
- Course
Building Visualizations with MATLAB
This course aims to build and solidify your understanding of what data visualization is, why it is important, and eventually, how to build visualizations and customise them from your own datasets using MATLAB.
Beginner
Get started today
Access this course and other top-rated tech content with one of our business plans.
Try this course for free
Access this course and other top-rated tech content with one of our individual plans.
This course is included in the libraries shown below:
- Data
What you'll learn
There has been an explosion of data and abundance of data sources post-2010. If you’re a data analyst or are involved in data-driven decision making for your organization, understanding the data you’re provided with or obtained becomes crucial.
In this course, Building Visualizations with MATLAB, you'll focus on a key component in understanding your data - data visualization - and MATLAB has plenty of options to do just that.
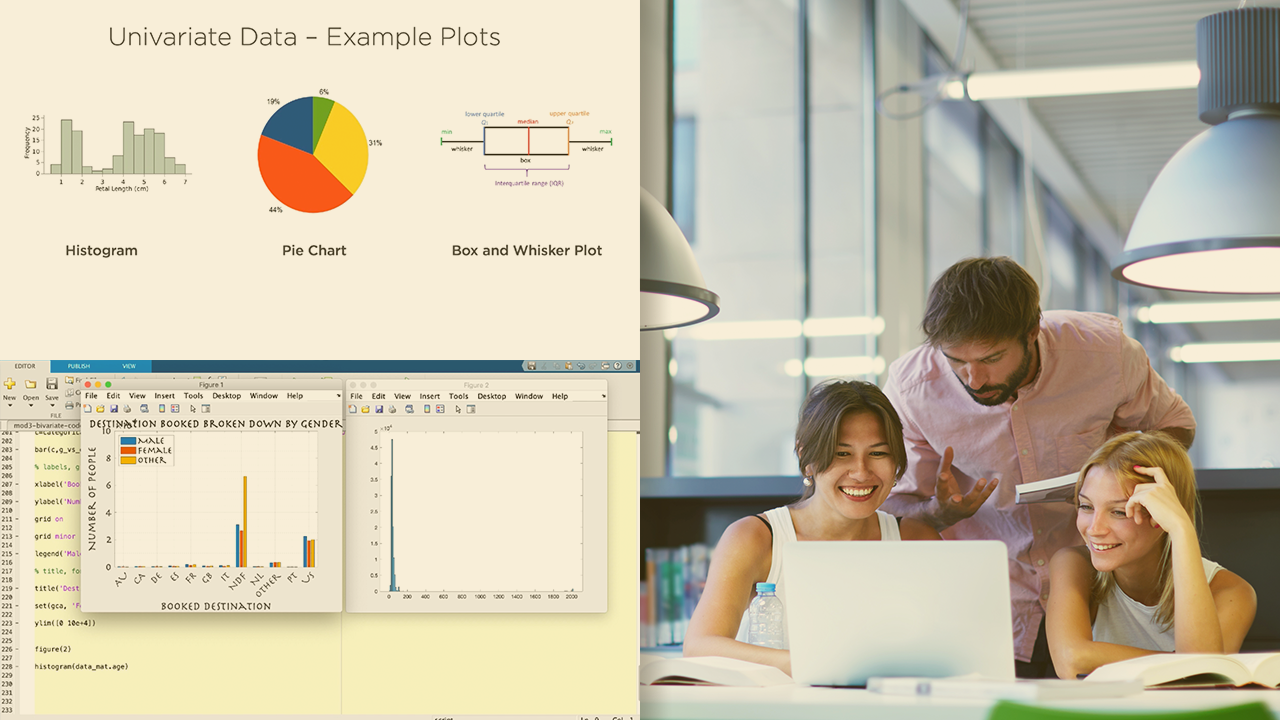
First, you’ll start off with what data visualization is and why you need it. Next, you’ll see what univariate and bivariate visualizations are and how they could influence decision making in a business case scenario.
Finally, you’ll learn how to customize the visualizations you created before by adding and manipulating elements like titles, grids, subplots etc.
When you're finished with this course, you'll be able to produce and customize visualizations from any given dataset through MATLAB.
Building Visualizations with MATLAB
Beginner
Table of contents
Pratheerth is a freelance Data Scientist who has entered the field after an eclectic mix of educational and work experiences.
