- Course
Creating Data Stories with Qlik Sense
Data stories are a way to cohesively bring together insights and data that you’ve collected together in your Qlik Sense app. Using Data Stories, you can stitch data points into a compelling narrative to present to an audience. This is an essential tool for Qlik Sense users looking to present their data discoveries to decision makers and top management.
Get started today
Access this course and other top-rated tech content with one of our business plans.
Try this course for free
Access this course and other top-rated tech content with one of our individual plans.
This course is included in the libraries shown below:
- Data
What you'll learn
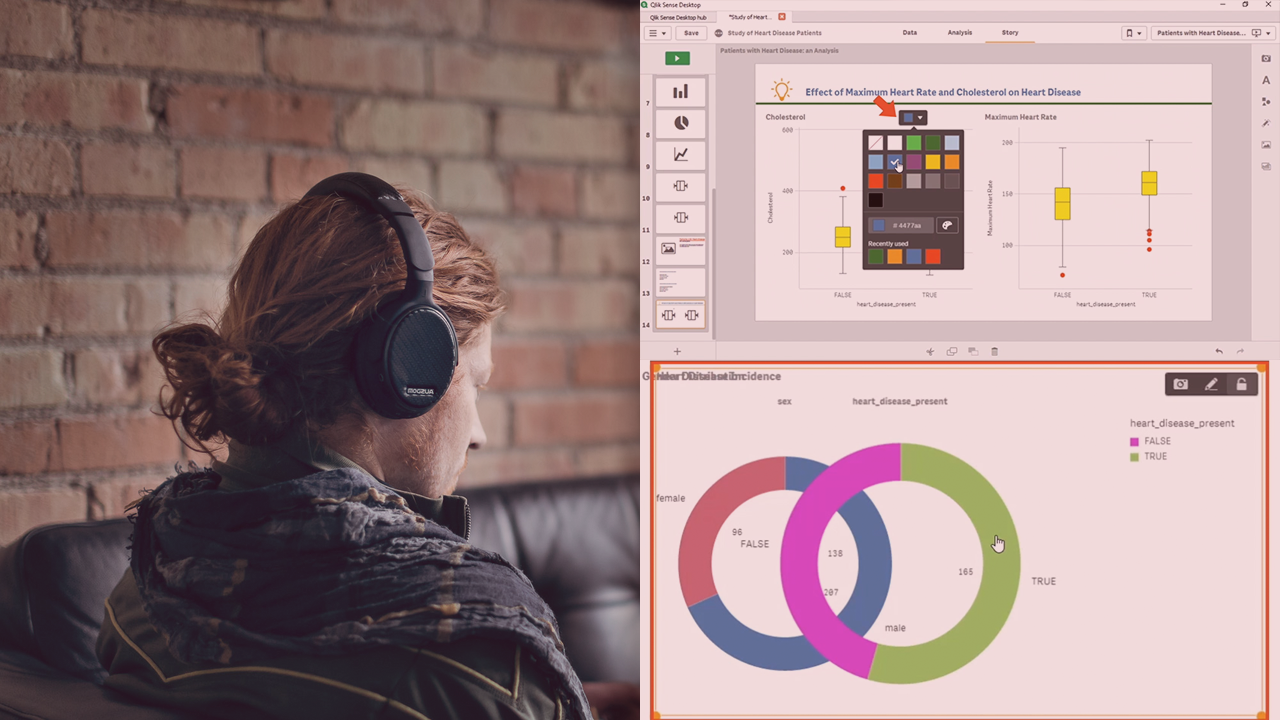
Data stories let you combine reporting, presentation, and exploratory analysis techniques to create and collaborate with your team. In this course, Creating Data Stories with Qlik Sense, you will use snapshots, images, effects and other storytelling elements to pull together compelling stories and help drive decisions in your organization using data. First, you’ll learn how to utilize the storytelling view in the Qlik Sense desktop app. Next, you’ll study the story slides, the story timeline, and introduce the concepts of snapshots and snapshot annotations. Finally, you’ll discover an understanding of the Qlik Sense storytelling elements to build up a story. Once our story has been created we will learn how we can share stories by publishing them to Qlik Sense cloud and export these stories as Powerpoint or PDF files. By the end of this course, you will be comfortable using the various Qlik Sense storytelling elements to build a compelling narrative.

