
- Course
Creating Special-purpose Plots: R Playbook
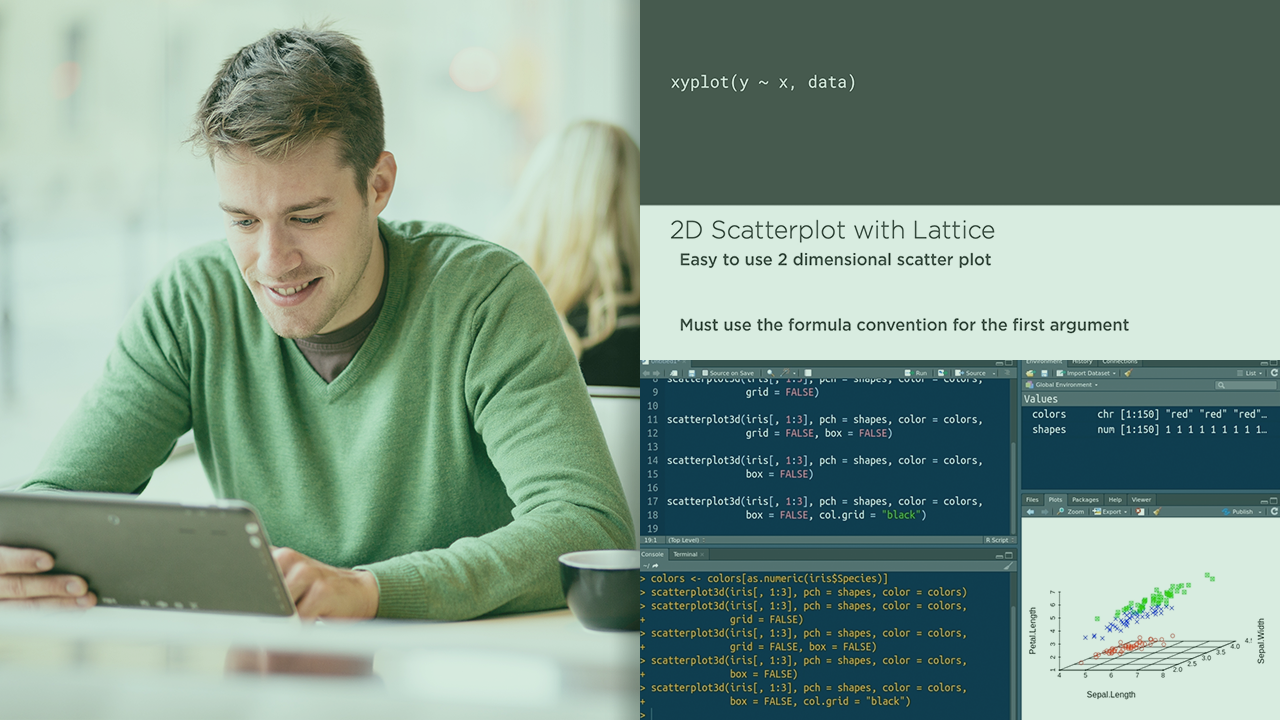
R has amazing visualization capabilities in numerous libraries. In this course, you will learn how to create visualizations with maps, correlograms, and 3D scatter plots in the Leaflet, Corrgram, Lattice, and Scatter3d libraries.
Intermediate
- Course
Creating Special-purpose Plots: R Playbook
R has amazing visualization capabilities in numerous libraries. In this course, you will learn how to create visualizations with maps, correlograms, and 3D scatter plots in the Leaflet, Corrgram, Lattice, and Scatter3d libraries.
Intermediate
Get started today
Access this course and other top-rated tech content with one of our business plans.
Try this course for free
Access this course and other top-rated tech content with one of our individual plans.
This course is included in the libraries shown below:
- Data
What you'll learn
There are many options for creating visualizations in R. In this course, Creating Special-purpose Plots: R Playbook, you will gain the ability to create a multitude of different plots you wouldn't typically be exposed to. First, you will learn how to create maps with the Leaflet library. Next, you will discover how to make correlograms with the Corrgram library. Finally, you will explore how to make 3D scatterplots in two different libraries: Lattice and Scatter3d . When you're finished with this course, you will have the skills and knowledge of niche visualizations needed to excel at creating visualizations for any application.
Creating Special-purpose Plots: R Playbook
Intermediate
Chase is currently Lead Data Scientist at Tesorio and formerly was an Assistant Professor of Finance and Economics at the University of South Carolina Upstate.
