
- Course
D3.js Data Visualization Fundamentals
D3.js gives you great flexibility on how to visualize your data on the web. This course will help you master D3 conceptually and practically in order to produce meaningful interactive charts and visual tools.
Beginner
- Course
D3.js Data Visualization Fundamentals
D3.js gives you great flexibility on how to visualize your data on the web. This course will help you master D3 conceptually and practically in order to produce meaningful interactive charts and visual tools.
Beginner
Get started today
Access this course and other top-rated tech content with one of our business plans.
Try this course for free
Access this course and other top-rated tech content with one of our individual plans.
This course is included in the libraries shown below:
- Data
What you'll learn
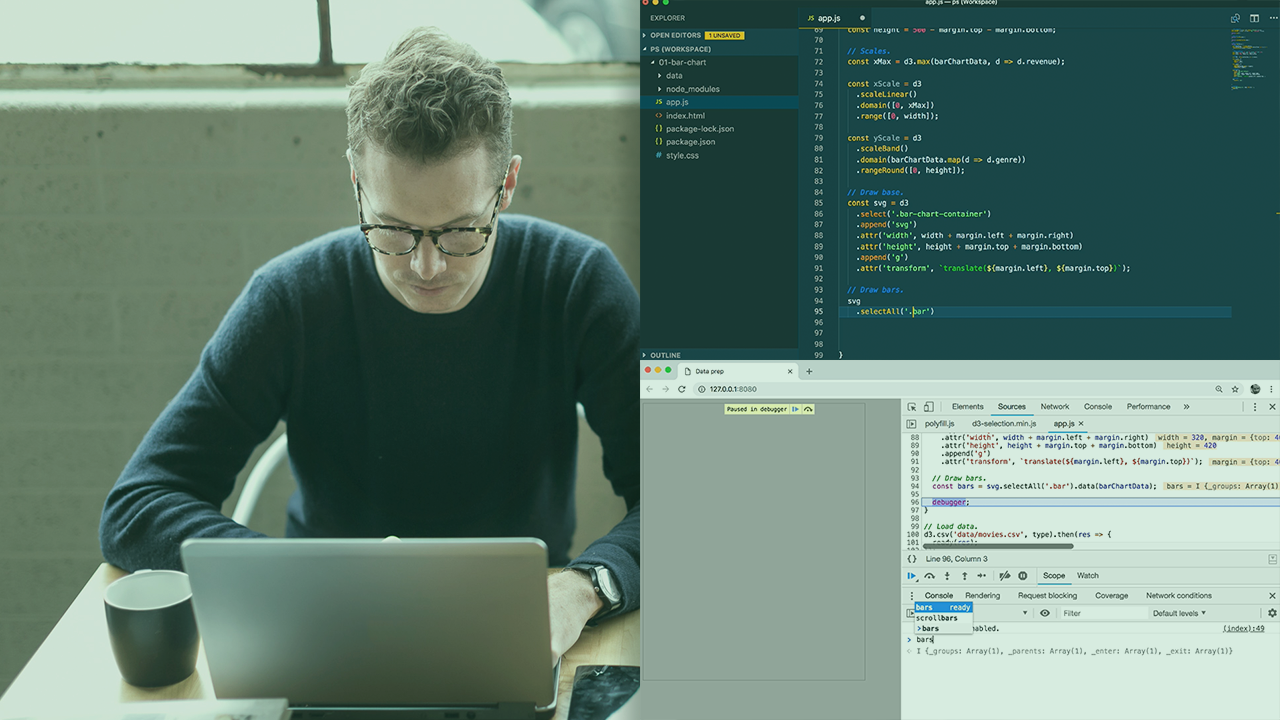
D3.js is a deep and flexible library that allows you to visualize your data on the web. It provides you with a set of useful tools to turn your data into bespoke, dynamic, and interactive visualizations. In this course, D3.js Data Visualization Fundamentals, you’ll learn to build the visual displays that best represent your data and ideas with D3. First, you’ll explore D3's key concepts. Then, you'll learn about how D3 binds data to graphical elements and how this helps you to build out any imaginable graphical representation of your data. Next, you’ll discover how to make your charts dynamic and how to add interactivity to your visuals to let your users explore the data. Finally, you'll delve into structuring your code in a configurable and reusable form by writing your own small charting library, allowing you to reuse your designs. When you’re finished with this course, you’ll have the D3 skills and knowledge needed to build your bespoke and interactive visualizations on the web.
D3.js Data Visualization Fundamentals
Beginner
Lars has been modeling and visualizing data for 20 years. He works as an independent data visualization designer and developer, focusing on interactive displays built with web technologies - mainly Javascript/D3 and Canvas.
