
- Course
Debugging Windows PowerShell in VS Code
Proficient debugging skills is what separates great developers from good developers. This course teaches you the skills required to become proficient in debugging, allowing you to take that next step towards greatness.
Intermediate
- Course
Debugging Windows PowerShell in VS Code
Proficient debugging skills is what separates great developers from good developers. This course teaches you the skills required to become proficient in debugging, allowing you to take that next step towards greatness.
Intermediate
Get started today
Access this course and other top-rated tech content with one of our business plans.
Try this course for free
Access this course and other top-rated tech content with one of our individual plans.
This course is included in the libraries shown below:
- Core Tech
What you'll learn
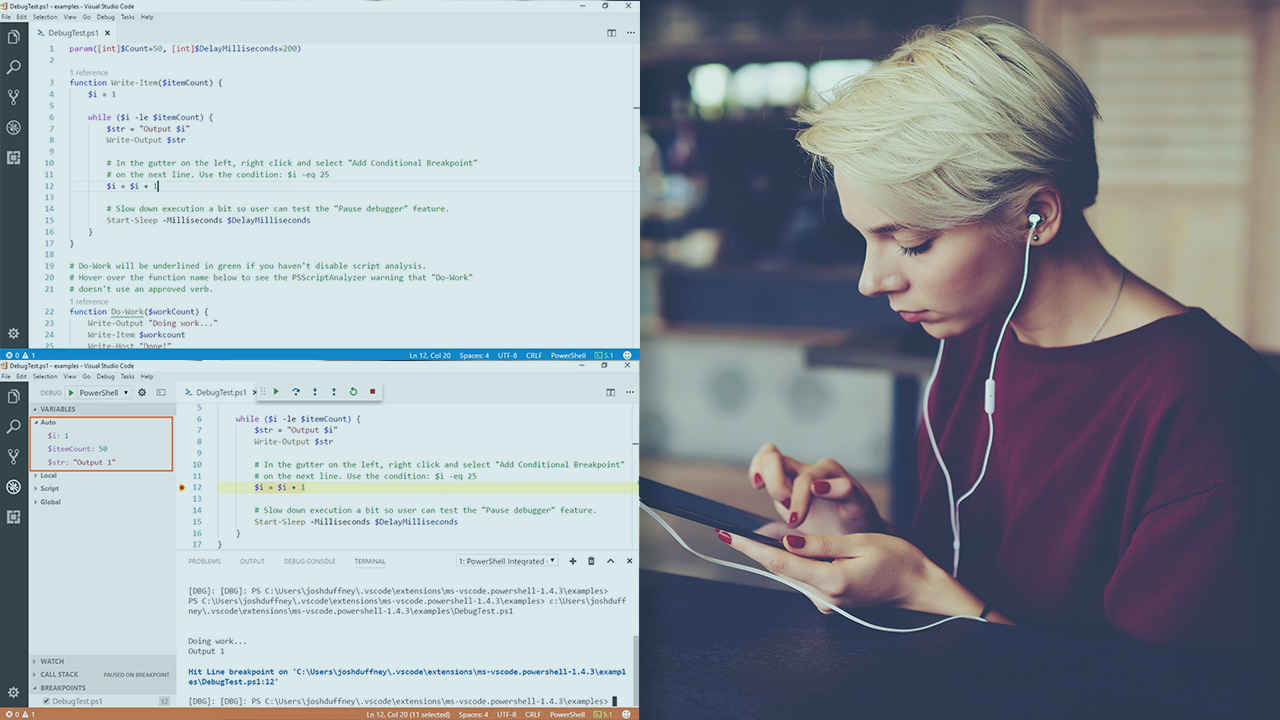
Many people do not take the time required to become proficient at debugging. They believe it's not worth the time investment. What they don't realize is that mastering debugging actually saves them a lot more time than they would put in. In this course, Debugging Windows PowerShell in VS Code, you'll learn the mental process behind debugging. First, you'll learn how to debug with Visual Studio Code. Next you'll be introduced to Pester, a testing framework for PowerShell. Finally, you'll discover how to take advantage of the advanced debugging features in Visual Studio Code such as watches, call stacks, and conditional breakpoints. After you've finished the course, you'll have the knowledge required to be a proficient debugger of PowerShell code.
Debugging Windows PowerShell in VS Code
Intermediate
Josh Duffney is an IT Professional turned PowerShell Developer who is fascinated by all things DevOps and automation. He is a Pluralsight author, speaker, blogger, technical writer, and an automation engineer.
