
- Course
Exploring Data with PivotTables
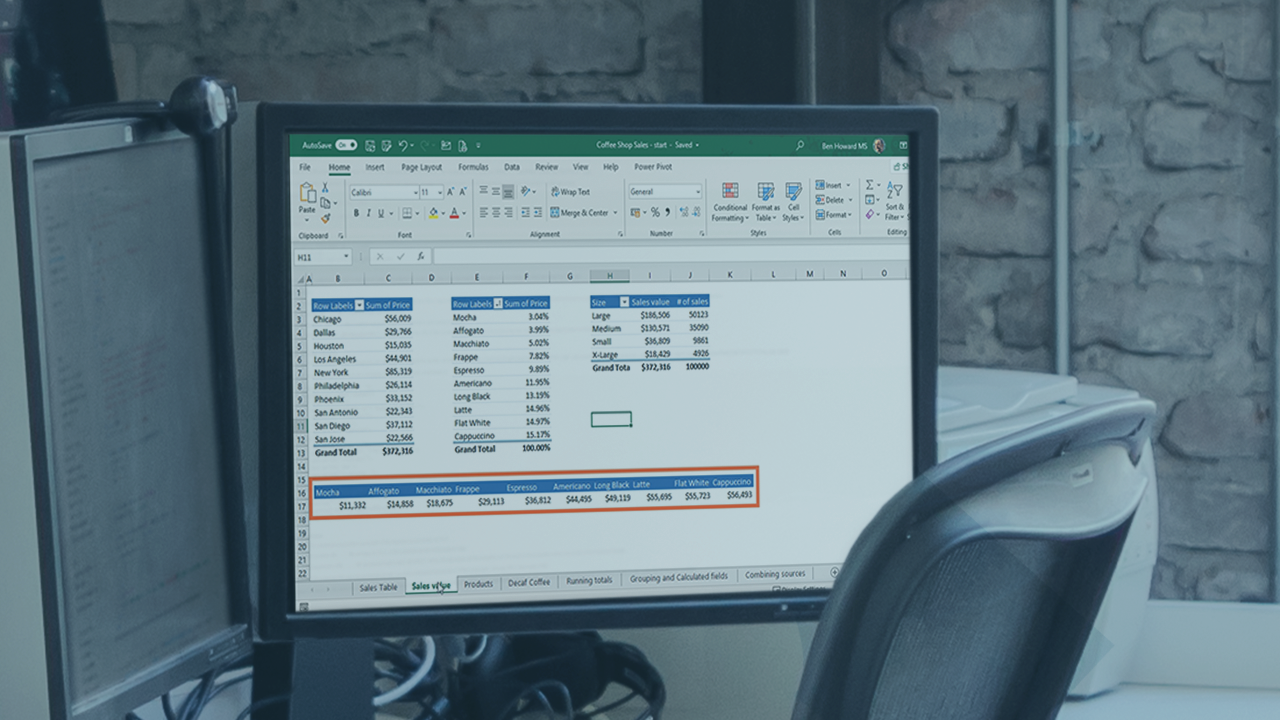
This course explores Excel PivotTables, explaining how they are used to summarize and analyze data. The course shows you how to create, modify, and configure PivotTables to take your raw data and turn it into useful and insightful information.
Beginner
- Course
Exploring Data with PivotTables
This course explores Excel PivotTables, explaining how they are used to summarize and analyze data. The course shows you how to create, modify, and configure PivotTables to take your raw data and turn it into useful and insightful information.
Beginner
Get started today
Access this course and other top-rated tech content with one of our business plans.
Try this course for free
Access this course and other top-rated tech content with one of our individual plans.
This course is included in the libraries shown below:
- Data
What you'll learn
Learning how to summarize and analyze large and complex sets of data, and communicating the results, can be a daunting process. In this course, Exploring Data with PivotTables, you will gain the skills required to quickly summarize and present sophisticated sets of data. First, you will learn what PivotTables are and when you should use them. Next, you will discover how to create PivotTables and change their layout, look, and feel. Finally, you will explore how to add new derived values and custom groups of data, and how to restrict the data that is displayed using interactive slicers and filters, helping you answer all those difficult data related questions that your co-workers and managers keep asking! When you’re finished with this course, you will have the skills and knowledge to use Excel PivotTables in order to summarize, analyze, and present your Excel data.
Exploring Data with PivotTables
Beginner
Table of contents
Ben is a Power BI & Data Specialist with a healthy interest in Microsoft Project with over 30 years of customer and implementation experience. He has been a Microsoft MVP for 13 years, is a frequent speaker at several European conferences, and blogs and creates videos on a semi-regular basis.
