
- Course
Exploring Data Visually with R
Learn how to use data visualizations like scatterplots, barcharts, histograms, and boxplots for data exploration.
Beginner
- Course
Exploring Data Visually with R
Learn how to use data visualizations like scatterplots, barcharts, histograms, and boxplots for data exploration.
Beginner
Get started today
Access this course and other top-rated tech content with one of our business plans.
Try this course for free
Access this course and other top-rated tech content with one of our individual plans.
This course is included in the libraries shown below:
- Data
What you'll learn
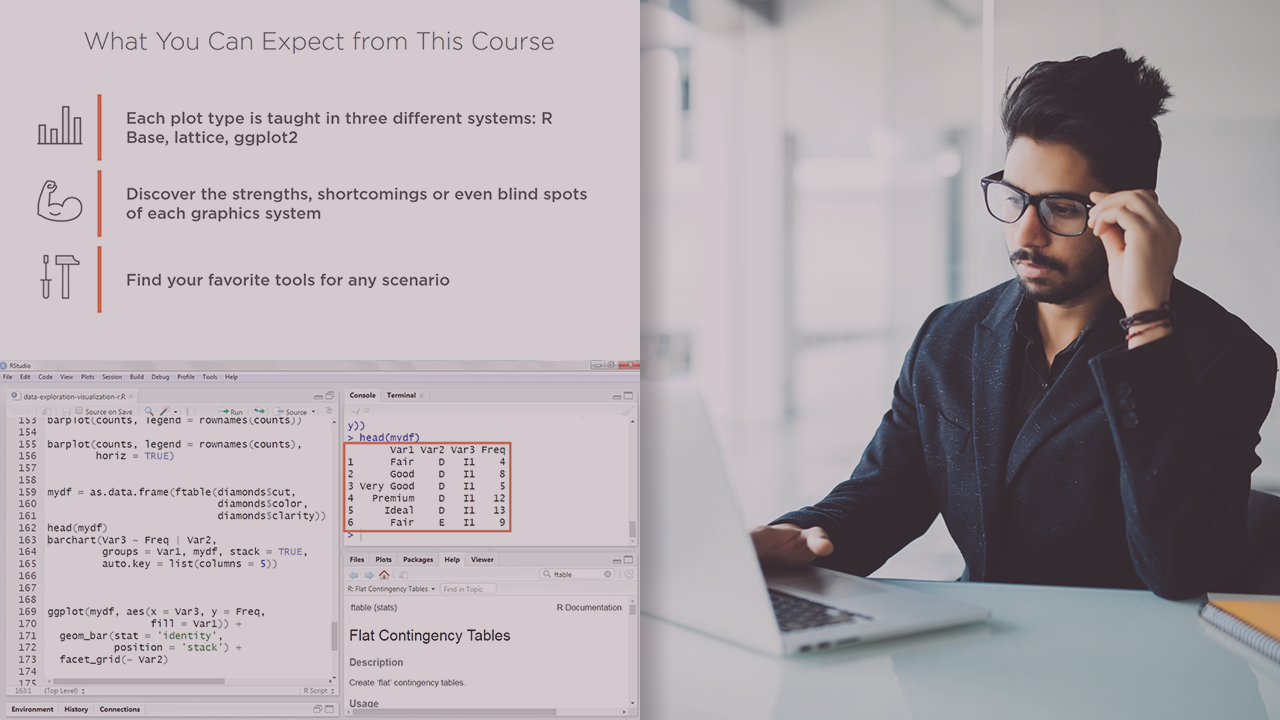
R is very versatile when it comes to data exploration. Any type of chart can be implemented in R. In this course, Exploring Data Visually with R, you will learn the standard visualization techniques that are used for data exploration. First, you will investigate how to use data visualizations. Then, you will explore common datasets with the 4 plot types including scatterplots, barcharts, histograms, and boxplots. Finally, you will be able to use and compare the 3 charting systems, which are R base, lattice, and ggplot2. When you are finished with this course, you will have the skills and knowledge to identify the most suitable chart type and to implement it in 3 different R charting tools.
Exploring Data Visually with R
Beginner
Table of contents
-
Intro | 1m 44s
-
Managing Expectations | 4m 19s
-
Data Visualizations for Data Exploration | 3m 48s
-
The Diamonds Course Dataset | 3m 51s
-
The 4 Basic Plot Types | 5m 11s
-
Adding Categorical Variables | 5m 27s
-
The 3 Gears of Plotting in R: Base, Lattice, and Ggplot2 | 2m 28s
-
Syntax Comparison | 7m 41s
-
Summary | 1m 26s
Martin is a trained biostatistician, programmer, consultant and data science enthusiast. His main objective: Explaining data science in a straightforward way. You can find his latest work over at: r-tutorials.com
