
- Course
Extracting Insights from Data with Databricks SQL
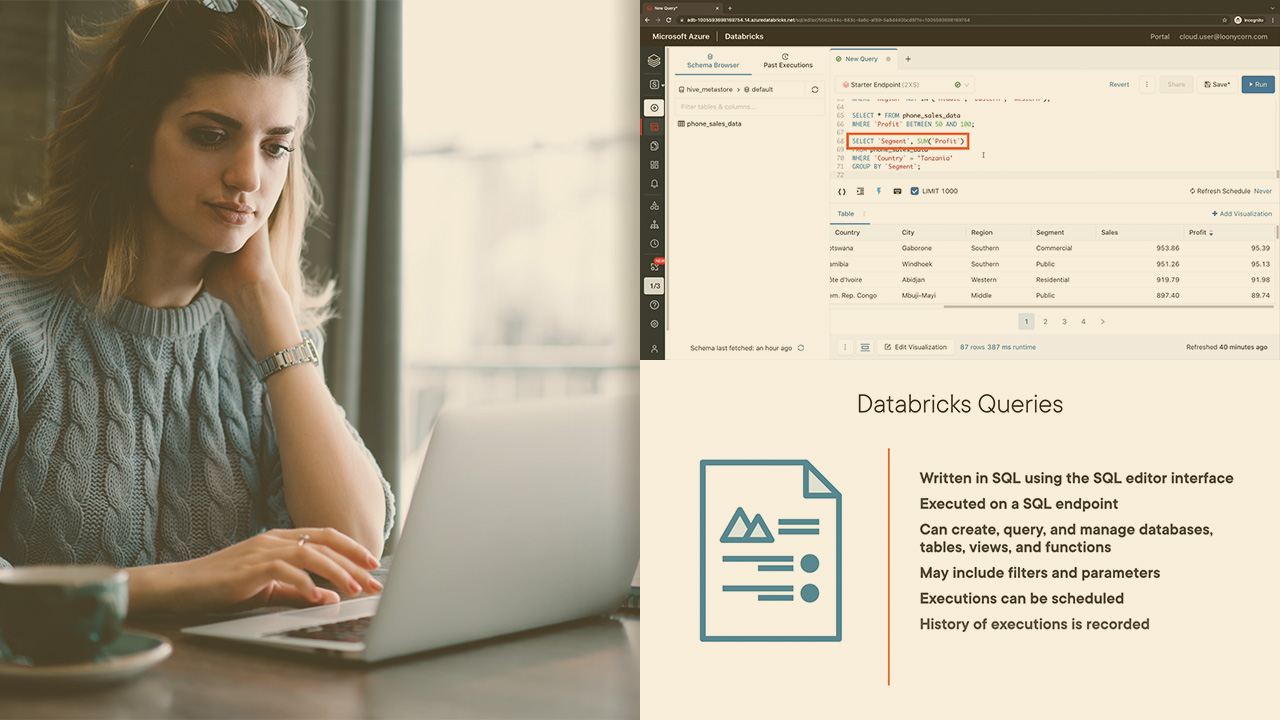
Databricks SQL provides a unified interface to create and run SQL queries, and then visualize the results using a variety of built-in charts. This course explores how these can be combined with dashboards to extract useful insights from data.
Intermediate
- Course
Extracting Insights from Data with Databricks SQL
Databricks SQL provides a unified interface to create and run SQL queries, and then visualize the results using a variety of built-in charts. This course explores how these can be combined with dashboards to extract useful insights from data.
Intermediate
Get started today
Access this course and other top-rated tech content with one of our business plans.
Try this course for free
Access this course and other top-rated tech content with one of our individual plans.
This course is included in the libraries shown below:
- Data
What you'll learn
Most data analysts, and other big data professionals will often need to draw useful information from data which can then be used to make data-driven decisions that help their organization achieve their goals. In this course, Extracting Insights from Data with Databricks SQL, you'll learn how Databricks SQL can play a crucial role in this task, with a combination of SQL queries, visualizations and dashboards. First, you'll discover different kinds of SQL queries, from the use of simple WHERE clauses to nested queries. Next, you'll explore aggregations on data, and the different types of aggregate functions which can be used to combine records in a large dataset to generate a meaningful summary, such as aggregate sales in a certain region. Finally, you'll learn how finding patterns and identifying trends in data can be greatly simplified by visualizing data. At the end of this course, you'll have the skills necessary to make the best use of all the tools available in Databricks SQL to learn from your data, extract actionable insights, and help your organizations make the best decisions based on data.
Extracting Insights from Data with Databricks SQL
Intermediate
Table of contents
-
Course Prerequisites and Outline | 1m 37s
-
An Overview of Databricks SQL | 2m 43s
-
Querying Data in Databricks | 3m 2s
-
Demo: Creating a Table from a CSV File | 6m 32s
-
Demo: Running SQL Queries for Analysis | 4m 29s
-
Demo: Filtering Results with Multiple Conditions | 2m 14s
-
Demo: The IN and BETWEEN Clauses | 3m 20s
-
Demo: Using Nested Queries | 7m 32s
An engineer at heart, I am drawn to any interesting technical topic. Big Data, ML and Cloud are presently my topics of interest.
