- Course
Finding Relationships in Data with Python
This course covers the important techniques of exploring data in order to find relationships between variables, including techniques to summarize and describe your data, and several powerful visualization tools to express relationships in that data.
Get started today
Access this course and other top-rated tech content with one of our business plans.
Try this course for free
Access this course and other top-rated tech content with one of our individual plans.
This course is included in the libraries shown below:
- Data
What you'll learn
Data science and data modeling are fast emerging as crucial capabilities that every enterprise and every technologist must possess these days. Increasingly, different organizations are using the same models and the same modeling tools, so what differs is how those models are applied to the data. Today, more than ever, it is really important that you know your data well.
In this course, Finding Relationships in Data with Python you will gain the ability to find relationships within your data that you can exploit to construct more complex models.
First, you will learn to summarize your data using univariate, bivariate and multivariate statistics. Next, you will discover how specific forms of visualization have evolved to identify and capture specific types of relationships. You will then learn some advanced tools such as the use of autocorrelation plots and KDE plots that help model probability distributions.
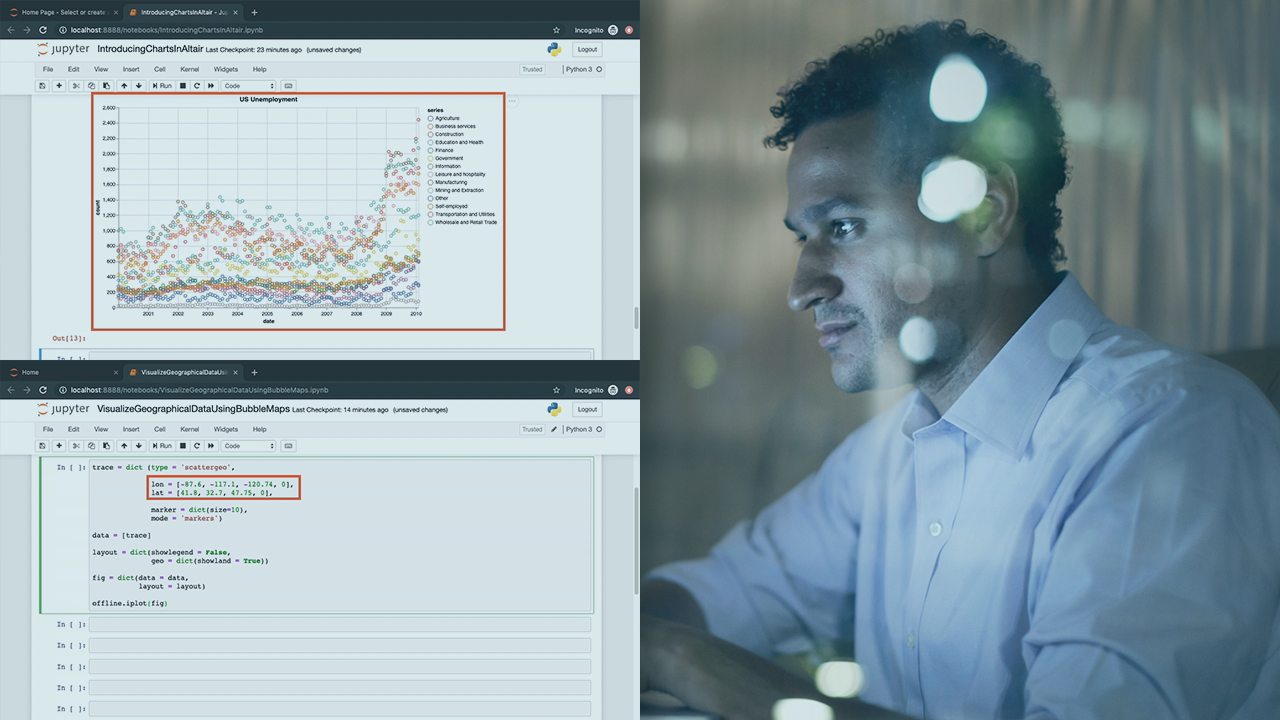
Finally, you will round out your knowledge by using four of these libraries - Matplotlib, Seaborn, Altair and Plotly to find relationships.
When you’re finished with this course, you will have the skills and knowledge to identify and exploit relationships that exist within your data, by efficiently exploring and visualizing that data.
Finding Relationships in Data with Python
-
Version Check | 16s
-
Module Overview | 1m 11s
-
Prerequisites and Course Outline | 1m 7s
-
Statistics in Understanding Data | 4m 48s
-
Measures of Central Tendency and Dispersion | 5m 33s
-
Bivariate and Multivariate Descriptive Statistics | 3m 6s
-
Demo: Loading Cleaning and Preparing Data | 4m 56s
-
Demo: Exploring and Visualizing Relationships | 6m 45s
-
Demo: Calculating and Visualizing Correlations | 7m 32s
-
Autocorrelation | 1m 46s
-
Demo: Calculating and Visualizing Autocorrelation | 5m
-
Demo: Line Plots and Bar Graphs | 3m 34s
-
Demo: Box Plots Violin Plots and Pie Charts | 5m
-
Module Summary | 1m 19s

